STCUSDT possible descending triangle breakoutStudent coin is currently trading outside of a descending triangle and above the Ichimoku cloud on the 1 hour chart with a possible breakout to the up side if it can break through the 50 EMA on the 4 hour chart or 200 EMA on the 1 hour chart. Strong support has been maintained at $0.015 for 2 weeks and should continue to maintain unless bitcoin has further corrections to the downside. Using the Fibonacci a possible target at $0.02 can be found with further upside towards $0.022 if the secondary descending triangle can also be broken.
Please note: This is not financial advice. Do your due diligence when trading and trade at your own risk.
Patterntrading

$VCEX Buy the breakoutBuy the breakout of this falling wedge
RSI turning bullish on the 4 hour
This is a mid term hold

$VPER Buy the break outDouble bottom bounce on the one hour
Falling wedge pattern almost filled
RSI divergence on the 4 hour timeframe

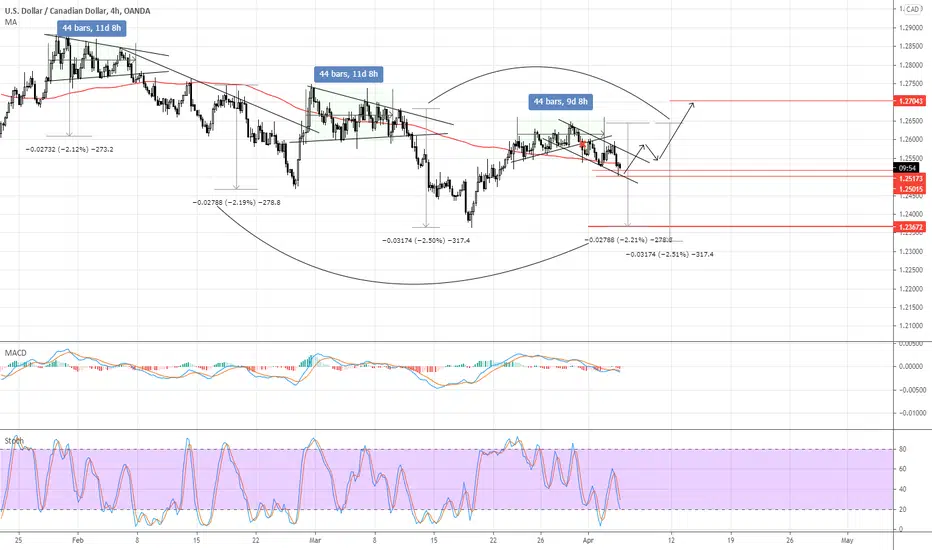
USD/CAD Bull Flag? If there's such a pattern called an "inverse" cup and handle... I would say this is it. And like many patterns, a break above it or below it signals a continuation. In my opinion, this pair is poised for a move up which aligned with everything fundamentally and of course... the bull flag.
P.S. If you enjoy these technical analyses please feel free to comment below. Let me know your thoughts! ;)
Happy Trading!
Cheers.
JMIA possible drop towards 16-19$NYSE:JMIA is currently forming a very clean head and shoulders pattern that is about to break. If the neckline breaks bellowe 30-31$ we could see the price drop towards 19$ or even lower. Keep it on your watchlist for a possible neckline break.

Bearish thingsI hope you're all having a wonderful Tuesday, here's what I'm seeing in the charts right now..
- Bullish momentum has slowed considerably since last week
- Price action does appear to be forming a descending triangle, a BEARISH REVERSAL PATTERN
- A move up to $57.5K is expected before resuming formation of the bearish pattern
- Measured move of a break below support would take bitcoin under $46K
- Should bitcoin get a bounce at this level, it would make for a beautiful double bottom on mid timeframes setting the stage for new ATH's in April.
Open interest climbing again... BTC CME Futures are looking pretty bearish.
10yr Yields fall again today -DXY looking more bullish every day this week - SPX looking incredibly bearish, I expect a decent correction tomorrow and/or Thursday.
BTC has been strongly correlated to the performance of the SPX, should we see a severe correction tomorrow -I would expect BTC to drop as well.
This pullback is setting up for an incredible opportunity -possibly the LAST time bitcoin will see sub $50K prices.. (stress on word "possibly")
Cheers.
JNY
3candlecollective


$PSYCF Buy the break out of the falling wedgeBounced off support but still within the pattern. Stay out of the chop and buy the breakout. Markets to volatile to hold short positions

BNB/USDT - close to symmetrical triangle breakoutBNB/USDT has been setting up a symmetrical triangle for a month since it hit its ATH and is now on the verge of breaking out.
Due to the way the pattern is set up and fairly low risk associated with the trade a bullish breakout seems more likely than a pattern failure.
This looks like a great buy zone to me but I will wait for breakout confirmation first before fully entering a long.
For this trade we can work with a tight stop of around 3-5% below the current price which makes for a great risk:reward ratio or simply wait for breakout confirmation before entering the trade to reduce the risk of longing a pattern failure.
Buy zone: $260-$272
Recommended stop loss area: $256.5 (very tight) - $248
Tighter stops can turn the risk:reward in your favor but also increase the risk of getting stopped out too early by fake-outs and potential wicks so choose a price you're comfortable with. They work best if you let the price come to you and you're buying right on support.
Best of luck and let me know what you think!

QCOM breaking out from a downtrend, price target 145$After testing the support around 127-130$ QCOM is ready to bounce towards 145$ after breaking out from a downtrend.

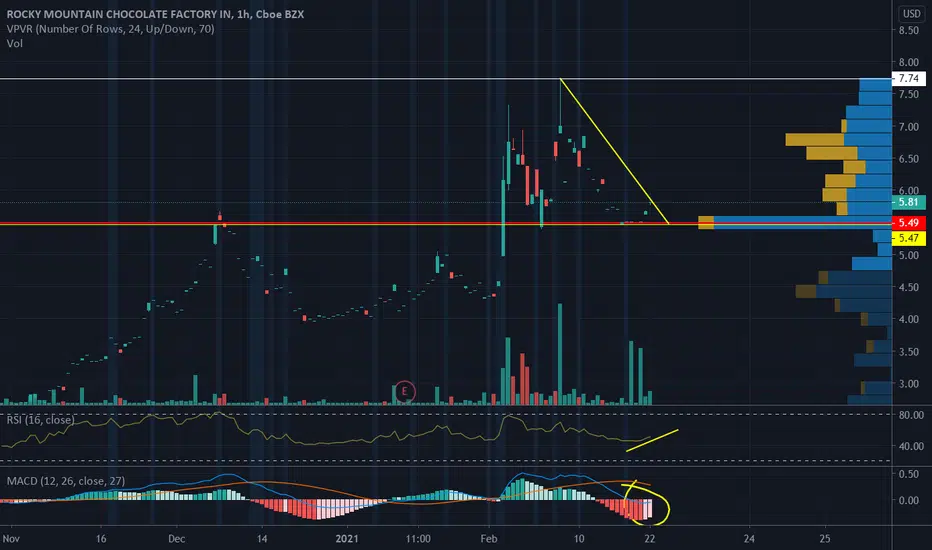
$RMCF Bullish hourly chartWho doesn't like chocolate?
Great looking chart on the hourly.
Please click a like if you like what you see on our chart.
$PLPL Buy the breakoutBuy the breakout of this trendline.
We do not want to just show you, but teach you!
Please click a like if you like what you see on the chart.

Regis Resources Limited (RRL) - LONGRegis Resources Limited (RRL) - LONG
Regis Resources, together with its subsidiaries, engage in the exploration, evaluation, and development of gold projects in Australia. The company owns 100% interests in the Duketon project located in the North Eastern Goldfields of Western Australia; and the McPhillamys project situated in the Central Western region of New South Wales. Regis Resources Limited was incorporated in 1986 and is headquartered in Perth, Australia.
Technicals:
This is a med/long term hold for me with a phenomenal RRR. On my previous analysis I mentioned that from the extension of the descending triangle, a further move down to the $3.15-$3.35 mark was imminent (which is coincidentally where the long term trendline support, and major all time fib support of 78.6% exist). A long entry around this area would present extremely good risk/reward. Conservative traders could look for a dow entry off the bounce.
Fundamentals:
RRL is significantly undervalued. It has a PE ratio of 9.5 compared to the Metals and Mining industry average of 12.6. Furthermore, it’s PE ratio (9.5) compared to the Australian market (22.6) makes it even better value.
RRL also has very high quality earnings (see attached spreadsheet) and has historically grown by 15% annually (this year actually at @ 22.2%).
It’s net profit margins have consistently increased as well. It doesn’t take a rocket scientist to look at the escalation of the revenue and profit over the past 5 years to tell that this is a company that is very well structured and financially stable; 5 years ago it’s debt to equity ratio was 4.9% and now it is debt free and also has a 23.9% return on equity.
It’s seen some noticeable purchasing from directors and major shareholders since November, which is also a positive sign.
Although the average management tenure is 1.4 years, Mr. Jim Beyer, has been the CEO and Managing Director at Regis Resources Limited since October 15, 2018. Previously he was the CEO of Mount Gibson Iron Limited from December 2011 to May 14, 2012 and its Chief Operating Officer from November 2011 until May 14, 2012. In addition he has also held general management roles with Newmont Mining Corporation where he was responsible for the development and implementation of Business Improvement initiatives and Technical Services support across the Asia Pacific region. He served as Operations General Manager for Boddington Gold Mine from 2007 to 2010, where he was responsible for start-up preparations, commissioning and production ramp up. He was General Manager of the Pajingo Gold Mine from 2004 to 2006. He has a broad range of operating and start up experience encompassing 25 years across a number of commodities. In the past ten years he has held general management, operational and planning roles with WMC Resources at its Olympic Dam operation. Mr. Beyer holds a Bachelor of Engineering (Mining) degree, a Masters of Geoscience (Mineral Economics) and is a Vice President of the Executive Council of the Association of Mining & Exploration Companies (AMEC).
Never take stock tips. Educate yourself and always DYOR whilst implementing a rigid risk management plan before investing your own money.

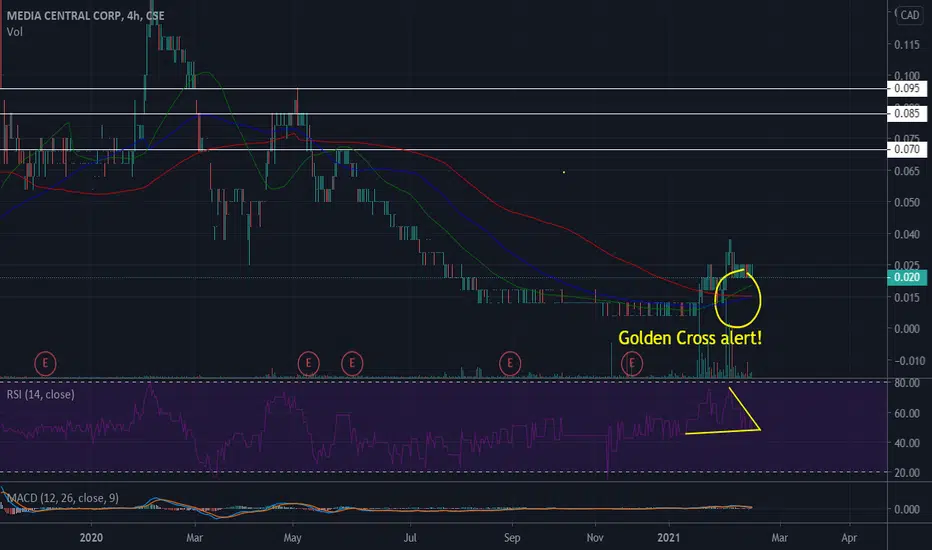
FLYY Golden Cross AlertWatch for the break out on the RSI. #Goldencross is very bullish and volume comes in fast and price can go parabolic. This ones been consolidating slowly and is due for its continuous uptrend. #roundingbottom
TSLA - just guessingPatterns
- increasing slope with every bull run so far
- price appears to be at new furthest point from 55 EMA in stock history
- stock is 10x after one year and 2x in the last three months
- EMAs spread wide
Other Potential Factors
- buys from S&P inclusion to run out eventually
- looks like bitcoin did three years ago (crazy impulse wave)
- is the company really doing that much better than last year?
- market cap is 32 x revenue from 2019
Doubts About My Prediction
- investors may believe too strongly in long-term to sell
- strong company and leader in uncertain times
- extremely high brand affinity
- betting against Elon Musk is historically proven to be a bad idea
***IMPORTANT***
I'm very new to this, don't trust me!


BTC PULBACKHi
Let's check the news before any activity.
Whalemap shows the number of bitcoin which is held is overbought.
News like PayPal and other exaggerating ends.
Is there any trend? don't have a pullback, if there is? definitely, they tried to cheat you.
They are Shark, not Whales.

SPY: A Trump & Biden ElectionI think the market is smart. We need to read its psychology. I received countless texts, calls and DM's about this election year and the potential results. Well its tough. I have many friends on both sides of the spectrum and some of Biden's and even California's tax plans is really important to understand.
While it would potentially take years and months to implement and Republicans are anticipated to control Congress and a decent control in the Supreme Court. This is important in providing the Check's & Balances in our Primarily Two Party System. (I see you Green & Libertarian Party).
Thus far we are in a consolidation phase. It is hard to call this pattern a rising wedge...which often leads to a bear reversal. Is that something we are going to see under Biden? Or do we predict one final big run in the market and if Biden win's we can potentially see huge sell off's prior to the execution of his tax plan. Its a big WHAT if scenario.
I will be very honest and say I am not to sure about who is going to win. Biden looks to have the advantage with the various votes coming in at the last minute. I'll leave conspiracies and my personal political values on the sideline.
Chart Wise:
We set two Lower Highs.
Two Higher Lows.
Consolidation theory makes sense considering the election year.
IF we want to hit a big final push into HH...which seems a bit insane in this market, but potentially possible if Trump wins. The amount of people who have sat sidelines cash and waiting for a Orange Hair win is quite large. I know real estate developers and investors who told me if Trump wins they will go full steam ahead in their developments and acquisitions. So can this be a big driver for people who have money? Maybe.
I also heard of many saying they will pull out of the market if Biden wins and slowly decrease their ownership of stock to preserve portions of their wealth.
What is MOST important during this time is to BUY LOW & SELL HIGH. Be patient. Try not to touch anything at ATH's. The best posture is a defensive one. That being said I opened position around the time of the second lower high. It was a easy trade that benefitted me greatly in the last two days. So if you are willing to take a little risk try and enter as close to the bottom of the symmetrical triangle.
Again, these are all my personal opinions and not professional advice. Do your own due diligence and trust your own gut. If you have any other perspectives please let me know! I would like to continue to educate myself and see how other trades think and perceive the markets.
Thanks again. Stay safe & Happy Hunting!
Reg.

Major Resistance Broken, BTC Bullish to next Target at ATHBTC has broken Major Resistance, BTC now Bullish to next Target at ATH

BTCUSD - DAILY - POTENTIAL BEARISH BAT I'm not a Bitcoin or Crypto follower at all, but I glanced at it this morning after getting a question about it & saw that from a technical perspective we have a potential bearish bat pattern setting up on it. If you're someone who is predicting more future consolidation this we would a perfect opportunity to sell at the previous level of structure resistance.
Akil

NZDUSD - 4HR - Potential Bearish Butterfly & Cypher FormationsWe have 2 potential bearish pattern formations setting up here on the NZDUSD 4 Hour Timeframe. A potential Bearish Butterfly (in purple) & a potential bearish Cypher (in blue). The completion zone for both of these patterns line up at a retest of previous structure highs (for the butterfly specifically) proving a good shelf to place protective stops.
I hope you guys have a great week of trading. Another pretty heavy week of news releases so stay safe out there!
Your Trading Coach - Akil

CADJPY - 4 HOUR - A Butterfly Pattern That I Actually LikeYou don't see me post a lot about the Butterfly Pattern or any of the others that have a "D" Completion point beyond the "X" leg because they don't fit within my philosophy & how I value structure. With that being said I don't dislike the pattern, infact it's one of my favorites from a price action psychology perspective (which we won't get into here).
But what makes this potential Bearish Butterfly Pattern stand out is the fact that we wouldn't have to have a blind stop loss because the D completion actually lines up with a higher timeframe level of structure looking left. This adds more confluence to the opportunity whether you're a butterfly trader or a structure playing looking to build your CTS score at that level. Either way I think it's a decent opportunity to look for shorts.
If you have any questions or what to leave any comments about this idea please do so below. Also, don't be shy about sharing how you view this pair as the more ideas we have the more newer traders get to learn.
Your Trading Coach - Akil

USDCAD - 1 HOUR - BULLISH GARTLEY - A LOOK AT SECONDARY CHANCESBefore the close on Friday we saw the completion of a bullish Gartley pattern here on the USDCAD at 1.3054. Price immediately pushed down (causing us to adjust our targets) before closing slightly higher to end the week. For those who didn't have a chance to get involved in this opportunity, there are 2 ways that you can still do so.
1) Let a buy limit order at the original D completion price & IF price works it's way back to that level THEN you'll be filled at the same price were supposed to be filled at anyway.
2) Wait for a more conservative entry such as a retest of the lows & a hold. This is called a Double Bottom and it would provide more confirmation than the limit order that price is likely to hold that level.
As always if you have any questions, comments, or just want to share some feedback or your ideas, please don't hesitate to leave them below in the comment section.
*There's also a bigger potential bullish cypher on the 4h hour chart. I'll link that idea below*
Your Trading Coach - Akil
