AUDJPY Daily Analysis 3/8/20AUDJPY Short Idea
AJ is still very bearish and could remain so for a while.
Ideally we would like to see a nice retracement to a key level followed by strong bearish setups and confirmation that supports the trade idea.
Look to target lower toward our -27% fib level after a confirmed reversal from the 38.2% or 61.8% fib level
Patterntrading

USOIL (WTI) Daily Analysis 2/23/20WTI short idea
Hugely bearish movement has been happening recently and we can see that the weekly & daily are bearish while the monthly and 4hour are bullish.
We are definitely favoring the bears in this scenario. We will look to capitalize on a bearish continuation once we see a confirmed retest of a key prz level & resistance.
Looking to target lower toward our weekly support around 47.50

EURCHF Daily Analysis 2/23/20Eurchf Short Idea
All significant timeframes have been very bearish as that seems to be the case with most eurxxx pairs.
Because this is such a steep trend and price action has just been falling we have limited options.
Price action could keep this bearish momentum and continue falling into our monthly support level around 1.04000
We see a long awaited pullback to a key prz level and key resistance. From here we could look to enter on signs of a bearish trend continuation.
Either way we are looking to short and target down toward our monthly support around 1.04000

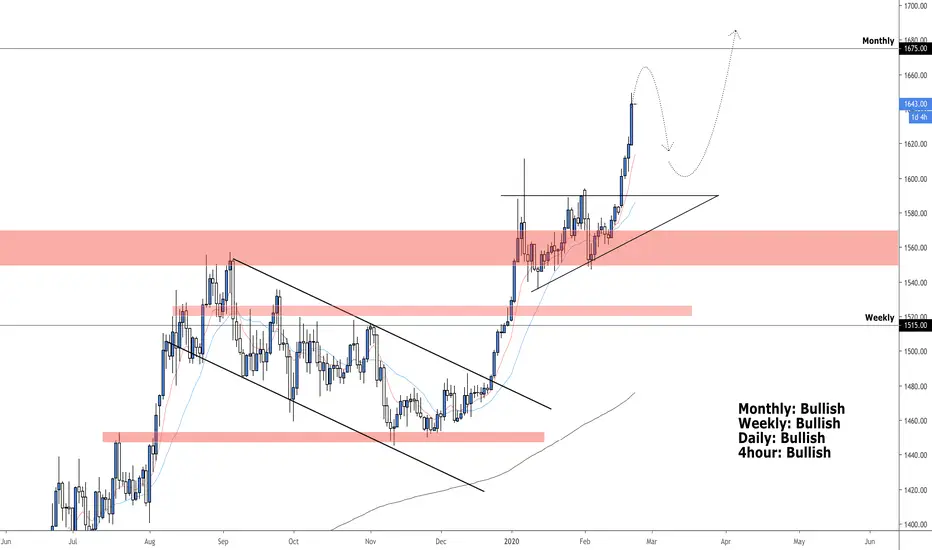
XAUUSD Daily Analysis 2/23/20Gold Long Idea
We can see that gold has been very bullish on all significant timeframes and is not showing any real signs of slowing down.
With this trend in mind we are looking to capitalize on natural market pullbacks. Ideally a nice retracement to broken resistance, that would be now tested as support with plenty bullish confirmations would be enough to enter on.
Look to target back toward the monthly resistance level around 1675.000 and potentially even higher toward our weekly resistance around 1800.00 for a longer term trade.
USDCHF Daily Analysis 2/23/20UCHF Short Idea
From a trend analysis perspective we have some mixed signals as the monthly and daily trends are both bearish and the weekly and 4hour trends are both bullish.
How price action reacts to this level of support will determine our next move.
We’re looking for this play out 1 of 2 ways:
Price action bounces from current support at 0.97750 and we will look to target the resistance zone at the top of the range around 0.98500
We see price action break the lower support and retests as resistance. Upon a confirmed retest/lower high we will look to target lower toward the next major support level around 0.96300

NZDCAD Daily Analysis 2/23/20NZDCAD Neutral idea
NCAD has been very bearish as expected from previous analysis. We finally reached our weekly support around 0.84000
From this level we are waiting on confirmation before making our next move
We could see price action bounce from this level and start retracing. A good short term target would be 0.85000. Look for confirmation at this level
Or
We could see bearish momentum continue and look for price action to fall below our major support zone

EURJPY Daily Analysis 2/23/20EURJPY Neutral Idea
EJ is at a key level currently and how it reacts here will determine what our idea for a trade will be.
Two ways that we want to see this play out:
Break of resistance zone followed by a retest with strong bullish confirmations, target a higher resistance level around 122.500
A bounce from the current level with strong bearish setups, target lower support around 120.000

EURUSD Daily Analysis 2/23/20EURUSD Short Idea
The most bearish of them all! EU has been all bears the last couple weeks but on Friday we saw the bulls start to step in again.
We’re looking to short after a significant pullback to a key prz level followed by bearish setups.
Look to target back toward our low around 1.07750 and potentially lower toward our monthly support around 1.07000

AUDJPY Daily Analysis 2/23/20AUDJPY Short Idea
AJ is still very bearish on all timeframes and we will continue to look for short opportunities.
Currently we are seeing an ascending wedge forming right at our major resistance level.
From here we need to see strong bearish setups and plenty of confirmation before entering short. Look to target toward lower major support levels around 72.650 & 71.700 area.

AUDUSD Daily Analysis 2/23/20AUDUSD Short Idea
Price action is primarily bearish on all timeframes (listed on the chart)
Last week we saw a major support zone break after large bearish volume pushed price action lower.
This week we are looking for a retest along with other significant confluences like key fib levels, ma’s and candlestick confirmations.
Look to target toward the negative percent fib levels and potentially long term toward our weekly support around 0.64000

DXY Daily Analysis 2/23/20DXY Long Idea
USD has been very bullish over the last two months. We anticipated the 100.00 area to be tested where we could see some bears start to step in and drive price lower.
If this is a confirmed reversal we could see a significant retracement to our monthly level or any prz level before the trend continues with the overall bullish sentiment.

NZDCAD Daily Analysis 2/16/20NZDCAD Short idea
This pair has been very bearish after seeing strong rejection from the weekly 88.6% fib level.
We’re now seeing a healthy trend print lower lows and lower highs repeatedly
Look to re-enter on a key fib level retracement and/or significant pattern with strong bearish setups.
Target for this setup will be 0.84000

EURJPY Daily Analysis 2/16/20EURJPY Short Idea
We see Ej showing very strong bearish volume after a break of the 120.000 zone.
From here we can see two scenarios play out.
Ej continues to drop from the current level all the way to our daily support around 118.000
Ej establishes a bottom and retraces to a key fib level giving us an opportunity to enter short on a lower high after bearish confirmations present themselves.
118.000 is the overall lower target

EURUSD Daily Analysis 2/16/20EURUSD Short Idea
We’re definitely looking to short Eurusd and ride the trend if the opportunity presents itself.
Price action has been very bearish over the last 2 weeks and does not seem to be slowing down.
Our target is the monthly support around 1.07000 but there are two ways we could see that play out.
Price action may keep free falling all the way until the monthly or we could see an established lower low followed by a retracement to a key fib level.
This is where we have the opportunity to capitalize and short lower after seeing strong rejection + bearish confirmations.

AUDUSD Daily Analysis 2/16/20AUDUSD Short Idea
After a large bearish push toward our 0.67000 zone we have seen price action consolidate around this region.
From this point we need to see either a significant break lower than 0.67000 or a strong bounce from this area sending price action back up.
I’m favoring a short opportunity on this setup and will ideally look for a significant break and retest followed by many bearish confirmations.

DXY Daily Analysis 2/16/20DXY Long Idea
Price action has been majorly bullish the past 2 weeks and does not look to be slowing down. Ideally a natural market retest would be nice to see but dxy could likely go straight to the 100.00 area
