20.03.25 Morning ForecastPairs on Watch -
FX:EURUSD
FX:GBPUSD
FX:AUDJPY
FX:NZDJPY
A short overview of the instruments I am looking at for today, multi-timeframe analysis down to what I will be looking at for an entry. Enjoy!
Patterntrading

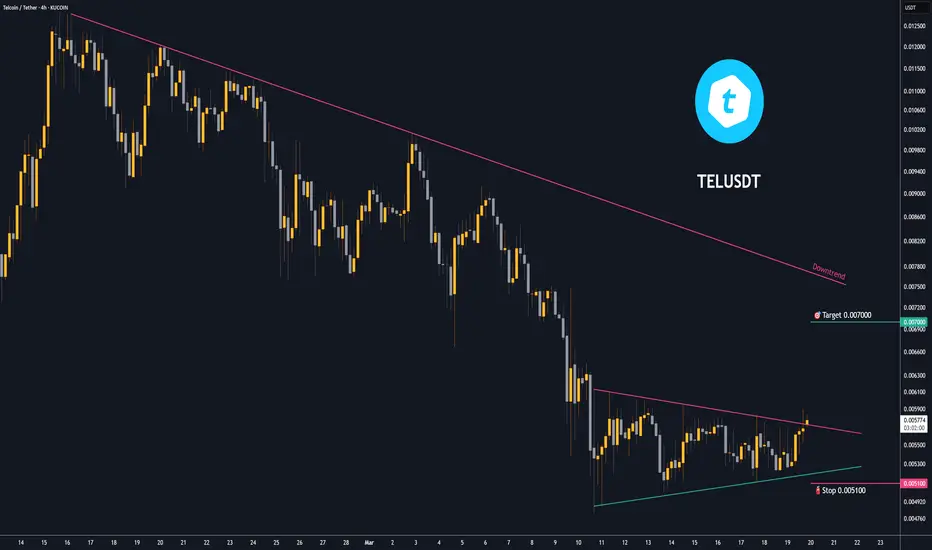
Trading opportunity for TELUSDTBased on technical factors there is a Buy position in :
📊 TELUSDT
🔵 Buy Now
🪫Stop loss 0.005100
🔋Target 0.007000
📏 R/R 2
💸RISK : 1%
We hope it is profitable for you ❤️
Please support our activity with your likes👍 and comments📝
Trading opportunity for MOCAUSDT Moca NetworkBased on technical factors there is a Buy position in :
📊 MOCAUSDT
🔵 Buy Now
🪫Stop loss 0.07000
🔋Target 0.15000
📏 R/R 2
💸RISK : 1%
We hope it is profitable for you ❤️
Please support our activity with your likes👍 and comments📝

19.03.25 Morning ForecastPairs on Watch -
FX:AUDJPY
OANDA:UK100GBP
FX:AUDCHF
FX:USDJPY
A short overview of the instruments I am looking at for today, multi-timeframe analysis down to what I will be looking at for an entry. Enjoy!

18.03.25 Morning ForecastPairs on Watch -
FX:EURNZD
FX:GBPNZD
FX:GBPUSD
A short overview of the instruments I am looking at for today, multi-timeframe analysis down to what I will be looking at for an entry. Enjoy!

XAG/USD +4% Missed Trade In this short recap I cover a missed trade on OANDA:XAGUSD (Silver).
I was looking for the insurance entry structure as explained, this failed and I missed the 4H limit order play by minutes. A lovely position nonetheless and a great lesson learned for myself moving forward.
I hope you enjoyed, any questions drop them below!

17.03.25 Morning ForecastPairs on Watch -
FX:GBPAUD
OANDA:UK100GBP
FX:NZDJPY
FX:USDJPY
A short overview of the instruments I am looking at for today, multi-timeframe analysis down to what I will be looking at for an entry. Enjoy!

14.03.25 Morning ForecastPairs on Watch -
FX:EURAUD
FX:GBPUSD
FX:EURUSD
A short overview of the instruments I am looking at for today, multi-timeframe analysis down to what I will be looking at for an entry. Enjoy!

13.03.25 Morning ForecastPairs on Watch -
FX:USDJPY
FX:EURAUD
FX:GBPNZD
A short overview of the instruments I am looking at for today, multi-timeframe analysis down to what I will be looking at for an entry. Enjoy!

12.03.25 Morning ForecastPairs on Watch -
FX:USDJPY
FX:GBPUSD
FX:EURAUD
A short overview of the instruments I am looking at for today, multi-timeframe analysis down to what I will be looking at for an entry. Enjoy!

Fractality in Trading: the market’s hidden patternHave you ever noticed how price movements look similar across different timeframes? This is Fractality in Trading, a concept that suggests markets behave in repeating patterns regardless of scale.
In the chart above, we compare the 1-Day (left) vs. 1-Week (right) timeframe for NASDAQ 100 Futures. Despite the difference in time horizons, the price movements, corrections, and trend reversals mirror each other, following the same wave structures.
What Does This Mean for Traders?
✔️ Price Action Repeats Itself: Market cycles—uptrends, downtrends, and consolidations—occur in similar ways across different timeframes.
✔️ Multi-Timeframe Analysis (MTA): By analyzing a higher timeframe (1W), traders can identify key trends and use the lower timeframe (1D) for precision entries.
✔️ Scalability: Whether you are a swing trader, day trader, or long-term investor, the same patterns apply, making technical analysis universally effective.
Key Takeaway
Understanding fractality helps traders align their trades with the dominant trend, reducing false signals and improving trade confidence.
Do you use multi-timeframe analysis in your strategy? Let me know in the comments!

11.03.25 Morning ForecastPairs on Watch -
OANDA:XAGUSD
FX:NZDCAD
FX:GBPNZD
A short overview of the instruments I am looking at for today, multi-timeframe analysis down to what I will be looking at for an entry. Enjoy!

10.03.25 Morning ForecastPairs on Watch -
FX:EURAUD
FX:USDJPY
A short overview of the instruments I am looking at for today, multi-timeframe analysis down to what I will be looking at for an entry. Enjoy!

$AFRM $70-$80 target, cup and handle WEEKLY, pt. 2 chartYes, I used the brush and drew that juicy cup and handle. I don't know, friends, this one looks really good for setup to long. Part 1 was posted just before this give it a glance. The EMA and SMA used here was the 50 and in the previous chart was 200.
WSL

07.03.25.25 Morning ForecastPairs on Watch -
FX:GBPAUD
FX:GBPNZD
OANDA:XAGUSD
A short overview of the instruments I am looking at for today, multi-timeframe analysis down to what I will be looking at for an entry. Enjoy!

06.03.25.25 Morning ForecastPairs on Watch -
FX:GBPAUD
FX:GBPNZD
FX:USDCHF
A short overview of the instruments I am looking at for today, multi-timeframe analysis down to what I will be looking at for an entry. Enjoy!

EURGBP new bearish?
OANDA:EURGBP we are have strong bearish push, currently we can see BEARIS HFLAG patter and zone is in BF, bouth are breaked, +price is bounce few times on strong sup zone 0.83600, here still higher bearish expecting.
SUP zone: 0.83600
RES zone: 0.82500, 0.82300

05.03.25 Morning ForecastPairs on Watch -
FX:USDJPY
FX:EURUSD
FX:USDCHF
A short overview of the instruments I am looking at for today, multi-timeframe analysis down to what I will be looking at for an entry. Enjoy!

04.03.25 Morning ForecastPairs on Watch -
FX:EURUSD
FX:GBPUSD
A short overview of the instruments I am looking at for today, multi-timeframe analysis down to what I will be looking at for an entry. Enjoy!

03.03.25 Morning ForecastPairs on Watch -
FX:USDJPY
A short overview of the instruments I am looking at for today, multi-timeframe analysis down to what I will be looking at for an entry. Enjoy!

27.02.25 Morning ForecastPairs on Watch -
FX:AUDNZD
FX:NZDUSD
OANDA:AU200AUD
FX:EURUSD
A short overview of the instruments I am looking at for today, multi-timeframe analysis down to what I will be looking at for an entry. Enjoy!

26.02.25 Morning ForecastPairs on Watch -
FX:AUDNZD
FX:EURNZD
A short overview of the instruments I am looking at for today, multi-timeframe analysis down to what I will be looking at for an entry. Enjoy!

GOLD Daily, H4, H1 Forecasts, Technical Analysis & Trading IdeasDaily Timeframe:
TVC:GOLD has been rising rapidly recently but has almost stopped since February 11, when it hit its uptrend channel line.
With the RSI hitting resistance at 77 and showing signs of falling, there is a high probability that a corrective wave is about to begin.
Four-hour Timeframe:
A rising wedge pattern has formed in the price.
As long as the price does not break the resistance at 2955 and the red line of the rising wedge continues upwards, a downward wave is expected to begin.
A strong bearish divergence has also formed in the RSI.
One-hour Timeframe:
A head and shoulders pattern is forming.
If the price can break the neckline downward and the blue trend line of the rising wedge is also broken, the probability of a downward wave will be very high.
