24.02.25 Morning ForecastPairs on Watch -
FX:EURCAD
A short overview of the instruments I am looking at for today, multi-timeframe analysis down to what I will be looking at for an entry. Enjoy!
Patterntrading

Mastering Candlestick Patterns: Visual Guide for Traders
🔵 Introduction
Candlestick charts are among the most popular tools used by traders to analyze price movements. Each candlestick represents price action over a specific time period and provides valuable insights into market sentiment. By recognizing and understanding candlestick patterns, traders can anticipate potential price reversals or continuations, improving their trading decisions. This article explains the most common candlestick patterns with visual examples and practical Pine Script code for detection.
🔵 Anatomy of a Candlestick
Before diving into patterns, it's essential to understand the components of a candlestick:
Body: The area between the open and close prices.
Upper Wick (Shadow): The line above the body showing the highest price.
Lower Wick (Shadow): The line below the body showing the lowest price.
Color: Indicates whether the price closed higher (bullish) or lower (bearish) than it opened.
An illustrative image showing the anatomy of a candlestick.
🔵 Types of Candlestick Patterns
1. Reversal Patterns
Hammer and Hanging Man: These single-candle patterns signal potential reversals. A Hammer appears at the bottom of a downtrend, while a Hanging Man appears at the top of an uptrend.
Engulfing Patterns:
- Bullish Engulfing: A small bearish candle followed by a larger bullish candle engulfing the previous one.
- Bearish Engulfing: A small bullish candle followed by a larger bearish candle engulfing it.
Morning Star and Evening Star: These are three-candle reversal patterns that signal a shift in market direction.
Morning Star: Occurs at the bottom of a downtrend, indicating a potential bullish reversal. It consists of:
- A long bearish (red) candlestick showing strong selling pressure.
- A small-bodied candlestick (bullish or bearish) indicating indecision or a pause in selling. This candle often gaps down from the previous close.
- A long bullish (green) candlestick that closes well into the body of the first candle, confirming the reversal.
Evening Star: Appears at the top of an uptrend, signaling a potential bearish reversal. It consists of:
- A long bullish (green) candlestick showing strong buying pressure.
- A small-bodied candlestick (bullish or bearish) indicating indecision, often gapping up from the previous candle.
- A long bearish (red) candlestick that closes well into the body of the first candle, confirming the reversal.
2. Continuation Patterns
Doji Patterns: Candles with very small bodies, indicating market indecision. Variations include Long-Legged Doji, Dragonfly Doji, and Gravestone Doji.
Rising and Falling Three Methods: These are five-candle continuation patterns indicating the resumption of the prevailing trend after a brief consolidation.
Rising Three Methods: Occurs during an uptrend, signaling a continuation of bullish momentum. It consists of:
- A long bullish (green) candlestick showing strong buying pressure.
- Three (or more) small-bodied bearish (red) candlesticks that stay within the range of the first bullish candle, indicating a temporary pullback without breaking the overall uptrend.
- A final long bullish (green) candlestick that closes above the high of the first candle, confirming the continuation of the uptrend.
Falling Three Methods: Appears during a downtrend, indicating a continuation of bearish momentum. It consists of:
- A long bearish (red) candlestick showing strong selling pressure.
- Three (or more) small-bodied bullish (green) candlesticks contained within the range of the first bearish candle, reflecting a weak upward retracement.
- A final long bearish (red) candlestick that closes below the low of the first candle, confirming the continuation of the downtrend.
🔵 Coding Candlestick Pattern Detection in Pine Script
Detecting patterns programmatically can improve trading strategies. Below are Pine Script examples for detecting common patterns.
Hammer Detection Code
//@version=6
indicator("Hammer Pattern Detector", overlay=true)
body = abs(close - open)
upper_wick = high - math.max(close, open)
lower_wick = math.min(close, open) - low
is_hammer = lower_wick > 2 * body and upper_wick < body
plotshape(is_hammer, title="Hammer", style=shape.triangleup, location=location.belowbar, color=color.green, size=size.small)
Bullish Engulfing Detection Code
//@version=6
indicator("Bullish Engulfing Detector", overlay=true)
bullish_engulfing = close < open and close > open and close > open and open < close
plotshape(bullish_engulfing, title="Bullish Engulfing", style=shape.arrowup, location=location.belowbar, color=color.blue, size=size.small)
🔵 Practical Applications
Trend Reversal Identification: Use reversal patterns to anticipate changes in market direction.
Confirmation Signals: Combine candlestick patterns with indicators like RSI or Moving Averages for stronger signals.
Risk Management: Employ patterns to set stop-loss and take-profit levels.
🔵 Conclusion
Candlestick patterns are powerful tools that provide insights into market sentiment and potential price movements. By combining visual recognition with automated detection using Pine Script, traders can enhance their decision-making process. Practice spotting these patterns in real-time charts and backtest their effectiveness to build confidence in your trading strategy.

20.02.25 Morning ForecastPairs on Watch -
FX:AUDUSD
FX:GBPNZD
FX:GBPJPY
A short overview of the instruments I am looking at for today, multi-timeframe analysis down to what I will be looking at for an entry. Enjoy!

19.02.25 Morning ForecastPairs on Watch -
FX:AUDUSD
FX:GBPNZD
FX:NZDUSD
A short overview of the instruments I am looking at for today, multi-timeframe analysis down to what I will be looking at for an entry. Enjoy!

GBPCHF new bullish expectations
OANDA:GBPCHF trend based analysis, we are have CHANNEL pattern which is be breaked, price is make strong bullish push, at end now we are on new trend.
Price is in zone, its bounce few times, CHF showing self with many the weakest, on some other pairs can see bullish confirmations, here expect same soon confirm and new bullish push.
SUP zone: 1.12500
RES zone: 1.13500, 1.14000

Pattern Identification ExerciseHere I run through an exercise I first started carrying out around 4 years ago. It is a brilliant tool to help train yours eyes to spot patterns within the market, log the data across multiple different instruments and find specific characteristics with that instrument.
The importance behind carrying out an exercise like this is training your lens to spot these in the live markets, and also stacking your confidence so when you see these develop you are able to approach them in the best way possible.
Any questions just drop them below 👇

13.02.25 Morning ForecastPairs on Watch -
FX:GBPAUD (Live)
FX:EURCAD
FX:USDJPY
A short overview of the instruments I am looking at for today, multi-timeframe analysis down to what I will be looking at for an entry. Enjoy!

BECTORFOOD : Going long for about 0.625% of the net capitalTechnical Overview :
Took a position for about 0.625% of the net capital from a level closer to the lower trendline of the descending channel. Will be targeting the high of the descending channel for a potential move of about 43% from the current average entry price.
Fundamental Overview :
Mrs. Bectors Food Specialities Limited, a prominent player in India's fast-moving consumer goods (FMCG) sector, has exhibited notable financial performance in recent quarters.
For the fiscal year ending March 31, 2024, Mrs. Bectors reported a revenue from operations of ₹16,239.45 million, marking a 19.22% increase from ₹13,621.39 million in the previous year. The net profit for the year stood at ₹1,403.61 million, reflecting a 55.78% growth compared to ₹900.74 million in FY23.
The company's operating profit margin for FY24 was 15%, with a net profit of ₹145 crore, indicating robust operational efficiency.
Mrs. Bectors Food Specialities Limited has demonstrated strong financial growth, driven by strategic initiatives in product development and market expansion. The significant increases in both revenue and net profit across its key segments underscore the company's solid market position and effective operational strategies.
📢📢📢
If my perspective changes or if I gather additional fundamental data that influences my views, I will provide updates accordingly.
Thank you for following along with this journey, and I remain committed to sharing insights and updates as my trading strategy evolves. As always, please feel free to reach out with any questions or comments.
Other posts related to this particular position and scrip, if any, will be attached underneath. Do check those out too.
Disclaimer : The analysis shared here is for informational purposes only and should not be considered as financial advice. Trading in all markets carries inherent risks, and past performance is not indicative of future results. It’s essential to conduct your own research and assess your risk tolerance before making any investment decisions. The views expressed in this analysis are solely mine. It’s important to note that I am not a SEBI registered analyst, so the analysis provided does not constitute formal investment advice under SEBI regulations.

3MINDIA : Going long for about 0.625% of the net capitalTechnical Overview :
Took a position for about 0.625% of the net capital from the lower trendline of the parallel channel targeting the highs for a potential move of about 39%.
Fundamental Overview :
3M India Limited, a subsidiary of the U.S.-based 3M Company, has demonstrated a mixed financial performance over recent quarters, influenced by various market dynamics.
For the fiscal year ending March 31, 2024, 3M India reported a 29% increase in net profit, totaling ₹5.83 billion, compared to ₹4.51 billion in the previous year. Revenue rose by 5.8% to ₹41.89 billion from ₹39.59 billion. The profit margin improved to 14% from 11% in FY23, driven by higher revenue. Earnings per share also increased to ₹518 from ₹400 in the prior year.
Segment-wise Performance:
Healthcare: This segment has shown consistent growth, with a notable 19% increase in revenue during Q2 FY25.
Safety and Industrial: Experienced growth of approximately 8-9% in Q2 FY25 but faced a 1.4% decline in Q3 FY25.
Transportation and Electronics: While there was a 10% revenue increase in Q3 FY25, this segment saw a slight decline of 1.4% in Q2 FY25 and a 4% decrease in Q1 FY25.
Profitability and Margins:
The company's profitability has been impacted by rising raw material and freight costs, leading to margin contractions in certain quarters. For instance, in Q3 FY25, EBITDA margins contracted by 12% year-over-year due to increased expenses.
Strategic Actions:
To mitigate inflationary pressures, 3M India has implemented price increases across its product range. This strategy contributed to revenue growth in several segments, despite the challenges posed by higher input costs.
Conclusion:
3M India's financial performance reflects resilience amid economic challenges, with strategic pricing actions and segmental growth contributing to overall stability. However, rising costs have posed challenges to profitability, indicating the need for ongoing cost management and strategic initiatives to sustain growth.
📢📢📢
If my perspective changes or if I gather additional fundamental data that influences my views, I will provide updates accordingly.
Thank you for following along with this journey, and I remain committed to sharing insights and updates as my trading strategy evolves. As always, please feel free to reach out with any questions or comments.
Other posts related to this particular position and scrip, if any, will be attached underneath. Do check those out too.
Disclaimer : The analysis shared here is for informational purposes only and should not be considered as financial advice. Trading in all markets carries inherent risks, and past performance is not indicative of future results. It’s essential to conduct your own research and assess your risk tolerance before making any investment decisions. The views expressed in this analysis are solely mine. It’s important to note that I am not a SEBI registered analyst, so the analysis provided does not constitute formal investment advice under SEBI regulations.

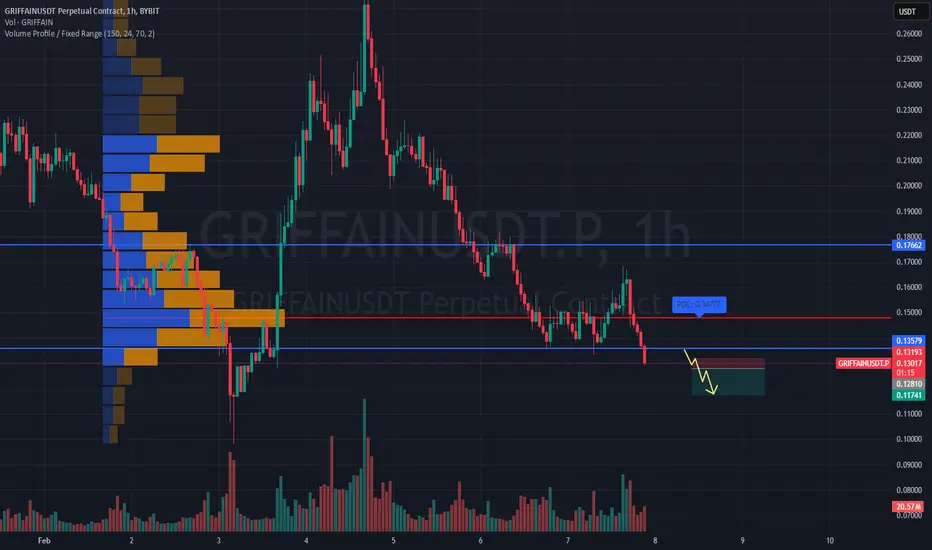
SHORT #GRIFFAINUSDT expecting further downside📉 SHORT BYBIT:GRIFFAINUSDT.P from $0.12810
🛡 Stop loss $0.13193
⏱ Timeframe: 1H
✅ Overview:
➡️ BYBIT:GRIFFAINUSDT.P is showing weakness after reaching a local high, rejecting from a resistance zone.
➡️ POC (Point of Control) at 0.13193 acts as a key volume area with significant trading activity.
➡️ Price action suggests seller dominance, indicating a potential continuation of the downtrend.
➡️ If the 0.12810 support level breaks, expect an increase in bearish momentum.
⚡ Plan:
➡️ Short entry upon confirmation of a breakdown below 0.12810.
➡️ Increased selling volume will confirm the continuation of the bearish trend.
➡️ Holding the position with dynamic monitoring until the first Take Profit level.
🎯 TP Targets:
💎 TP 1: 0.11741 – first target based on the nearest support level.
📢 BYBIT:GRIFFAINUSDT.P is showing bearish signs, but volume and pullback dynamics should be monitored.
📢 A break below 0.12810 could trigger a deeper decline.
📢 If buyers show strength, watch 0.13193 as a possible reversal point.
🚀 BYBIT:GRIFFAINUSDT.P maintains bearish momentum — expecting further downside!
CMCSA : Going long for about 0.625% of the net capitalTechnical Overview :
Took a position for about 0.625% of the net capital from the lower trendline of the parallel channel. The price did form a gap down and hence I waited for a consolidation pattern to be formed before being involved in the scrip.
Will be targeting the higher trendline of the parallel channel which is about 35% move from the average entry price.
Fundamental Overview :
In the fourth quarter ending December 31, 2024, Comcast reported a 2% increase in revenue, totaling $31.92 billion, and an adjusted earnings per share of $0.96. The Connectivity & Platforms segment saw a 5% revenue growth to $11.5 billion. However, the company experienced a loss of 139,000 broadband subscribers, exceeding the anticipated loss of 100,000.
Analysts have suggested that Comcast could unlock significant value by restructuring, potentially splitting into three separate public companies. This move is projected to increase Comcast’s stock value by 57%. The conglomerate structure has been cited as a factor leading to market discounts due to concerns over capital returns and leadership alignment.
📢📢📢
If my perspective changes or if I gather additional fundamental data that influences my views, I will provide updates accordingly.
Thank you for following along with this journey, and I remain committed to sharing insights and updates as my trading strategy evolves. As always, please feel free to reach out with any questions or comments.
Other posts related to this particular position and scrip, if any, will be attached underneath. Do check those out too.
Disclaimer: The analysis shared here is for informational purposes only and should not be considered as financial advice. Trading in all markets carries inherent risks, and past performance is not indicative of future results. It’s essential to conduct your own research and assess your risk tolerance before making any investment decisions. The views expressed in this analysis are solely mine. It’s important to note that I am not a SEBI registered analyst, so the analysis provided does not constitute formal investment advice under SEBI regulations.

MSFT : Going long for about 0.625% of the net capitalTechnical Overview
Took a position for about 0.625% of the net capital from the lower trendline of the parallel channel. As of now, the target considered is the high of the parallel channel, to where there is a potential move of about 10% from the entry level.
Will consider adding on to the position if the price falls to the, low of the ascending channel as marked in the charts.
Fundmental Overview
In the fiscal quarter ending January 29, 2025, Microsoft reported a 12% increase in revenue, totaling $69.6 billion, and a 10% rise in net income to $24.1 billion. The Intelligent Cloud segment, which includes Azure, saw a 19% revenue growth. However, Azure's growth rate decelerated to 31%, down from 34% in the previous quarter.
The company is significantly investing in artificial intelligence (AI), with plans to allocate $80 billion in capital expenditures for the fiscal year, primarily aimed at enhancing AI infrastructure.
📢📢📢
If my perspective changes or if I gather additional fundamental data that influences my views, I will provide updates accordingly.
Thank you for following along with this journey, and I remain committed to sharing insights and updates as my trading strategy evolves. As always, please feel free to reach out with any questions or comments.
Other posts related to this particular position and scrip, if any, will be attached underneath. Do check those out too.
Disclaimer: The analysis shared here is for informational purposes only and should not be considered as financial advice. Trading in all markets carries inherent risks, and past performance is not indicative of future results. It’s essential to conduct your own research and assess your risk tolerance before making any investment decisions. The views expressed in this analysis are solely mine. It’s important to note that I am not a SEBI registered analyst, so the analysis provided does not constitute formal investment advice under SEBI regulations.

07.02.25 Morning ForecastPairs on Watch -
FX:GBPNZD
A short overview of the instruments I am looking at for today, multi-timeframe analysis down to what I will be looking at for an entry. Enjoy!

05.02.25 Morning ForecastPairs on Watch -
FX:AUDUSD
FX:NZDCAD
A short overview of the instruments I am looking at for today, multi-timeframe analysis down to what I will be looking at for an entry. Enjoy!

BANKBEES : Going long for about 6.25% of the net capitalI have taken 2 positions at different levels, both close to the lower trendline of the ascending channel. The net allocation in the scrip currently amounts to 6.25% of my net capital. I do not plan to add to the position anytime soon. For now, my target is the all-time high, which would yield a profit of approximately 9% based on the average entry price.
📢📢📢
If my perspective changes or if I gather additional fundamental data that influences my views, I will provide updates accordingly.
Thank you for following along with this journey, and I remain committed to sharing insights and updates as my trading strategy evolves. As always, please feel free to reach out with any questions or comments.
Other posts related to this particular position and scrip, if any, will be attached underneath. Do check those out too.
Disclaimer: The analysis shared here is for informational purposes only and should not be considered as financial advice. Trading in all markets carries inherent risks, and past performance is not indicative of future results. It’s essential to conduct your own research and assess your risk tolerance before making any investment decisions. The views expressed in this analysis are solely mine. It’s important to note that I am not a SEBI registered analyst, so the analysis provided does not constitute formal investment advice under SEBI regulations.

GOLD 12H CHART ROUTE MAP ANALYSISHello Traders,
Here’s our 12H chart analysis and target updates:
📌 Previous Chart Review
Key Resistance: Identified 2,790 as a critical resistance level, anticipating a potential reversal.
Buy Signal: Recommended waiting for EMA5 to cross and hold above TP1 (2,745) as confirmation for a bullish move toward TP2 (2,786) & TP3 (2,826).
Dynamic Support: Highlighted the FVG zone (2,745) as a key support area.
📊 Outcome
✅ All targets and entry levels (marked with Golden Circles) were achieved as predicted.
✅ EMA5 crossed above TP1 (2,744), leading to TP2 (2,786) being achieved.
✅ Resistance at 2,790 was broken.
❌ TP3 was nearly reached but reversed after EMA5 failed to cross and hold above TP2 (2,786).
🔍 What’s Next for GOLD?
The daily candle closed above TP2 (2,786), but EMA5 failed to sustain above it.
This suggests a potential short-term reversal.
📉 Key Levels
📌 Support: Strong support expected from the FVG zone and Gold Turn Levels (2,770, 2,745 & 2705).
⚠️ Downside Risks
If EMA5 crosses and holds below 2,770, the next target shifts to 2,745.
If EMA5 crosses and holds below 2,745, the downside extends toward 2,705 (Retracement Range).
📈 Bullish Path
A bounce from support could retest TP2 (2,786) and potentially extend toward TP3 (2,826).
📌 Trading Recommendations
🔹 Short-Term Trades:
Utilize 1H and 4H timeframes to capitalize on dips at Gold Turn Levels, targeting 30–40 pips per trade.
Focus on shorter positions in this range-bound market to navigate volatility.
🔹 Long-Term Bias:
We remain bullish and view pullbacks as buying opportunities.
Buying dips from our marked levels provides better risk management rather than chasing tops.
📢 Final Note
Trade with confidence and discipline—our precise analysis ensures you’re well-equipped to navigate the market. Stay tuned for daily updates and multi-timeframe insights.
Best regards,
📉💰 The Quantum Trading Mastery

04.02.25 Morning ForecastPairs on Watch -
FX:NZDCAD
A short overview of the instruments I am looking at for today, multi-timeframe analysis down to what I will be looking at for an entry. Enjoy!

03.02.25 Morning ForecastPairs on Watch -
FX:GBPNZD
FX:NZDCAD
A short overview of the instruments I am looking at for today, multi-timeframe analysis down to what I will be looking at for an entry. Enjoy!

AARTIIND : Going long for about 1.875% of the net capitalI have taken 3 positions at various levels, bringing my total holding in the scrip to 1.875% of my net capital. I may consider adding to the position if the price falls to the low of the descending channel marked on the chart. However, both macro and microeconomic factors, as well as the momentum of the decline, will be carefully evaluated before making any additional entry. If that position is taken, the net allocation in the scrip will increase to approximately 2.5%, which will be the final position in this scrip.
For now, my targeted move is approximately 49% of the invested capital based on the current average price.
📢📢📢
If my perspective changes or if I gather additional fundamental data that influences my views, I will provide updates accordingly.
Thank you for following along with this journey, and I remain committed to sharing insights and updates as my trading strategy evolves. As always, please feel free to reach out with any questions or comments.
Other posts related to this particular position and scrip, if any, will be attached underneath. Do check those out too.
Disclaimer: The analysis shared here is for informational purposes only and should not be considered as financial advice. Trading in all markets carries inherent risks, and past performance is not indicative of future results. It’s essential to conduct your own research and assess your risk tolerance before making any investment decisions. The views expressed in this analysis are solely mine. It’s important to note that I am not a SEBI registered analyst, so the analysis provided does not constitute formal investment advice under SEBI regulations.

AUTOBEES : Going long for about 6.25% of the net capitalI have taken 5 positions at different levels, resulting in a net holding in the scrip that accounts for approximately 6.25% of my net capital.
I might consider adding to the position if the price falls to the entry levels marked on the chart, depending on the momentum of the decline.
For now, my target is the all-time high, which would yield a profit of about 16% on the invested capital based on the average entry price.
📢📢📢
If my perspective changes or if I gather additional fundamental data that influences my views, I will provide updates accordingly.
Thank you for following along with this journey, and I remain committed to sharing insights and updates as my trading strategy evolves. As always, please feel free to reach out with any questions or comments.
Other posts related to this particular position and scrip, if any, will be attached underneath. Do check those out too.
Disclaimer: The analysis shared here is for informational purposes only and should not be considered as financial advice. Trading in all markets carries inherent risks, and past performance is not indicative of future results. It’s essential to conduct your own research and assess your risk tolerance before making any investment decisions. The views expressed in this analysis are solely mine. It’s important to note that I am not a SEBI registered analyst, so the analysis provided does not constitute formal investment advice under SEBI regulations.

ASIANPAINT : Going Long for about 1.25% of the net capitalTook a position in the scrip, allocating about 1.25% of the net capital. I am expecting a potential upside of around 38% to the upper trendline of the channel that has formed.
I will consider adding to the position if the price falls approximately 23% from the current level and touches the longer timeframe trendline, which is a significant support level for the scrip.
📢📢📢
If my perspective changes or if I gather additional fundamental data that influences my views, I will provide updates accordingly.
Thank you for following along with this journey, and I remain committed to sharing insights and updates as my trading strategy evolves. As always, please feel free to reach out with any questions or comments.
Other posts related to this particular position and scrip, if any, will be attached underneath. Do check those out too.
Disclaimer: The analysis shared here is for informational purposes only and should not be considered as financial advice. Trading in all markets carries inherent risks, and past performance is not indicative of future results. It's essential to conduct your own research and assess your risk tolerance before making any investment decisions. The views expressed in this analysis are solely mine. It's important to note that I am not a SEBI registered analyst, so the analysis provided does not constitute formal investment advice under SEBI regulations.

BLUDEDART : Going Long for about 0.625% of the net capitalTook an entry for about 0.625% of the net capital from a level close to the low of the parallel channel.
Will be targeting the high of the parallel channel for profit of about 47% of the invested amount. Might even consider adding on to the position if price comes down to the low of the parallel channel, depending upon the momentum of the move.
📢📢📢
If my perspective changes or if I gather additional fundamental data that influences my views, I will provide updates accordingly.
Thank you for following along with this journey, and I remain committed to sharing insights and updates as my trading strategy evolves. As always, please feel free to reach out with any questions or comments.
Other posts related to this particular position and scrip, if any, will be attached underneath. Do check those out too.
Disclaimer: The analysis shared here is for informational purposes only and should not be considered as financial advice. Trading in all markets carries inherent risks, and past performance is not indicative of future results. It’s essential to conduct your own research and assess your risk tolerance before making any investment decisions. The views expressed in this analysis are solely mine. It’s important to note that I am not a SEBI registered analyst, so the analysis provided does not constitute formal investment advice under SEBI regulations.

31.01.25 Morning ForecastPairs on Watch -
FX:GBPAUD
TVC:USOIL
FX:AUDUSD
A short overview of the instruments I am looking at for today, multi-timeframe analysis down to what I will be looking at for an entry. Enjoy!
