PYPL - Oversold - PT: $160RSI indicator showing that PYPL is oversold on the 1H chart.
We see a bounce to $160 before making another small correction.
Long term price will recover to $220, this year.
Paypal

Paypal Correction coming to an end ? Paypal has taken a beat down this week but when we zoom out its no more than a healthy correction .
Price began to correct after putting in a double top back in the summer and from then on we identify a change in market structure .
We are way down at the .786 Fib and heading towards .886 for around 110 a share .
Always wait and see the reaction of a level and look at volume and reactions on a LTF will give you some clarification.
If .886 is the last stop then you want to see a change in market structure on LTF with a higher low /Higher high but i
would expect a reaction at this level .
Fib speed fan and FIB Expansion used in chart + fixed Range

XAUUSD 6H TA : 02.03.22 :Bear or What ?Well, exactly as i expected, the price was able to consolidate above $ 1800, and after that, exactly according to the previous analysis , it reached to $ 1808 , and from that PRZ it was rejected twice and now it felt more than 210 pips, now the price is starting the second impulse bearish wave , and if it closes below $ 1779, i expect it to fall to lower levels whivh is $ 1770, $ 1766 and even $ 1754 .
Follow our other analysis & Feel free to ask any questions you have, we are here to help.
⚠️ This Analysis will be updated ...
👤 Arman Shaban : @ArmanShabanTrading
📅 03.Feb.22
⚠️(DYOR)
❤️ If you apperciate my work , Please like and comment , It Keeps me motivated to do better ❤️

CPR monthly: every month we are getting crushed, but why today? December, January and February: 3 months in a row bitcoin is getting hitting the pivots from below and making a new lower low.
How long can this go without ANY decent relief rally.
Today's Paypal and Meta showed horrible after hour moves, over 20% down.
This should drag the NASDAQ down too.
And we know what this means: BTC will move bearish or sideways base case scenario for the day.
Let's keep an eye on that 35.2K and let's see if it holds as that would prove the needed strength to make ANY upside move in the next upcoming days.

Support trendline getting broken In the 15min chart we can see this ascending triangle.
The lower support is getting broken if we retest and fail to reenter the triangle we could go back down.
Targets:
- 36.5K based on volume profile, this area has big accumulation of volume to potentially hold
- 32K to 33K we could retest this level too, CPR monthly support is also around that level
Fakeout possible?
Yes, potentially we could fakeout and still claim above the triangle but that has les probability than the bearish targets
One of the main reasons that could be driving the price down now is the NASDAQ opening a red candle today (even though SPX is still green). PYPL is selling out -25% is one of them...

PAYPAL reached its Fair Value. Will it make the bleeding stop?PayPal has seen an extreme sell-off this week so far, the last series of the correction since late July. By doing so, the price has almost reached the bottom of its 'Fair Value Zone' which is practically the Higher Lows trend-line since the January 2016 market low.
Every prior touch on that line has been a long-term buy in the past, with PayPal starting a long-term rally to a higher Fibonacci extension every time. Do you think this Zone is enough to attract buyers again and stop the bleeding?
--------------------------------------------------------------------------------------------------------
** Please support this idea with your likes and comments, it is the best way to keep it relevant and support me. **
--------------------------------------------------------------------------------------------------------

Paypal buying opportunity for long term holdPaypal is back at support, it will grind the support level for 1-4 weeks, then we will see accumulation for 2022 hype season that will be on second half of the year.
CCC.io

Paypal full cycle
PYPL - Elliott Wave Analysis
From the first day of listing we see a 5 waves up, an impulsive wave up, with something very interesting: Wave 5 is almost a truncation or failure. Which it meant that the fallowing correction will be very dramatic.
That is exactly what it happened.
From the top of wave 5 $309 price we see a big drop the unfolding correction. So far we had wave A subdivided in 5 waves as in the graphic above, Wave B corrective subdivided in a-b-c-d-e traveling sideways.
I see Wave C unfolding in 5 waves down. With the bottom in the region of $68-$83 supported by the guideline of equality between waves A and C and the previous support held by the price.
Disclaimer: This is my analysis and does not constitute financial advice.
If you want more stock analysis like this please send me a message.

HUGE Long-Term BUYING opportunity on PayPal #PYPLWe've just opened a LONG #PYPL (PayPal Holdings) position using 2.50% of our equity as we believe that the current post-earnings sell-off is quite overdone at these levels.
The stock is down over 58% from its all-time highs of $310 that it reached mid-summer last year. Our view is that while there are definitely issues related to the future growth trajectory of the company that investors are rightfully worried about, the current price action is pricing in the worst possible scenario for the company moving forward, which in our opinion has a very low probability of actually materializing. Furthermore, the weak forward guidance and the severely lowered investor expectations will make it that much easier for the company to beat its own forecasts in the coming months, considering its leadership position in its sector, thus surprising the street positively. This will then cause a chain reaction of positive analyst upgrades and price target revisions. Yes, this whole process might take some time to materialize, but if you are looking for a solid growth stock with a remarkable long-term potential to double your money, then #PYPL is a screaming buy anywhere around the $125-130 range.
There is no question about the fact that the miss on the bottom line (EPS) in the most recent earnings report together with the poor forward guidance that the management gave on the earnings call after have been the major drivers for the vicious sell-off that we are seeing today.
For 2022, management expects net revenue to increase about 15% to 17% (19% to 21% ex-eBay), and that’s below the roughly 18% analysts were forecasting. The earnings outlook wasn’t any better, with management forecasting adjusted earnings of $4.60 to $4.75, well below analyst estimates of $5.21.
On the new users front, PayPal expects to add about 15 million to 20 million net new active accounts this year, and analysts were forecasting growth of about 55 million. This was definitely one of the most disappointing components of the report.
However, we believe that the down-beat forward guidance given by the company is hugely blown out of proportions and it seems that investors have been very quick to forget that #PYPL is the leader in the digital payments space and could technically be considered as the largest digital bank in the world with over 300 million clients. Our analysis shows that the eBay transition that the company has been going through has definitely weighted on its financial performance. However, we are in the final stages of it and it will be over and done with by the second half of the year.
What investors need to focus on is the fact that the company’s growth rates excluding eBay have remained above 20%. In addition to that the #AMZN (Amazon) partnership with Venmo hasn’t even started yet, and PayPal is free to explore many new partnerships now that it is no longer constrained by its relationship with #EBAY (eBay) . Also, operating expenditure growth is also expected to moderate down the road, allowing management to flex the leverage in the business model and help expand margins.
Apart from adding the stock to our long-term corporate investment portfolio here, we've also opened few long-term CALL options on $PYPL, which we expect to substantially boost our portfolio returns in 2022.
Follow and copy us for more detailed market analyses, profitable trading ideas and a consistent portfolio performance.
Sincerely,
@DowExperts

Gap Fill opportunity Hello Friends!
Took a position at $129.89 and looking to fill that $140 to $151 gap fill. That sharp selloff might find traders to fill that gap.
As always thanks for your follows, likes, and comments. Let’s learn and grow together. Cheers!

PYPL PayPal: 1D Chart ReviewHello friends, today you can review the technical analysis idea on a 1D linear scale chart for PayPal Holdings, Inc. (PYPL).
The chart is self-explanatory. Price dropped significantly and has the possibility for a retracement back up with the RSI in the oversold region. If price drops further, there is a strong support region below. Keep an eye on the 0.618 Fibonacci Retracement area if price moves back up.
Included in the chart: Trend line, Support and Resistance Lines, RSI, MFI, Double Top Pattern, Descending Broadening Wedge, Fibonacci Retracement, Death Cross, Simple Moving Average, Volume.
If you enjoy my ideas, feel free to like it and drop in a comment. I love reading your comments below.
I have additional charts below on cryptocurrencies, stocks and more to review. Check them out!
Disclosure: This is just my opinion and not any type of financial advice. I enjoy charting and discussing technical analysis . Don't trade based on my advice. Do your own research! #cryptopickk

Interpreting the PYPL fallPYPL has fallen ~25%, this provides a great dip buy opportunity. It is barely a dip but a pullback to a major trendline.
The falls can be attributed to each moving average, the first the 50MA (in green), the second the 100MA (in orange), and the third and current, the 200MA (in red)
Great buy

PayPal (NASDAQ: $PYPL) Just Closed Gap @ 0.786 Fib! 💯PayPal Holdings, Inc. operates as a technology platform and digital payments company that enables digital and mobile payments on behalf of consumers and merchants worldwide. Its payment solutions include PayPal, PayPal Credit, Braintree, Venmo, Xoom, Hyperwallet, and iZettle products. The company's payments platform allows consumers to send and receive payments, withdraw funds to their bank accounts, and hold balances in their PayPal accounts in various currencies. It also offers gateway services that enable merchants to accept payments online with credit or debit cards, as well as digital wallets. PayPal Holdings, Inc. was founded in 1998 and is headquartered in San Jose, California.

Patience is KeyIt might go further down to support from almost exactly one year ago. It goes down first as the EPS missed expectations by $0.01 and the earnings outlook for the coming period worse than expected by analysts. A rebound is probable to happen since a selloff like this is often matched with a rebound and PayPal is also just trying to lower their P/E ratio as some other companies are doing.

bought the dipI am pretty sure that the drop is because of some short-sellers being smart and short the crap out of the stock minutes before the earnings announcement.
let's see how it plays out :) 0 or 1 :)

Possible support areas for PYPLIf 146 doesn't hold, support at 136, 121, 110. Can short under these levels and also look to scalp a potential bounce.

PYPL ARK Invest sold PYPL ahead of EarningsYesterday Ark Invest sold more than 23K shares of PYPL just before the upcoming earnings this week.
Most likely today will do the same, since they tend to continue a buy or a sell trend.
The options are slightly bearish too, with more puts than buys recently.
PayPal (PYPL) is expected to earn $1.12 a share on sales of $6.89 billion.
With the rise of so many payment companies with low fees, and also banks who want to keep up with the new fintech, i wonder how PayPal can still have such a high PE Ratio (TTM) of 41.34!
My day to day experience with PayPal as a merchant makes me consider it an extremely expensive way of payment compared to others.
Considering the chart, fundamentals and current market conditions, my price target is $124.
Looking forward to read your opinion about it.

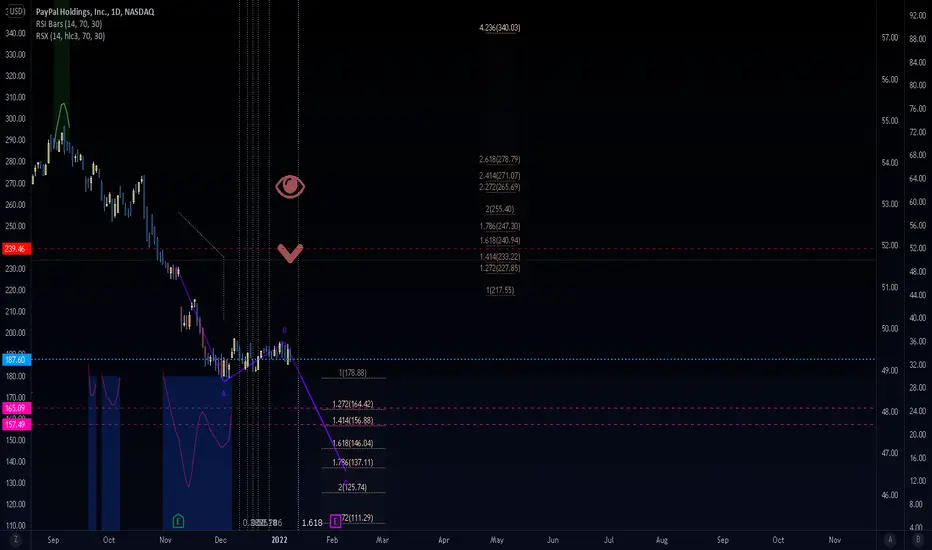
Paypal about to break the floor. PYPLShort term outlook.
Bearish outlook for gains at 165, then 157. Invalidation at 239.
We are not in the business of getting every prediction right, no one ever does and that is not the aim of the game. The Fibonacci targets are highlighted in purple with invalidation in red. Fibonacci goals, it is prudent to suggest, are nothing more than mere fractally evident and therefore statistically likely levels that the market will go to. Having said that, the market will always do what it wants and always has a mind of its own. Therefore, none of this is financial advice, so do your own research and rely only on your own analysis. Trading is a true one man sport. Good luck out there and stay safe!
PYPL TO THE DOWN SIDE PYPL (PAYPAL HOLDINGS INC) can go around $149 - 140 to finish the correction. Most likely we will go down for finish correction and you can check the RSI indicator for better confirmation.
DISCLOSURE - Please be informed that the information I provide is not a trading recommendation or investment advice. All of my work is for educational purposes only. All labeling and wave count have been done by me manually and I will keep changing according to the LIVE MARKET PRICE ACTION. So don't bias, hope on my trade plans. Try to learn Elliott Wave or other strategies and make your own strategy. Following is not that much easy. I am not responsible for any losses if u took the trade according to my trade plans.
#PYPL #PAYPAL

$PYPL waiting for a bounce off of supportWhat was once resistance is now support after the massive selloff
Weekly chart is looking mega oversold

PayPal's bad days are about to end!In this article, I will try to shine the light on the mathematical aspects of technical trading!
The mathematics behind the harmonic patterns!
What is a dynamical system?
A dynamical system is all about the evolution of something over time. To create a dynamical system we simply need to decide (1) what is the “something” that will evolve over time and (2) what is the rule that specifies how that something evolves with time. In this way, a dynamical system is simply a model describing the temporal evolution of a system.
The state-space
The first step in creating a dynamical system is to pin down what is the special “something” that we want to evolve with time. To do this, we need to come up with a set of variables that give a complete description of the system at any particular time.
By “complete description,” we don't necessarily mean that the variables will completely describe a real-life system we may be trying to model. But, the variables must completely describe the state of the mathematical system. In a dynamical system, if we know the values of these variables at a particular time, we know everything about the state of the system at that time. To model some real-life system, the modeler must clearly make a choice of what variables will form the complete description for the mathematical model.
The variables that completely describe the state of the dynamical system are called the state variables. The set of all the possible values of the state variables is the state space.
The state-space can be discrete, consisting of isolated points, such as if the state variables could only take on integer values. It could be continuous, consisting of a smooth set of points, such as if the state variables could take on any real value. In the case where the state space is continuous and finite-dimensional, it is often called the phase space, and the number of state variables is the dimension of the dynamical system. The state space can also be infinite-dimensional.
Geometry and Fibonacci Numbers
Harmonic trading combines patterns and math into a trading method that is precise and based on the premise that patterns repeat themselves. At the root of the methodology is the primary ratio, or some derivative of it (0.618 or 1.618). Complementing ratios include: 0.382, 0.50, 1.41, 2.0, 2.24, 2.618, 3.14 and 3.618. The primary ratio is found in almost all-natural and environmental structures and events; it is also found in man-made structures. Since the pattern repeats throughout nature and within society, the ratio is also seen in the financial markets, which are affected by the environments and societies in which they trade.
By finding patterns of varying lengths and magnitudes, the trader can then apply Fibonacci ratios to the patterns and try to predict future movements. The trading method is largely attributed to Scott Carney, although others have contributed or found patterns and levels that enhance performance.
The Bat
The bat pattern is similar to Gartley in appearance, but not in measurement.
There is a rise via XA. B retraces 0.382 to 0.5 of XA. BC retraces 0.382 to 0.886 of AB. CD is a 1.618 to 2.618 extension of AB. D is at a 0.886 retracement of XA.
Conclusion:
No matter which approach you use, try to pick the one that works for you!
Reference:
mathinsight.org
www.investopedia.com
You can see the most important support(green line) and resistance (red line) levels.
Best,
Moshkelgosha
DISCLAIMER
I’m not a certified financial planner/advisor, a certified financial analyst, an economist, a CPA, an accountant, or a lawyer. I’m not a finance professional through formal education. The contents on this site are for informational purposes only and do not constitute financial, accounting, or legal advice. I can’t promise that the information shared on my posts is appropriate for you or anyone else. By using this site, you agree to hold me harmless from any ramifications, financial or otherwise, that occur to you as a result of acting on information found on this site.

PayPal - Ready for new All-Time-Highs?Hey Investor,
please see my longterm idea on PayPal, where my counts suggests a possible bottom printed which will now lead to the next bullish cycle. What is important here is that we close above the 1.618 Fibonacci extension level in order for this analysis to be invalid. A break o the 1.618 level would lead to a bearish wave 3 which would change dramatically my count.
This is no financial advice, just my technical expertise.
RT

SQUARE SQ I am net long in the 134 area in calls and PYPL SQ is now at .618 of the bull market it has a nice ABC decline and wave A x 1.618 = wave wave C AT TODAY LOW MOVE TO A 75 % NET LONG SQ and PYPL at the market look for a rather strong out of nowhere rally back to.382 min best of trades WAVETIMER
