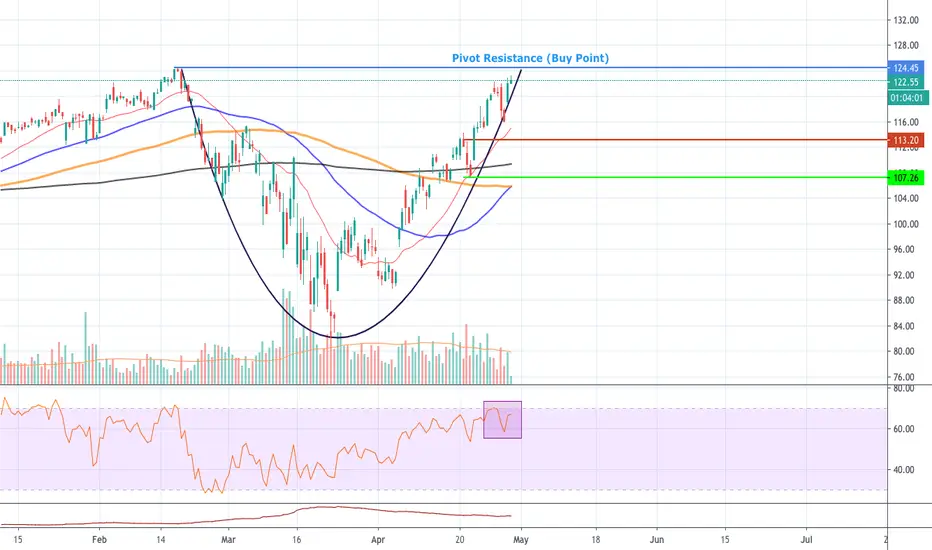
PayPal Holdings is forming "CUP" $PYPLPYPL is forming a deep cup and buy point is holding above $124.45. However, there is a negative divergence may pull back after hit pivot resistance till $113 or $110. Additionally EPS results also will affect the direction.
Paypal
PayPal short term buyPaypal has broken above a small channel that has formed
I expect a test of the 1.618 fib level before a breakdown occurs of this rising broadening wedge
price structure shows similarities to the first release of PayPal

Paypal : Buying positionIt could reach $124.31.
Long position.
Like and Subscribe for more analytics.

Local support and resistance for PaypalLocal support and resistance for Paypal to derive a good entry point into the market.

Adding more Paypal, if we can break that resistance line. $PYPLTechnical indicators are still showing bulls are still in control.
I am holding this stock in my portfolio and will add more if we can break and close above the yellow line with volume.

PYPL Linear RegressionPYPL has recently had a nice dip, with the formation of this bowl, upsides are to come as per the regression trend. 0.86 strong regression uptrend. Great long entry. If you aren’t a fan of cryptocurrency ;) Rising wedge also present early.

PAYPAL - Next stop $111.75PYPL finally broke its key level resistance. We have a retest and now formed support. Looking to exit near $111.75s

Paypal - sitting at supportBullish technicals
PYPL has struggled to stay above the 200sma, which is still in an uptrend.
Today closing above the 200sma would we the third consecutive day doing so...
Risk reward ratio is 3:1
Bearish technicals
OBV has been trending lower, diverging from what the RSI is telling us.
We have a few layers of overhead resistance.
-----
Keeping on a close watchlist until technicals indicate otherwise.

Long Paypal? $PYPLBreaking out next week?
MACD and RSI are bullish.
Stock is just above two moving averages (20,50) they will be acting as support.

$PYPL ~ PAYPAL ~ LONG SETUP USING CALLS ~ #OptionsTradingMETHOD: Long PAYPAL {price at entry 104.93} via:
+2 PYPL 20 DEC 19 102 CALL @3.40 ; Trading with 0.50 of extrinsic value, with decay only threatening if losing the trade.
STRATEGIES: Using DIS day chart:
The 20/50 Mean green cloud contracts, and we can look for a new expanding cloud to form for a long from the mean.
The Fisher Transform bounce signal appearing near the mean.
TACTICS: The plan in terms of stock price:
STOP is price < 102
TGT 108 to exit
Trail option price to Break Even once stock price > 106; OR consider scaling as green cloud becomes large
We may let the Fisher Transform and 20/50 mean together take us out technically for whatever we get win or lose.
Will update in comments,
B3
d^.^b

PAYPAL - DAILY CHARTHi, today we are going to talk about the ishares stoxx europe 600 automobiles & parts ucits ETF and its current landscape.
A subsidiary of Paypal named Xoom rolled out today the possibility for its customers to send money to recipients in the U.S for the first time. Due to strategic alliances with Walmart and Ria, now Xoom customers can send cash for nearly 5,000 locations across the U.S for more affordable rates than the existing methods, and an innovation that can benefit up to 44 million foreign-born people in the U.S. This new service can positively impact the Paypal through Xoom due to the significant increase of potential customers, a great breakthrough for the U.S citizens, considering that is a country where 22% of the adults are unbanked or underbanked, according to Fed data from 2018.
Thank you for reading and leave your comments if you like.
To have access to our exclusive contents, join the Traders Heaven today! Link Below.
Disclaimer: All content of Golden Dragon has only educational and informational purposes, and never should be used or take it as financial advice.


Trading the Elliott Wave Principle - Part 2 (3)This chart is part of our educational article "Trading the Elliott Wave Principle - Part 2."

LONG PYPLExpecting bounce from extremely oversold weekly and daily levels. If stop breached, be prepared to catch new daily reversal on lower levels with a tight stop.

Paypal short-term Bull FlagThere are mixed signals, with OBV not following the same uptrend as the RSI.
If we break this resistance with above average volume, that would be a great signal.


Put PayPal on WatchPattern still unclear and giving mixed signals. Could be ascending triangle reversal, but is more than likely a bear flag. Watching for signs of confirmation.

LONG PYPLExpecting bounce from extremely oversold weekly and daily levels. If stop breached, be prepared to catch new daily reversal on lower levels with a tight stop.
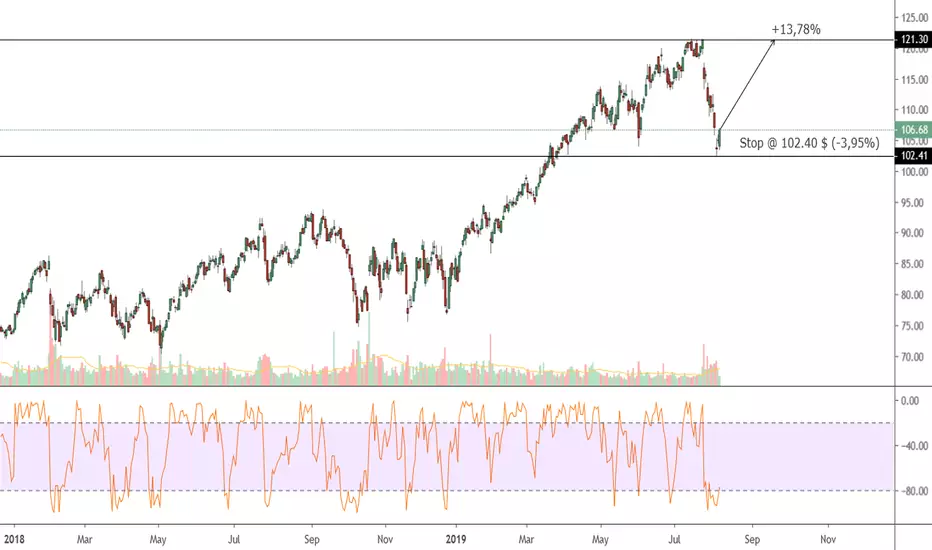
$PYPL - Measured MoveTarget of 128 if the support line remains unbroken - well see how ER affects this.

PYPL Forms Risk of Top FormationPayPal broke to the downside, then bounced up on a strong upside market day. However, the gain of the bounce is weaker in volume and price pattern than the previous downside black candlestick. It has weak support to the downside all the way to the red line.

RSR Long - Potential 98% profitIEO are HOT. RSR is one of them. FA is solid, the team is strong and it is backed by Coinbase. Co-founder of Paypal Peter Thiel is investing in RSR and some other big names as well. Potential could be huge. But for now the team should show case the real benefits of RSR and RSV.
For now RSR needs again some momentum. Perhaps we can see soon some price action to the upside. Currently it is in a consolidating phase.
The chart is self explanatory. SL, entry price and target are all visible in the chart.
Remember to always lock profit, and always use stop loss.
Give me a like and a follow if you want to receive more trading ideas.

PYPL - What to expect on 4hr - PAYPALChart says it. We just made a new high which for me means look for signs of trend reversal. As I've said before trend reversal starts when you start closing below levels that brought you to your most recent high. Im looking to get short, if that wasn't made clear. Not financial advice. Trade safe.

PAYPAL SHORT TERM. AT WAVE 5 OF 5 OF WAVE 3. LOAD UP ON SHORTSOPTIONS PLAY: LONG PUTS or sell calls.
Entry: $108.97-$110.00
Target: $90.
Keep an eye on the sub wave 1-2 extension at $110 at 3.0. A blow past the green zone will have to reconsider the count. Puts 2 months out, cant go tits up.
This is a close-up of the larger wave 3, see my long term chart for this.
The EW count suggests we are at the top here and about to hit the big ABC down to $90 where the 200 DMA and 618 of the fib retracement sits. Fib extensions shown to predict the end of wave 5, and has accurately predicted several of the wave counts before. All EW rules are obeyed and the standard impulse applies. The biggest question is the time factor. I imagine the B wave will be drawn out and a possible flat due to the volume profile and resistance we built on $100-$105. I will be looking to trade the $110-->~$100 swing, exiting and re-entering. for the big C. No stops identified, trade at your own risk.
