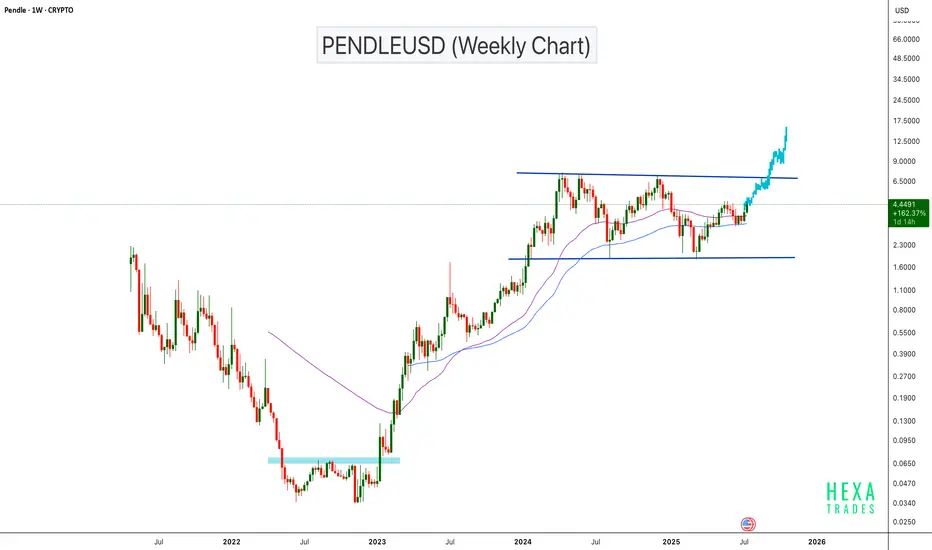
PENDLEUSD Bullish Continuation Setup!BINANCE:PENDLEUSDT has surged approximately 20,000% from its bottom, showing exceptional long-term strength. The price is now approaching a major horizontal resistance zone on the weekly chart. If the price breaks the parallel channel resistance, we can expect a bullish continuation with a psychological target of $15.
Cheers
Hexa
CRYPTOCAP:PENDLE CRYPTO:PENDLEUSD
PENDLEUSD
PENDLEUSDT 📈 PENDLEUSDT 4H Analysis:
Price rebounded from the 2.444 demand zone after a short-term breakdown and is now stabilizing above the 200 EMA, with the bullish trendline still intact. Key resistance lies at 3.219, and breaking it could open the path to 3.602. However, a drop below 2.626 and the trendline may trigger a deeper correction.

PENDLEUSDT 2D AnalysisPENDLE ~ 2D Analysis
#PENDLE Buy when re -testing this support block or buy after successfully penetrating this resistant line with a short -term target of at least 10%+.
#PENDLE/USDT#PENDLE
The price is moving within a descending channel on the 1-hour frame and is expected to continue upward.
We have a trend to stabilize above the 100 moving average once again.
We have a downtrend on the RSI indicator, which supports the upward move with a breakout.
We have a support area at the lower boundary of the channel at 2.63.
Entry price: 2.85
First target: 3.07
Second target: 3.20
Third target: 3.40

PENDLEUSDT 1DPENDLE ~ 1D Analysis
#PENDLE Buy gradually after successfully penetrating this resistant line with a short -term target of at least 10%+.

Trading opportunity for PENDLEUSDTBased on technical factors there is a Buy position in :
📊 PENDLEUSDT
🔵 Buy Now
🪫Stop loss 1.800
🔋Target 2.550
📏 R/R 2
💸RISK : 1%
We hope it is profitable for you ❤️
Please support our activity with your likes👍 and comments📝

The bulls have left the building—time for the bears to party.PENDLE currently at strong support zone on weekly timeframe.
Break of this support could trigger a massive fall downwards. Chart is self explanatory.
Note: This is not Buy/Sell Recommendation. DYOR always & always.

The key is whether it can be supported and rise near 3.624
Hello, traders.
If you "Follow", you can always get new information quickly.
Please click "Boost" as well.
Have a nice day today.
-------------------------------------
(PENDLEUSDT 1D chart)
It has risen near the HA-Low indicator point of 3.624.
Accordingly, the key is whether it can be supported and rise near 3.624.
If the price maintains above the Trend Cloud indicator, it is highly likely to turn into an uptrend.
If the uptrend continues,
1st: 4.109
2nd: 4.907
3rd: 6.376-6.744
You can respond depending on whether there is support near the 1st-3rd above.
In particular, if the M-Signal indicator of the 1W chart passing near 4.109 rises above and the price is maintained, I think there is a possibility that a full-fledged uptrend will begin.
-
If it falls from the 3.624 point, whether there is support near 3.113 is important.
If it falls below the Fibonacci ratio 0 (2.488), it is better to wait until it rises because you cannot tell when it will rise.
----------------------------------------
If you refer to too many indicators, there is a possibility that the transaction will proceed in the wrong direction.
Therefore, it is important to limit the indicators you want to refer to and try to trade according to the trend.
-
The indicators that indicate the trend in this chart are the Trend Cloud indicator and the M-Signal indicator of the 1D, 1W, and 1M charts.
Therefore, you can check whether the trend is rising or falling by checking the status and arrangement of the Trend Cloud indicator.
In addition, you can check the overall trend by checking whether the M-Signal indicator of the 1D, 1W, and 1M charts is in the correct arrangement or reverse arrangement.
-
The HA-Low and BW(0) indicators indicate the low point range.
Therefore, if supported by these indicators, there is a high possibility of rising.
However, if it fails to rise and falls below the HA-Low and BW(0) indicators, there is a possibility of starting a stepwise downtrend, so be careful.
-
The HA-High, BW(0), and BW(100) indicators indicate the high point range.
Therefore, if resisted by these indicators, there is a high possibility of falling.
However, if it fails to fall and rises above the HA-High and BW(100) indicators, there is a possibility that a stepwise upward trend will begin.
-
The indicators listed above are the core indicators among the indicators on this chart.
The indicators other than these are secondary indicators used when conducting split transactions.
-
Thank you for reading to the end.
I hope you have a successful transaction.
--------------------------------------------------
- Big picture
I used TradingView's INDEX chart to check the entire range of BTC.
(BTCUSD 12M chart)
Looking at the big picture, it seems to have been maintaining an upward trend following a pattern since 2015.
In other words, it is a pattern that maintains a 3-year upward trend and faces a 1-year downward trend.
Accordingly, the upward trend is expected to continue until 2025.
-
(LOG chart)
Looking at the LOG chart, you can see that the upward trend is decreasing.
Accordingly, the 46K-48K range is expected to be a very important support and resistance range from a long-term perspective.
Therefore, we expect that we will not see prices below 44K-48K in the future.
-
The Fibonacci ratio on the left is the Fibonacci ratio of the uptrend that started in 2015.
In other words, it is the Fibonacci ratio of the first wave of the uptrend.
The Fibonacci ratio on the right is the Fibonacci ratio of the uptrend that started in 2019.
Therefore, it is expected that this Fibonacci ratio will be used until 2026.
-
No matter what anyone says, the chart has already been created and is already moving.
How to view and respond to this is up to you.
When the ATH is updated, there are no support and resistance points, so the Fibonacci ratio can be used appropriately.
However, although the Fibonacci ratio is useful for chart analysis, it is ambiguous when used as support and resistance.
This is because the user must directly select the important selection points required to create Fibonacci.
Therefore, since it is expressed differently depending on how the user specifies the selection points, it can be useful for chart analysis, but it can be seen as ambiguous when used for trading strategies.
1st : 44234.54
2nd : 61383.23
3rd : 89126.41
101875.70-106275.10 (Overshooting)
4th : 134018.28
151166.97-157451.83 (Overshooting)
5th : 178910.15
-----------------

PENDLEUSDT 3DPENDLE ~ 3D
#PENDLE So far it still continues to maintain this support block. If you still have Conviction on this coin,. Buy from here with a minimum target of 20%++

PENDLE target $8.64h time frame
-
Entry: $3.9
TP: $8.6
SL: $3.05
RR: 5.41
-
(1) PENDLE is building a descending wedge which is a standard correction from previous pump
(2) Currently stand on a comparable low point
(3) Fibonacci provides first target at $8.6 and final target at $12.5
(4) Stop loss once going below $3.05

PENDLEUSDT 5DPENDLE Update ~ 5D
#PENDLE In the 5D Time Frame it forms a rounding bottom pattern. If you still have Conviction on this coin, Buy gradually after breaking through this resistance block. New highs are only a matter of time.

PENDLEUSDT Long Setup Setting / Spot TradeBINANCE:RDNTUSDT
📈Which side you pick?
Bull or Bear
Low-risk status: 3x-4x Leverage
Mid-risk status: 5x-8x Leverage
(For beginners, I suggest low risk status)
👾Note: The setup is active but expect the uncertain phase as well. also movement lines drawn to predict future price reactions are relative and approximate.
➡️Entry Area:
Yellow zone
⚡️TP:
7.41
8.08
8.70
9.42
🔴SL:
5.579
🧐The Alternate scenario:
If the price stabilizes against the direction of the position, below or above the trigger zone, the setup will be canceled.

PENDLEUSDT Bearish Wedge PatternPENDLEUSDT Technical analysis update
PENDLE has formed a Raising wedge pattern on the daily chart, and the price has recently broken below the wedge's support line in day chart. This breakdown suggests potential bearish momentum in the coming days, with a possible decline toward lower support levels.

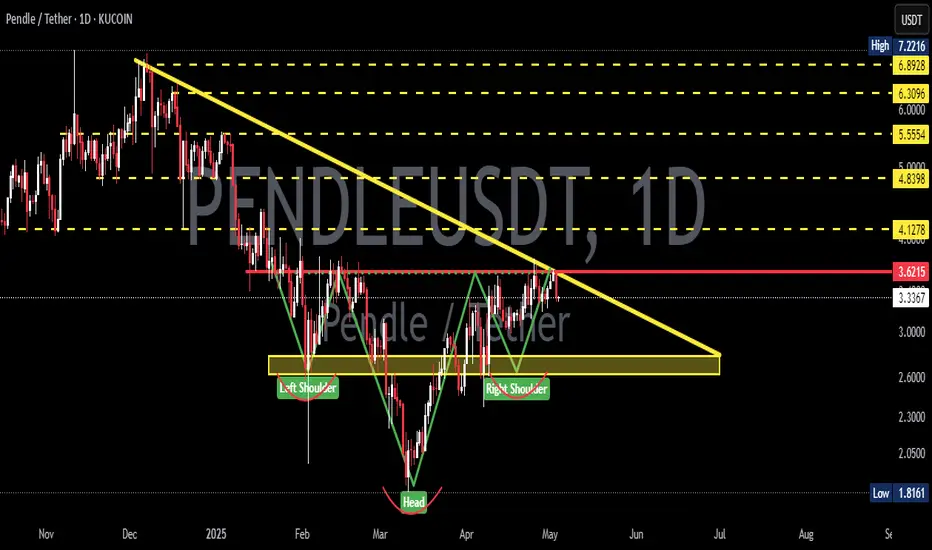
PENLDEUSDT Bullish Head and Shoulders Pattern.PENDLEUSDT Technical analysis update
PENDLE's price is breaking the inverse head and shoulders neckline on the daily chart, with the 100 and 200 EMAs acting as support for the right shoulder. We can expect a potential bullish move in PENDLE
Buy zone : Below $5.00
Stop loss : $4.40
Take Profit 1: $5.48
Take Profit 2: $6.15
Take Profit 3: $8.00
Regards
Hexa

PENDLEUSDT Is a Major Breakout on the Horizon??Yello, Paradisers! Are you watching #PENDLEUSDT closely? A potential breakout could be just around the corner, but is the bullish momentum strong enough to hold? Let's break it down.
💎#PENDLE Currently eyeing an Inverted Head and Shoulders (IHNS) pattern a classic bullish reversal signal. But remember, it's not confirmed until we see a daily candle close above the key resistance. Only then can we anticipate a significant upward movement, with the price potentially testing our target areas.
💎However, if PENDLE gets rejected at this crucial resistance, the odds favor a retracement back to the demand zone around 4.07. This zone could act as a launchpad for another breakout attempt, keeping the bullish scenario alive.
💎On the flip side, things could get tricky if PENDLE fails to hold that demand zone. A breakdown here opens up the possibility of a drop toward the support at 3.575, an area that has been respected several times in the past. With the right shoulder of the IHNS also sitting in this zone, it's possible we could see a rebound, but for the bulls to stay in control, PENDLE needs to reclaim the 4.07 level and push back toward resistance.
💎If the support at 3.575 fails and a daily candle closes below it, this could confirm a lower low, potentially leading to even more downside action. In this case, the bullish setup would be invalidated, and we could see PENDLE dipping further.
If you want to be consistently profitable, you need to be extremely patient and always wait for the best, highest-probability trading opportunities. Stay focused, patient, and disciplined, Paradisers!
MyCryptoParadise
iFeel the success🌴

PENDLE Daily - Bullish CHART PATTERN PENDLE has formed a W-Bottom Chart Pattern in the Daily timeframe, which could signal more upside is coming.
We're also observing very distinctive higher lows and higher highs; a key sign of a bullish market.
The W-Bottom pattern hasn't quite finished playing out, what we now need to see is a successful retest of support at the "neckline" which is currently at $4. What this means in simpler terms, is that the price cannot CLOSE below this, otherwise the pattern is invalidated.
We're also observing a BUY signal in the weekly timeframe; a strong indication that bulls are in control for the near future:
If the pattern holds, the price is likely heading towards the previous local high of $4.7
_______________________________
BINANCE:PENDLEUSDT

PENDLE target 74h time frame
-
Entry: $3.7
TP: $7
SL: $3.03
RR: 4.93
-
(1) Completed first wave; Doing second wave; Ready for third wave (Refer to following link)
(2) Big bottom head and shoulders pattern is creating
(3) Got support twice at fib projection 0.618, but be careful the possibility to reach 0.5
(4) Target for fib projection is $7
(5) Stop loss once going below $3.03
-
Previous Analysis-PENDLE reached target

PENDLEUSDTPENDLE ~ 3D ✅
#PENDLE On the 3D Time Frame a Bullish Pennant Pattern is formed.
✅ Make purchases gradually in this pattern. with a minimum target of 20%+

PENDLE target 4.66(short-term)4h time frame
-
Entry: $2.7
TP: $4.66
SL: $2.15
RR: 3.56
-
(1) Potential bullish flag on 4h
(2) Got support around Fib 0.382, high possibility reach 1.618 if stop falling here
(3) Fib 1.618 is also overlapped with structural resistance at $4.66
(4) Stop loss once going below $2.1

PENDLE target 8.9712h time frame
-
TP: $8.97
SL: $4.49
RR: 8.76
-
(1) Convergence pattern is be building. *two potential support lines
(2) 0.382 fibonacci projection at $3.8
(3) Target matches fibonacci projection_0.382 & fibonacci extension_2.618
(4) Stop loss while triangle bottom got breaking down

Pendle is looking to launch to $28Undoubtedly one of the winners of the cycle.
Already done hundred's of X's
YET
consolidating near it's high's in a #HVF continuation pattern @TheCryptoSniper
With the larger projection over a 4X from here.

PENDLEUSD 3DPENDLE ~ 3D
#PENDLE Buy after successfully breaking the Resistance Line on this pattern or buy on retest of $3.85 support. Minimum target 20%+

Bullish Continuation LikelyThe current price of PENDLEis 6.640, trading within an ascending channel as shown in the 1-hour timeframe. The market dynamics are defined by the interaction with the channel’s lower boundary and the RSI trends.
Technical Indicators and Analysis
The ascending channel defines the current support and resistance levels, with the lower band acting as a dynamic support and the upper band as resistance around 7.25. Recently, the price has tested the lower boundary of the channel, which aligns with support around the 6.6-6.65 level. The RSI is testing its moving average (MA) and is near the midline (50 level). A rejection at the MA could signal a bullish push back up. If the price breaks below the channel, the key support around 5.8 could provide a safety net.
Market Sentiment and Probable Scenario
As long as the price remains within the ascending channel, the market sentiment is cautiously bullish. The price dynamics suggest that:
Bullish Scenario: If the price maintains above the lower band of the channel and the RSI bounces off its MA, we could see the price pushing back up towards the upper resistance level of the channel.
Bearish Scenario: If the price breaks below the channel’s lower band, the next key support around 5.8 becomes critical. This support is robust enough to potentially halt a deeper decline.
Outlook
- Most Probable Scenario: Given the current position within the ascending channel and the RSI’s interaction with its MA, a slight bullish continuation towards the upper channel band is likely, provided the price sustains above the dynamic support.
- Key Levels to Watch:
Support: 6.6-6.65 (immediate), 5.8 (key)
Resistance: 7.25 (immediate)
