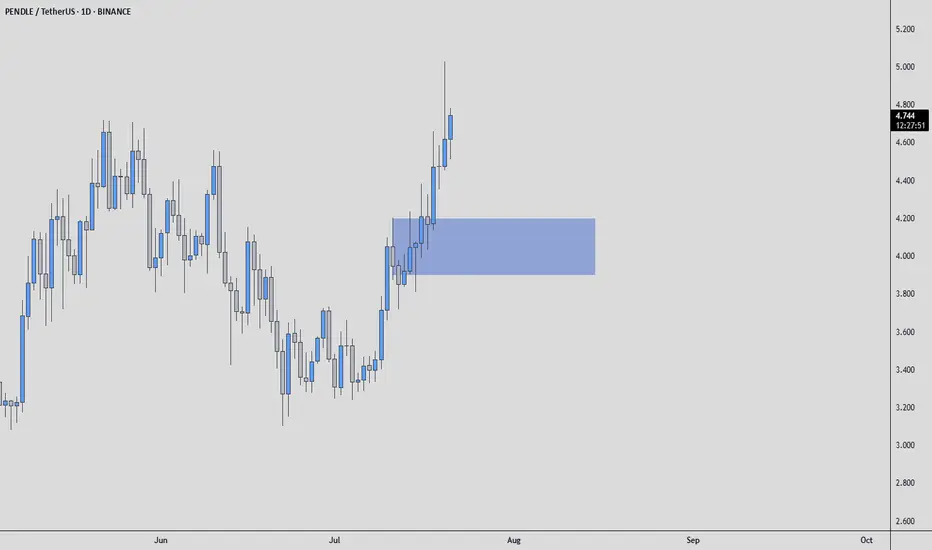
PENDLEUSDT Mid-Term AnalysisVolume is increasing steadily, and the coin is cooking well.
I see no reason not to try a long from the blue box I’ve marked. This is where I’m interested, nothing more.
What we’re looking for:
✅ Entry from the blue box if the opportunity comes
✅ Clear footprint absorption and CDV support
✅ Structure reclaim for confirmation
No hype. No guessing targets. We let the market show us the next step.
If the setup aligns, we take it with tight risk. If it doesn’t, we wait.
Simple. Calm. Focused.
📌I keep my charts clean and simple because I believe clarity leads to better decisions.
📌My approach is built on years of experience and a solid track record. I don’t claim to know it all but I’m confident in my ability to spot high-probability setups.
📌If you would like to learn how to use the heatmap, cumulative volume delta and volume footprint techniques that I use below to determine very accurate demand regions, you can send me a private message. I help anyone who wants it completely free of charge.
🔑I have a long list of my proven technique below:
🎯 ZENUSDT.P: Patience & Profitability | %230 Reaction from the Sniper Entry
🐶 DOGEUSDT.P: Next Move
🎨 RENDERUSDT.P: Opportunity of the Month
💎 ETHUSDT.P: Where to Retrace
🟢 BNBUSDT.P: Potential Surge
📊 BTC Dominance: Reaction Zone
🌊 WAVESUSDT.P: Demand Zone Potential
🟣 UNIUSDT.P: Long-Term Trade
🔵 XRPUSDT.P: Entry Zones
🔗 LINKUSDT.P: Follow The River
📈 BTCUSDT.P: Two Key Demand Zones
🟩 POLUSDT: Bullish Momentum
🌟 PENDLEUSDT.P: Where Opportunity Meets Precision
🔥 BTCUSDT.P: Liquidation of Highly Leveraged Longs
🌊 SOLUSDT.P: SOL's Dip - Your Opportunity
🐸 1000PEPEUSDT.P: Prime Bounce Zone Unlocked
🚀 ETHUSDT.P: Set to Explode - Don't Miss This Game Changer
🤖 IQUSDT: Smart Plan
⚡️ PONDUSDT: A Trade Not Taken Is Better Than a Losing One
💼 STMXUSDT: 2 Buying Areas
🐢 TURBOUSDT: Buy Zones and Buyer Presence
🌍 ICPUSDT.P: Massive Upside Potential | Check the Trade Update For Seeing Results
🟠 IDEXUSDT: Spot Buy Area | %26 Profit if You Trade with MSB
📌 USUALUSDT: Buyers Are Active + %70 Profit in Total
🌟 FORTHUSDT: Sniper Entry +%26 Reaction
🐳 QKCUSDT: Sniper Entry +%57 Reaction
📊 BTC.D: Retest of Key Area Highly Likely
📊 XNOUSDT %80 Reaction with a Simple Blue Box!
📊 BELUSDT Amazing %120 Reaction!
📊 Simple Red Box, Extraordinary Results
📊 TIAUSDT | Still No Buyers—Maintaining a Bearish Outlook
📊 OGNUSDT | One of Today’s Highest Volume Gainers – +32.44%
📊 TRXUSDT - I Do My Thing Again
📊 FLOKIUSDT - +%100 From Blue Box!
📊 SFP/USDT - Perfect Entry %80 Profit!
📊 AAVEUSDT - WE DID IT AGAIN!
I stopped adding to the list because it's kinda tiring to add 5-10 charts in every move but you can check my profile and see that it goes on..
PENDLEUSDT
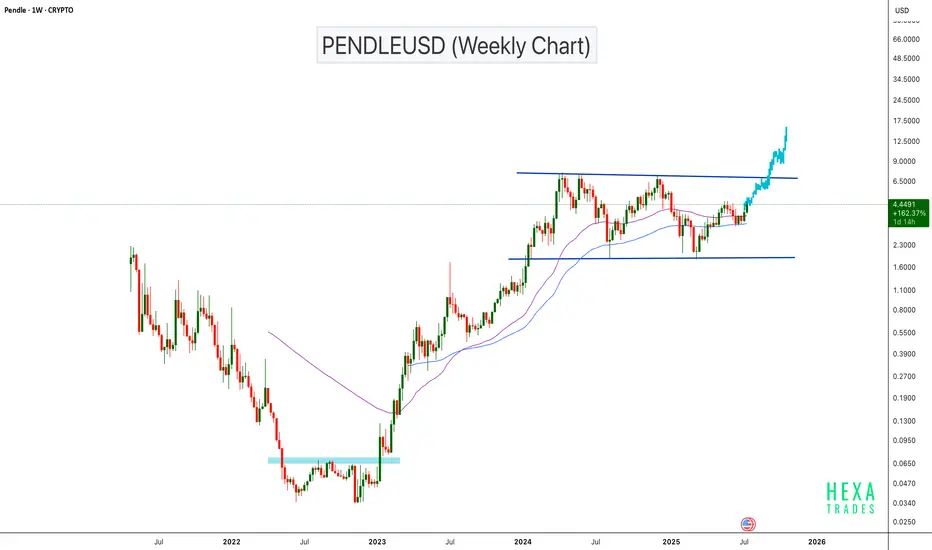
PENDLEUSD Bullish Continuation Setup!BINANCE:PENDLEUSDT has surged approximately 20,000% from its bottom, showing exceptional long-term strength. The price is now approaching a major horizontal resistance zone on the weekly chart. If the price breaks the parallel channel resistance, we can expect a bullish continuation with a psychological target of $15.
Cheers
Hexa
CRYPTOCAP:PENDLE CRYPTO:PENDLEUSD
PENDLE ranging = preparing for a movePENDLE is in a nice range. The price is currently in the middle of the range; however, if it gets overbought, it is likely that the price will visit the top of the range. If this range ultimately forms a bull flag, there is upside potential to consider.
Full TA: Link in the BIO

PENDLE – Bullish Continuation Setup from Key Support ZonePENDLE remains one of the standout performers in the crypto space, maintaining its bullish market structure even amid broader market uncertainty. With price currently holding well above key support, this presents a favorable opportunity for a swing long position, especially if the broader market stabilizes.
📥 Entry Zone:
$3.50 – $4.30
🔹 Confluence with previous resistance turned support
🔹 Demand zone within bullish structure
🔹 Ideal for scaling in
🎯 Take Profit Targets:
🥇 $5.45
🥈 $6.30
🥉 $6.85
🛑 Stop Loss:
Daily close below $3.00
Structure breakdown

Pendle New ATH, Resistance & Support —Highest Ever Within MonthsWatch the same price range alternate between resistance and support, the blue line/space on the chart.
There is also a long-term double-bottom and the Adam & Eve formation, all together in the same chart.
This paints a picture of a changing cycle. The recovery from the A&E is quite strong. From the 11-March low we have two long months of painful recovery, slow and steady growth. But PendleUSDT now trades above resistance/support.
The chart is self-explanatory, once on the bullish zone, PENDLEUSDT can grow. This is the situation now. Resistance was conquered 9-May. The proceeding days it was tested as support and holds.
We can expect some consolidation above this level and then boom! A strong advance hitting new highs. Pendle is set to hit its highest prices ever in 2025 and then some more. $11 and $16 are the main targets.
Thank you for reading.
Namaste.

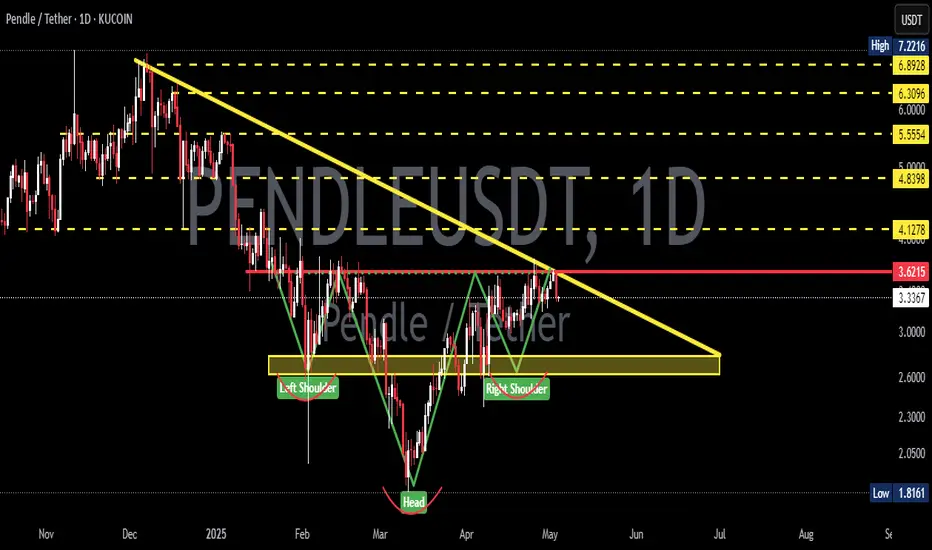
PENDLE Bearish Head and Shoulders – Potential Pullback at the Ne CRYPTOCAP:PENDLE Bearish Head and Shoulders – Potential Pullback at the Neckline 📉
CRYPTOCAP:PENDLE has formed a bearish head and shoulders pattern. We could see a potential pullback at the neckline before the price moves down to the green line level as the next target. 📊

PENDLEUSDT 📈 PENDLEUSDT 4H Analysis:
Price rebounded from the 2.444 demand zone after a short-term breakdown and is now stabilizing above the 200 EMA, with the bullish trendline still intact. Key resistance lies at 3.219, and breaking it could open the path to 3.602. However, a drop below 2.626 and the trendline may trigger a deeper correction.

PENDLEUSDT 2D AnalysisPENDLE ~ 2D Analysis
#PENDLE Buy when re -testing this support block or buy after successfully penetrating this resistant line with a short -term target of at least 10%+.
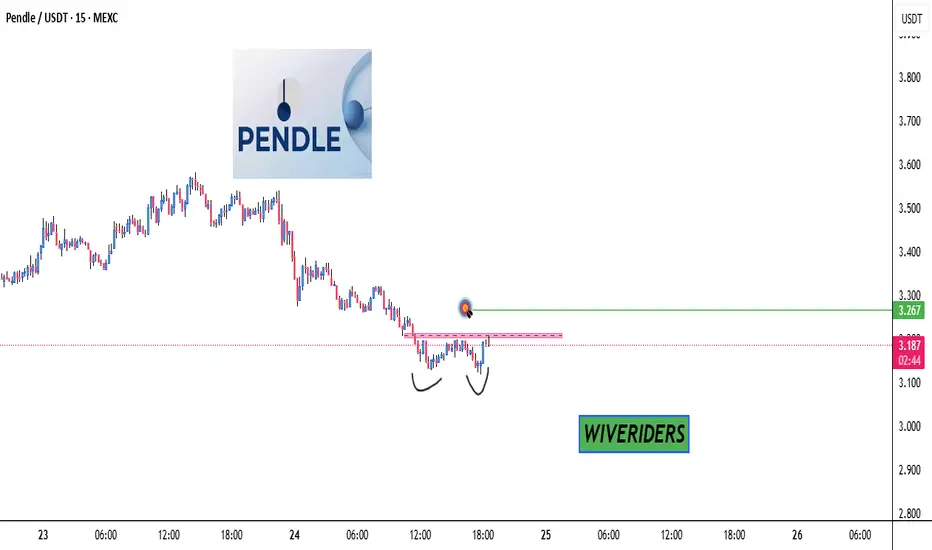
Double Bottom Breakout Watch! 📈 CRYPTOCAP:PENDLE - Double Bottom Breakout Watch! 👀
⏳ On the lower timeframe, CRYPTOCAP:PENDLE has formed a double bottom pattern.
🔴 Confirmation needed: Break and close above the red resistance zone.
🎯 Target: Green line level on a successful breakout! 🚀
#PENDLE/USDT#PENDLE
The price is moving within a descending channel on the 1-hour frame and is expected to continue upward.
We have a trend to stabilize above the 100 moving average once again.
We have a downtrend on the RSI indicator, which supports the upward move with a breakout.
We have a support area at the lower boundary of the channel at 2.63.
Entry price: 2.85
First target: 3.07
Second target: 3.20
Third target: 3.40

PENDLEUSDT 1DPENDLE ~ 1D Analysis
#PENDLE Buy gradually after successfully penetrating this resistant line with a short -term target of at least 10%+.

Trading opportunity for PENDLEUSDTBased on technical factors there is a Buy position in :
📊 PENDLEUSDT
🔵 Buy Now
🪫Stop loss 1.800
🔋Target 2.550
📏 R/R 2
💸RISK : 1%
We hope it is profitable for you ❤️
Please support our activity with your likes👍 and comments📝

READDY FOR PENDLE PUMPPENDLE is ready for pump. its in major daily demand zone, We can see a good positive move from here.

The key is whether it can be supported and rise near 3.624
Hello, traders.
If you "Follow", you can always get new information quickly.
Please click "Boost" as well.
Have a nice day today.
-------------------------------------
(PENDLEUSDT 1D chart)
It has risen near the HA-Low indicator point of 3.624.
Accordingly, the key is whether it can be supported and rise near 3.624.
If the price maintains above the Trend Cloud indicator, it is highly likely to turn into an uptrend.
If the uptrend continues,
1st: 4.109
2nd: 4.907
3rd: 6.376-6.744
You can respond depending on whether there is support near the 1st-3rd above.
In particular, if the M-Signal indicator of the 1W chart passing near 4.109 rises above and the price is maintained, I think there is a possibility that a full-fledged uptrend will begin.
-
If it falls from the 3.624 point, whether there is support near 3.113 is important.
If it falls below the Fibonacci ratio 0 (2.488), it is better to wait until it rises because you cannot tell when it will rise.
----------------------------------------
If you refer to too many indicators, there is a possibility that the transaction will proceed in the wrong direction.
Therefore, it is important to limit the indicators you want to refer to and try to trade according to the trend.
-
The indicators that indicate the trend in this chart are the Trend Cloud indicator and the M-Signal indicator of the 1D, 1W, and 1M charts.
Therefore, you can check whether the trend is rising or falling by checking the status and arrangement of the Trend Cloud indicator.
In addition, you can check the overall trend by checking whether the M-Signal indicator of the 1D, 1W, and 1M charts is in the correct arrangement or reverse arrangement.
-
The HA-Low and BW(0) indicators indicate the low point range.
Therefore, if supported by these indicators, there is a high possibility of rising.
However, if it fails to rise and falls below the HA-Low and BW(0) indicators, there is a possibility of starting a stepwise downtrend, so be careful.
-
The HA-High, BW(0), and BW(100) indicators indicate the high point range.
Therefore, if resisted by these indicators, there is a high possibility of falling.
However, if it fails to fall and rises above the HA-High and BW(100) indicators, there is a possibility that a stepwise upward trend will begin.
-
The indicators listed above are the core indicators among the indicators on this chart.
The indicators other than these are secondary indicators used when conducting split transactions.
-
Thank you for reading to the end.
I hope you have a successful transaction.
--------------------------------------------------
- Big picture
I used TradingView's INDEX chart to check the entire range of BTC.
(BTCUSD 12M chart)
Looking at the big picture, it seems to have been maintaining an upward trend following a pattern since 2015.
In other words, it is a pattern that maintains a 3-year upward trend and faces a 1-year downward trend.
Accordingly, the upward trend is expected to continue until 2025.
-
(LOG chart)
Looking at the LOG chart, you can see that the upward trend is decreasing.
Accordingly, the 46K-48K range is expected to be a very important support and resistance range from a long-term perspective.
Therefore, we expect that we will not see prices below 44K-48K in the future.
-
The Fibonacci ratio on the left is the Fibonacci ratio of the uptrend that started in 2015.
In other words, it is the Fibonacci ratio of the first wave of the uptrend.
The Fibonacci ratio on the right is the Fibonacci ratio of the uptrend that started in 2019.
Therefore, it is expected that this Fibonacci ratio will be used until 2026.
-
No matter what anyone says, the chart has already been created and is already moving.
How to view and respond to this is up to you.
When the ATH is updated, there are no support and resistance points, so the Fibonacci ratio can be used appropriately.
However, although the Fibonacci ratio is useful for chart analysis, it is ambiguous when used as support and resistance.
This is because the user must directly select the important selection points required to create Fibonacci.
Therefore, since it is expressed differently depending on how the user specifies the selection points, it can be useful for chart analysis, but it can be seen as ambiguous when used for trading strategies.
1st : 44234.54
2nd : 61383.23
3rd : 89126.41
101875.70-106275.10 (Overshooting)
4th : 134018.28
151166.97-157451.83 (Overshooting)
5th : 178910.15
-----------------

Pendle: A DeFi tool for risk and revenue sharingPendle is not just another DeFi project, it's a tool that cuts to the heart of the cryptocurrency profitability problem. Most people in the industry are chasing quick profits, not realizing that the market is a zero-sum game in which most people lose. Pendle, on the other hand, offers something different: the ability to split an asset into principal and future gains by tokenizing them. It's not just clever, it's brilliant. Why? Because it allows traders and investors to manage risk and return in a way that no one else can. Most DeFi protocols are just pretty wrappers for high-risk schemes. They promise you returns, but they don't tell you that you're risking everything, especially in a bear market. Pendle solves this problem by allowing you to lock in a return in advance or speculate on it. It's like insurance against volatility, but with the opportunity to earn more if you know what you're doing. And here's the paradox: the DeFi market is growing, but most participants don't even understand how the underlying economics work. Pendle gives you the tools to stay one step ahead. One more point: tokenizing yield through PT (base token) and YT (yield token) is not just a technical trick. It's a way to separate risks and opportunities. You can sell YT if you want to get rid of uncertainty, or buy it if you believe in yield growth. It's like options, but in the DeFi world where the rules aren't settled yet. And guess what? Most investors don't realize this. They only see the price of the PENDLE token, but they don't see what's behind it.
Alex Kostenich,
Horban Brothers.

QTUMUSDT UPDATEQTUMUSDT is a cryptocurrency trading at $3.555. Its target price is $5.500, indicating a potential 50%+ gain. The pattern is a Bullish Falling Wedge, a reversal pattern signaling a trend change. This pattern suggests the downward trend may be ending. A breakout from the wedge could lead to a strong upward move. The Bullish Falling Wedge is a positive signal, indicating a potential price surge. Investors are optimistic about QTUMUSDT's future performance. The current price may be a buying opportunity. Reaching the target price would result in significant returns. QTUMUSDT is poised for a potential breakout and substantial gains.

PENDLEUSDT 3DPENDLE ~ 3D
#PENDLE So far it still continues to maintain this support block. If you still have Conviction on this coin,. Buy from here with a minimum target of 20%++

PENDLE target $8.64h time frame
-
Entry: $3.9
TP: $8.6
SL: $3.05
RR: 5.41
-
(1) PENDLE is building a descending wedge which is a standard correction from previous pump
(2) Currently stand on a comparable low point
(3) Fibonacci provides first target at $8.6 and final target at $12.5
(4) Stop loss once going below $3.05

PendleUSDT Long IdeaIf Pendle comes to fill the 50% of the 4hr wick which is where the 1hr 50ema sits, I'll attempt a long for 7.12RR towards the nearest available 1D 50% of an unfilled wick, which is at 7.265.
Please, share your opinion on this bias in the comments section. If you take it, let me know.

PENDLEUSDT 5DPENDLE Update ~ 5D
#PENDLE In the 5D Time Frame it forms a rounding bottom pattern. If you still have Conviction on this coin, Buy gradually after breaking through this resistance block. New highs are only a matter of time.

Trading opportunity for PENDLEUSDTBased on technical factors there is a Sell position in :
📊 PENDLEUSDT
🔴 Sell Now
🪫Stop loss 6.890
🔋Target 1 4.778
🔋Target 2 4.100
🔋Target 3 3.510
💸RISK : 1%
We hope it is profitable for you ❤️
Please support our activity with your likes👍 and comments📝

PENDLEUSDT Long Setup Setting / Spot TradeBINANCE:RDNTUSDT
📈Which side you pick?
Bull or Bear
Low-risk status: 3x-4x Leverage
Mid-risk status: 5x-8x Leverage
(For beginners, I suggest low risk status)
👾Note: The setup is active but expect the uncertain phase as well. also movement lines drawn to predict future price reactions are relative and approximate.
➡️Entry Area:
Yellow zone
⚡️TP:
7.41
8.08
8.70
9.42
🔴SL:
5.579
🧐The Alternate scenario:
If the price stabilizes against the direction of the position, below or above the trigger zone, the setup will be canceled.

PENDLE Long Spot Trade (Bullish Continuation) Market Context:
PENDLE, a standout in the Ethereum ecosystem, is maintaining bullish momentum, printing higher lows while holding above the 200-day EMA. These signals point toward a continuation of the uptrend, with a likely retest of prior highs.
Trade Setup:
Entry Zone: Around $4.50
Take Profit Targets:
First target: $6.80
Second target: $9.40
Stop Loss: Daily close below $4.00
This trade focuses on strength in a trending market, with well-defined support and upside targets. Monitor for volume confirmation and any deviations below the 200-day EMA.
