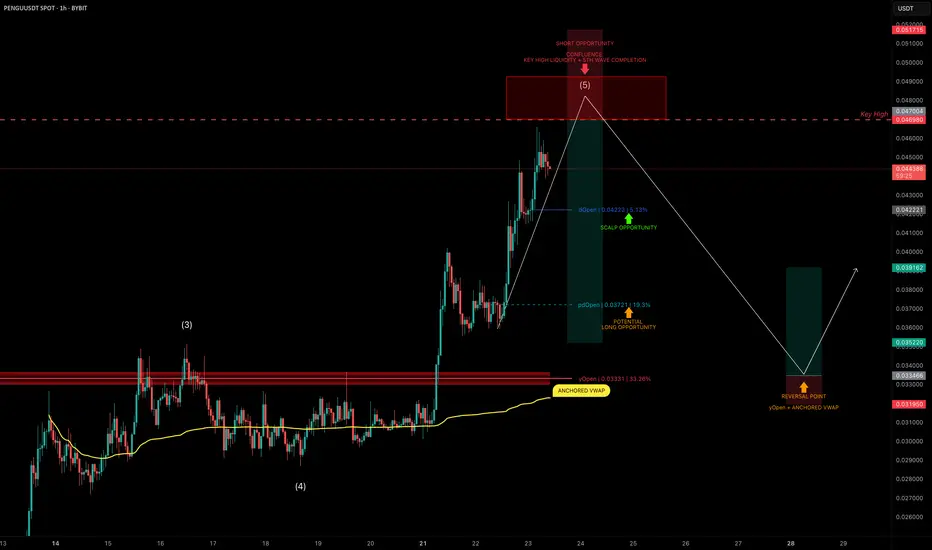
PENGU Topping Out? Targeting 30% Downside After Liquidity SweepPENGU has had an explosive run, but it now looks to be nearing completion of wave 5 of its current Elliott impulse.
We’re approaching a key high at $0.04698, a likely liquidity grab zone — and potentially a great area to position for a short trade.
🧩 Short Setup Overview
➡️ Wave 5 Completion Incoming:
Price is showing signs of exhaustion as it approaches $0.04698, where liquidity is likely stacked above the previous high.
➡️ SFP Trigger Zone:
Watch for a swing failure pattern (SFP) at $0.04698 — confirmation for a potential short entry.
➡️ Psychological Resistance:
The $0.05 level also sits just above — a classic psychological barrier that may get tapped or wicked into.
🔴 Short Trade Setup
Entry: After a confirmed SFP at $0.04698–$0.05
Target (TP): Yearly Open (yOpen) — potential move of ~30%
Stop-loss: Above post-SFP high
R:R: Excellent asymmetry if setup confirms
🛠 Indicator Note
In this analysis I'm using my own indicator called "DriftLine - Pivot Open Zones ", which I recently published.
✅ It helps highlight key open levels, support/resistance zones, and price structure shifts — all critical for confluence-based trade planning.
Feel free to check it out — you can use it for free by heading to my profile under the “Scripts” tab.
💡 Educational Insight: How to Trade Wave 5 Liquidity Sweeps
Wave 5 tops often trap late longs, especially when paired with psychological levels and key highs.
➡️ Patience is key — wait for a rejection pattern or SFP before entering.
➡️ Liquidity sweeps first — then the move.
Final Thoughts
PENGU is pushing toward $0.04698–$0.05, but this may be its final move up before correction.
With the yearly open as a logical target, and clear confluence via DriftLine, this setup offers a clean short opportunity — if confirmation comes.
Stay sharp, let price lead, and trade the reaction — not the prediction.
_________________________________
💬 If you found this helpful, drop a like and comment!
Want breakdowns of other charts? Leave your requests below.
PENGU
PENGUUSDT Daily Chart Analysis | Powerful Uptrend in PlayPENGUUSDT Daily Chart Analysis | Powerful Uptrend in Play
🔍 Let’s dissect the current PENGU/USDT daily chart, highlighting the unmistakable bullish structure and mapping potential targets as this trend matures.
⏳ Daily Overview
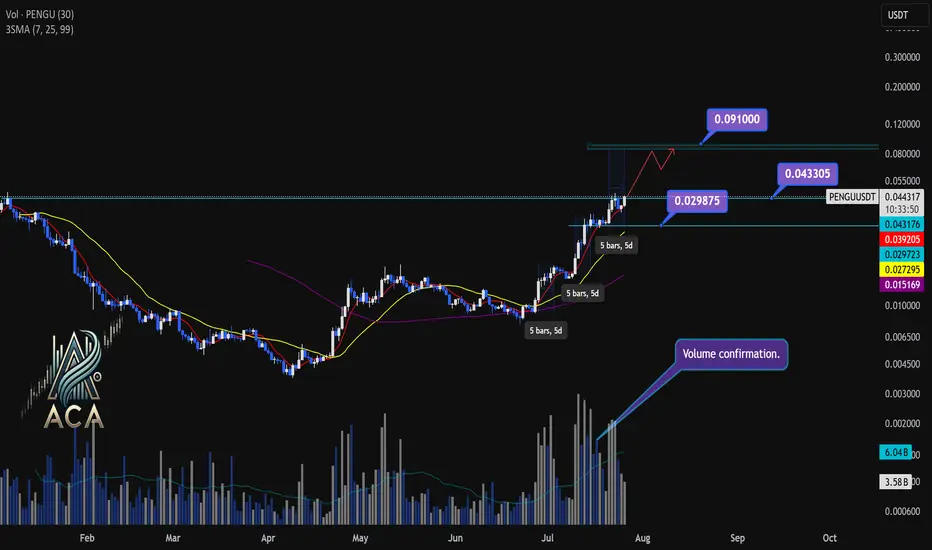
PENGUUSDT is riding a strong upward trend, with all three daily SMAs (7, 25, and 99) lined up in bullish sequence—clear confirmation of momentum. Recent rallies are also supported by textbook volume behavior: volume consistently surges during price climbs and tapers off during minor corrections, reflecting the classic signature of a robust uptrend.
🔺 Bullish Setup and Price Targets:
The next major upside target sits at $0.0910, almost 85% above the current level. For bulls, a daily candle closing above $0.043305 with convincing volume should act as a confirmation for fresh highs—though, as it’s Saturday, even moderate volume could suffice for a valid breakout.
📊 Key Highlights:
- All SMAs (7, 25, 99) confirming the uptrend on daily timeframe.
- Volume spikes on upward moves, fades on corrections—classic bullish confirmation.
- Historical trend velocity: Each time a new high (HH) is set, it’s preceded by around 5 days of advance; first leg was +83%, second +124%, the next (projected) is +160%, aligning with the $0.0910 target.
- Corrections: After each rally, pullbacks have measured about 15% and 20%. Should the first target be reached, expect a correction up to 25%—a healthy reset for further continuation.
🚨 Conclusion:
With all signals aligned—moving averages, volume dynamics, and historic price structure—the path remains bullish. A decisive close above $0.043305, especially with solid volume, could be the catalyst for the next major leg higher. As always, monitor for typical correction ranges post-breakout in line with the prior trend.
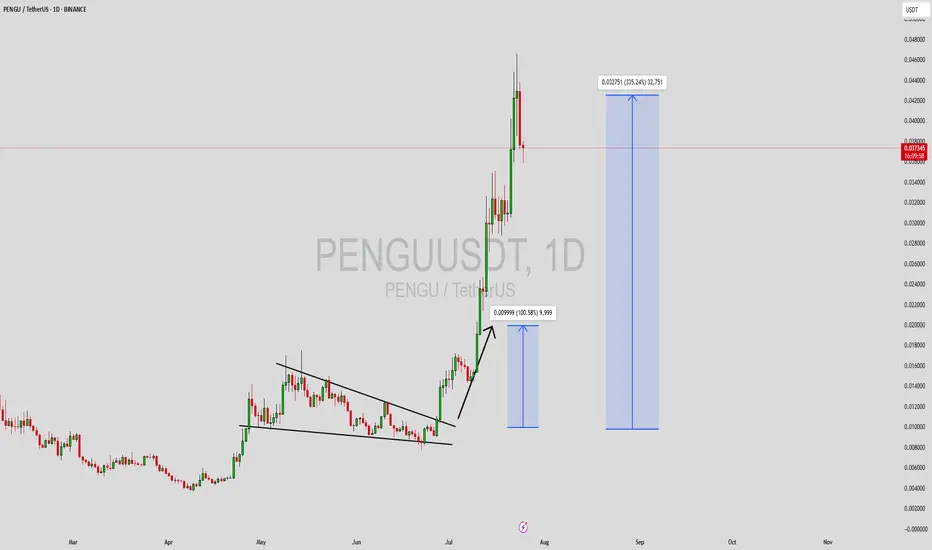
PENGUUSDT Forming Falling WedgePENGUUSDT has recently formed a classic falling wedge pattern on the chart—a well-known bullish reversal structure that often precedes explosive upward price movements. As the wedge narrows and consolidates, it typically signals a decline in selling pressure, preparing for a significant breakout. In PENGU's case, this technical setup, paired with increasing volume, points toward a potentially massive upside of 300% to 350% or more, making it one of the most closely watched low-cap altcoins right now.
This crypto project has been attracting fresh investor interest across various social platforms and trading forums, signaling growing awareness and community engagement. The technical pattern aligns with recent shifts in market sentiment, and volume confirmation during the breakout would provide further confidence to traders. Historically, such setups in meme and low-cap community tokens have led to sharp rallies once momentum builds up, particularly when backed by enthusiastic investor sentiment.
Market conditions currently favor altcoin breakouts, and PENGU appears to be positioning itself for a parabolic move. Traders looking for high-risk, high-reward plays may find this pair especially attractive, given the technical clarity and strong accumulation signals seen at current levels. The confluence of pattern breakout, solid volume, and social buzz could create a perfect storm for significant upside.
As always, risk management is key, but the setup offers a compelling technical opportunity worth watching closely in the coming days. A confirmed breakout above resistance could kickstart the rally and attract further retail and speculative flow.
✅ Show your support by hitting the like button and
✅ Leaving a comment below! (What is You opinion about this Coin)
Your feedback and engagement keep me inspired to share more insightful market analysis with you!
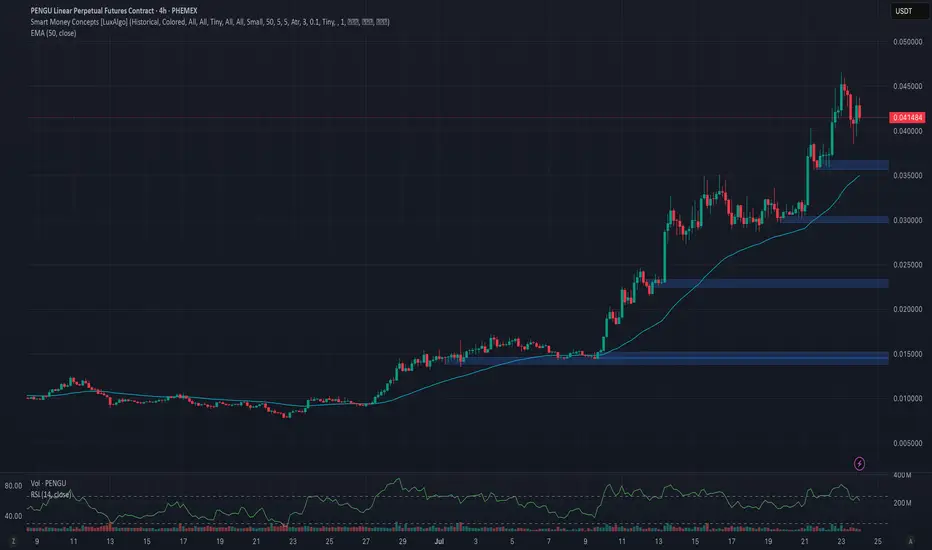
Is $PENGU Cooling Off?CSECY:PENGU continues to deliver, respecting structure and printing some clean price action. After breaking out of consolidation beneath the LOI at 0.032, price extended sharply, reaching as high as 0.0469—where we just saw a firm rejection, previously identified in the last update.
That level wasn’t random. It aligned with a Most Likely Target (MLT) for a wave 5 at a lesser degree and a wave 3 at a higher degree. That kind of confluence usually draws in some heat—and it did.
So what now?
The conservative bull outlook is that we may be entering a wave 4. How this pullback unfolds could tell us a lot. The last retrace was shallow, and if this one digs a bit deeper or breaks certain levels with pattern clarity, that might signal a higher degree wave 4 is underway. The key level here is the 0.0325 level we were watching before.
The raging bull scenario is that we’re still in a lesser degree impulse up. A hold and bounce off the key level could be enough to continue the move higher. But I’m watching the conservative outlook here until we get more print.
Here’s what I’m watching:
• Wave 4 Behavior
Is this a pause or a pivot? The next leg depends on how corrective this gets.
• 0.027
A break here would raise eyebrows. That’s a deeper level of interest and could hint at something more than a minor pullback.
• Pattern Depth & Structure
Each retrace tells a story. More complex wave 4s tend to show themselves through drawn-out corrections or deeper fib targets.
I’m still holding partial from the original 0.012 entry, having taken some profit on the way up. If we get a clean W4 print, I’ll be scouting for the next add.
Trade what’s printed. Stay flexible. Let the wave show its hand.
Trade Safe.
Trade Clarity.

PENGU. Main trend. Trend reversal zone. 04 07 2025Logarithm. Main trend. Fresh cryptocurrency, which is being driven into hype.
Locally now. Price at the median of the bowl.
Buyer volume dominates. Most likely, there will be a large pump in case of a breakout.
The chart is somewhat reminiscent of the Bitcoin chart, the reversal zones of this secondary trend, after the first local wave of growth. The first local, significant target is shown.
There is a possibility of a helicopter, that is, to collect stops in both directions, and thereby dump passengers before a potential pump.
Such cryptocurrencies (low liquidity, monopoly over the price due to the concentration of cryptocurrency in “one hand”) at a good time "the hamster is not scared", will be pumped up conditionally, like Shiba Inu (SHIB), driving the hype (raising the price over and over again, and coming up with positive news) and 0.5 million Twitter subscribers (X). Medium-term — long-term level zones are shown on the chart.

Phemex Analysis #99: PENGU Explodes 480%!Will the Hype Continue?Pudgy Penguins (PENGU), a playful and increasingly popular meme coin, has recently made waves in the crypto market due to its rapid price movements and strong community support. Originally inspired by the beloved Pudgy Penguins NFT collection, PENGU has rapidly transitioned from niche interest to broader market phenomenon.
In recent trading, PENGU surged impressively by nearly 480%, primarily fueled by major exchange listings and growing influencer endorsements. Currently trading around $0.041, PENGU has caught the attention of both meme-coin enthusiasts and seasoned crypto traders, sparking debates over its next big move.
With significant market attention and notable volatility, traders now face an essential question: Is PENGU poised for further explosive growth, or should traders brace for a potential pullback? Let's carefully evaluate several likely scenarios.
Possible Scenarios
1. Bullish Breakout (Continuing the Hype!)
PENGU’s recent price action suggests bullish momentum may persist, especially if the community-driven hype continues. A decisive breakout above recent resistance at $0.046—particularly if supported by increasing trading volumes—could accelerate the bullish trend, targeting next levels at $0.05 and possibly the psychological level of $0.08.
Pro Tips:
Entry Strategy: Consider entering positions only after confirmation of a high-volume breakout above $0.046.
Profit-Taking Targets: Plan partial profit-taking around next key resistance zones at $0.05 and $0.08 to manage risk effectively.
Risk Management: Set tight stop-losses just below recent support levels around $0.035.
2. Short-Term Correction (Healthy Retracement)
Given PENGU’s recent rapid rise, a short-term retracement to retest support levels around $0.035 or lower ($0.03) is likely. If this pullback happens on low volume, it could indicate a healthy consolidation rather than a full trend reversal.
Pro Tips:
Buying the Dip: Closely watch support at $0.035 and $0.03; a low-volume test of these levels might provide excellent entry points for traders who missed earlier rallies.
Volume Monitoring: Ensure low-volume retracements—high volume during declines might signal deeper bearish pressure.
3. Bearish Reversal (The Hype Fades)
As is typical with volatile meme coins, sudden reversals can occur if market sentiment swiftly changes. A high-volume drop below critical support around $0.035 could trigger more significant bearish sentiment, potentially targeting deeper support around $0.022 or even $0.0135.
Pro Tips:
Caution on Reversal Signals: Consider exiting or reducing positions if PENGU decisively breaks below key support levels with strong selling volume.
Accumulation Opportunities: Long-term believers might use significant pullbacks toward $0.022 or $0.0135 as strategic accumulation opportunities after price stabilization occurs.
Conclusion
Pudgy Penguins (PENGU) currently sits at an intriguing juncture, offering traders both opportunities and risks. Traders should carefully watch the outlined scenarios, particularly breakout signals above $0.046 and support levels around $0.035 and $0.03. Through disciplined entry and exit strategies, attentive volume analysis, and vigilant risk management, traders can navigate PENGU’s volatility and potentially profit from its next big move.
🔥 Tips:
Armed Your Trading Arsenal with advanced tools like multiple watchlists, basket orders, and real-time strategy adjustments at Phemex. Our USDT-based scaled orders give you precise control over your risk, while iceberg orders provide stealthy execution.
Disclaimer: This is NOT financial or investment advice. Please conduct your own research (DYOR). Phemex is not responsible, directly or indirectly, for any damage or loss incurred or claimed to be caused by or in association with the use of or reliance on any content, goods, or services mentioned in this article.
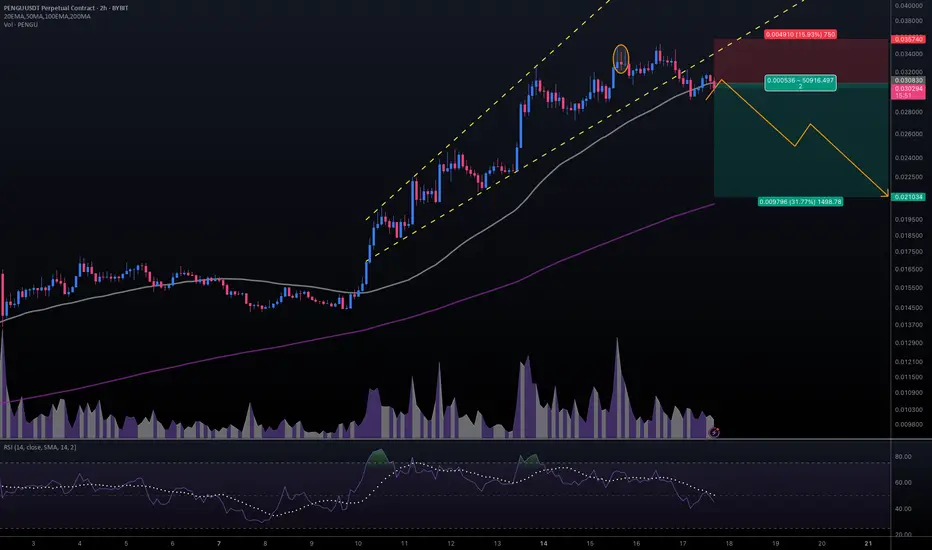
#PENGUUSDT #2h (ByBit) Broadening wedge breakdownPudgy Penguins printed an evening star then lost 50MA, seems to be heading towards 200MA support next.
⚡️⚡️ #PENGU/USDT ⚡️⚡️
Exchanges: ByBit USDT
Signal Type: Regular (Short)
Leverage: Isolated (2.5X)
Amount: 5.0%
Entry Targets:
1) 0.030830
Take-Profit Targets:
1) 0.021034
Stop Targets:
1) 0.035740
Published By: @Zblaba
CSECY:PENGU BYBIT:PENGUUSDT.P #4h #PludgyPenguins #Meme pudgypenguins.com
Risk/Reward= 1:2.0
Expected Profit= +79.4%
Possible Loss= -39.8%
$PENGU Penguin consolidation at the moment.As long as CSECY:PENGU remains between .039 and .035 I consider it in consolidation. Breaks above or below these levels should see the targets posted.

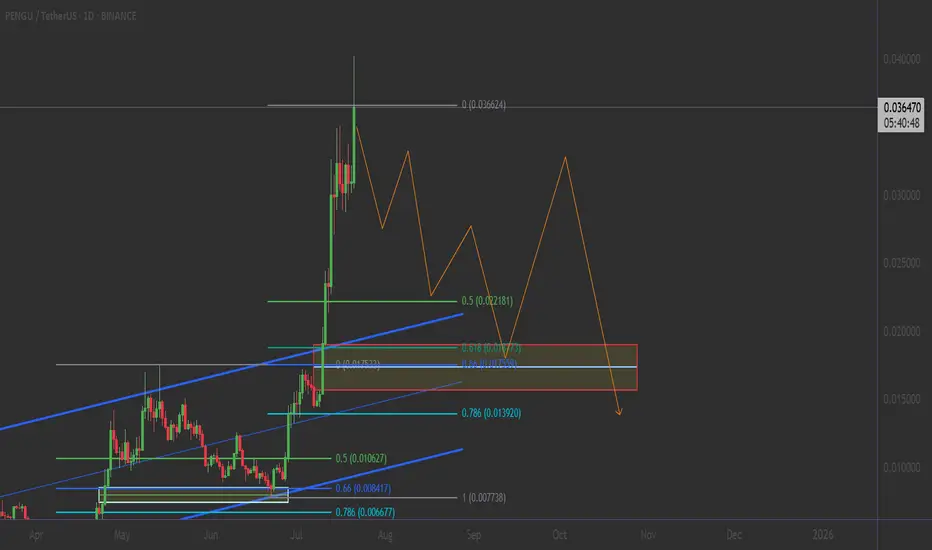
PENGU/USDT: THE ULTIMATE FIBONACCI RETRACEMENT PLAY💎 THE GOLDEN SETUP: 5-Point Technical Confluence
1️⃣ FIBONACCI MASTERCLASS IN ACTION
0.5 Fib Level: $0.021181 (HELD PERFECTLY) ✅
0.618 Golden Ratio: $0.017920 (Strong Support Zone)
0.786 Deep Retracement: $0.013920 (Ultimate Backstop)
Current Position: Trading above 0.5 Fib = BULLISH CONTROL
__________________
❌ BEARISH
Break below $0.029 (Channel support)
Failure to hold 0.5 Fib level ($0.021)
Volume declining on any pullback
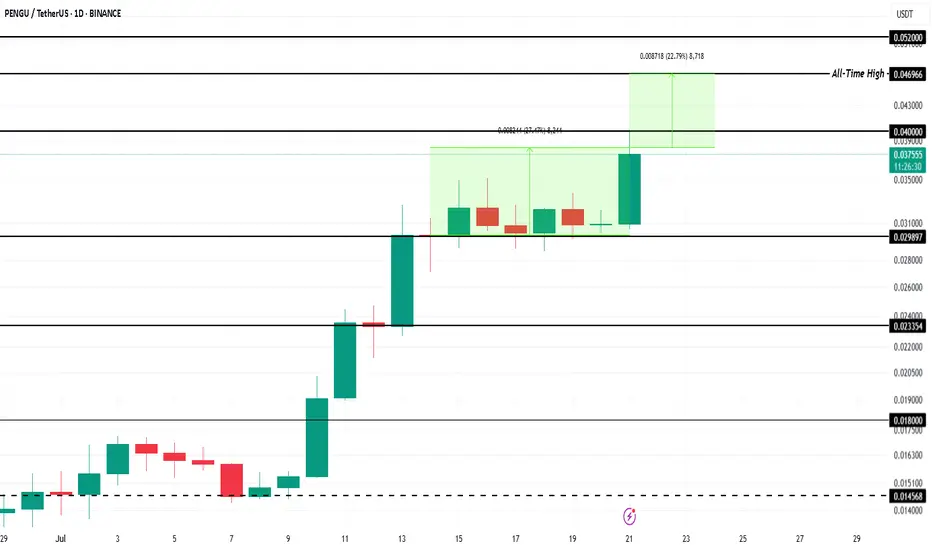
Meme Coin To Watch This Week - Pudgy Penguin (PENGU)BINANCE:PENGUUSDT price has surged 27% in the past week , currently trading at $0.038. The meme coin is inching closer to its all-time high of $0.046 . Strong bullish sentiment and market participation are fueling this rally, signaling that PENGU could soon retest resistance levels if momentum remains intact.
The meme coin is now just 22% away from hitting its record high . A Golden Cross pattern formed last week adds to the bullish outlook. If BINANCE:PENGUUSDT successfully flips $0.040 into a stable support level, the rally could continue, pushing the altcoin higher toward reclaiming its historical peak.
However, downside risks remain. If investors begin booking profits, selling pressure could drag BINANCE:PENGUUSDT lower . The critical support level of $0.029 will come into play. Losing this support could halt the upward trend and invalidate the optimistic price projection in the near term.
PENGUUSDT 50%-150% potentialBINANCE:PENGUUSDT is showing a classic cup and handle breakout on the daily chart, supported by a strong upward move and a bullish structure. Price has successfully broken out of key resistance around 0.0173, and volume is picking up. If momentum continues, the projected target points toward the $0.045 level, suggesting a potential upside of 50%-150%. The setup remains valid as long as price stays above the handle low around 0.0141.
Regards
HExa

$PENGU: Taking Profit and Watching for a TurnIf you find this information inspiring/helpful, please consider a boost and follow! Any questions or comments, please leave a comment!
PENGU has made a strong move off the 0.007 level, now it just popped cleanly out of consolidation beneath the key LOI at 0.032. That break gave us the signal we needed for continuation, and so far, the price has followed through nicely.
But now, we’re approaching a zone where things could get a bit trickier.
This advance is starting to look like a classic wave 3 impulse, and while there’s no clear confirmation of a top yet, signs are beginning to flash caution. That means it’s time to start watching for potential topping behavior—especially if we move into a broader consolidation phase.
Here’s what’s on my radar:
• Wave 3 Exhaustion?
Still unconfirmed, but this could be the final leg of the wave 3 structure.
• AOI or Key Level Rejection
A stall or strong reaction near resistance could be a red flag. Channel parallel being reached.
• Bearish Divergence on the EWO
Momentum isn’t keeping pace with price. That’s often a precursor to a deeper pullback.
No need to force the next move here. This thing could just keep ripping up, but I am being extra cautious here. Not only to look for a potential top, but if a retrace is given, a potential long add to my current trade. Taking profit at these levels makes sense, especially given the early entry from 0.012 and my trade plan.
As always, trade what’s printed, not what’s hoped for. Stay nimble.
Trade Safe!
Trade Clarity!

$PENGU Pudgy PenguinsWithout a breakout to the DOWNside, CSECY:PENGU is still looking bullish for at least a hit to .04.

$PENGU Taking a Breather? CSECY:PENGU Taking a Breather? Wave 4 May Be Brewing
After a strong move, CSECY:PENGU looks like it might be pausing for breath. The recent action suggests we may have just wrapped up a small-degree Wave 3, with price now struggling to clear a key resistance level from earlier in the structure.
That hesitation could mark the early stages of a Wave 4 correction...Conservatively.
Here’s the zone I’m watching for a potential W4 pullback:
- .236 to 50% retracement of Wave 3, measured from the Wave 2 low
- Most Likely Target (MLT) sits right around the .382 fib
- Keep an eye on time symmetry—Wave 4 may offset the time duration of Wave 2
- Price could react off the base channel as a support guide
If this is a W4, it could give us a clean continuation setup into Wave 5—provided it holds structure and doesn’t overlap the Wave 1 territory. Stalking the pullback as it plays out, and am ready to react if we see support step in at the expected fib levels or the base channel.
Trade Safe!
Trade Clarity!

Pengu to Propel Upside to $0.02BYBIT:PENGUUSDT.P
A demand block has formed around $0.01.
Price is now attempting to push above this level.
There may be some pullbacks into the block, but I still expect the uptrend to continue.
The next price target is $0.02.

Pudgy Penguins PENGU price analysis🪙 It seems that #PENGU is being sold off, and the price of OKX:PENGUUSDT has been stuck in consolidation at conditional highs for several days now, where positions are likely being redistributed.
Nevertheless, if at the beginning of the year, after listing, the price of the #PudgyPenguins token was released into not even “free float,” but simply into “free fall,” now, for several months, it has been “held” in a controlled manner.
🐻 If our assumption is correct, then the price of #PENGUUSDT should adjust to $0.01 or, in the worst case, to $0.0065-0.0070
📈 And if we are wrong, then the price of #PENGU has every chance of breaking out through to $0.02 in the coming days. With a global target of $0.03
⁉️ What is your opinion
Is this a fundamental project that is doomed to grow, or just a manipulative memecoin toy?
_____________________
Did you like our analysis? Leave a comment, like, and follow to get more

PENGU Just Triggered a Massive Breakout! Key Levels to WatchYello, Paradisers! Are you watching what’s unfolding with #PENGU after months of quiet accumulation? Because this chart is finally waking up, and it’s happening right now.
💎After a prolonged bottoming phase that lasted approximately 162 sessions, PENGU has completed a classic cup and handle formation, and we’re now seeing the start of what could be a powerful breakout.
💎#PENGUUSDT has surged above the neckline resistance at $0.01680, and—more importantly, this breakout is backed by strong volume, giving the move real credibility. It’s not just a wick; it’s a genuine push.
💎Now that the neckline is broken, PENGU has room to push higher. But let’s be clear, price is likely to face moderate resistance at the $0.02280 level. That’s a spot where some short-term profit-taking can’t be ruled out, especially from early entries. It’s a natural reaction zone and a moment to watch for how price behaves under pressure.
💎Still, if momentum holds, the pattern suggests a potential move toward the $0.02820 to $0.03200 region. That zone is no joke. It includes the 61.8% and 78.6% Fibonacci retracement levels, two of the most powerful technical resistance points in any market cycle. This makes that area a major decision zone and one that should be approached with caution.
💎On the other side, support is now established between $0.01680 and $0.01500. This is the previous resistance zone, and any retest into this range is likely to see strong demand stepping in. It would not be surprising to see buyers defend this area aggressively, especially if the retest is clean and orderly.
Strive for consistency, not quick profits. Treat the market as a businessman, not as a gambler. This is the only way you will make it far in your crypto trading journey. Be a PRO.
MyCryptoParadise
iFeel the success🌴

PENGU still has room!?If you find this information inspiring/helpful, please consider a boost and follow! Any questions or comments, please leave a comment!
The move off the low looked like a clean, completed impulse—sharp, decisive, and well-structured. After that, we got a double zigzag retracement. It ran a bit deeper than the textbook version, but still landed right in the normal range you’d expect for a healthy correction. From there, we saw another smaller-degree impulse form off the .007 pivot, suggesting bullish momentum was building again.
Since the last update, PENGU has come a long way—more than doubling in price and now hovering around a most likely target for a wave 3. What’s notable is how it got there: not just by breaking above the 0.017 resistance, but by blowing through multiple base channels on solid momentum and healthy volume.
We didn’t get the ideal depth for a retrace for a wave 2 before that breakout, but that doesn’t disqualify the larger count. In fact, from an Elliott Wave perspective, I still believe we haven’t seen a proper wave 4 to balance out the earlier wave (2). So I’m holding off on calling a top to this wave 3 just yet.
Here’s what we’re watching closely now:
The secondary impulse off .007 continues to build structure
Ideally, the next pullback holds above the 0.027 or .022 region, signaling respect for previous support and AOIs
That pullback needs to unfold correctively, not impulsively, to confirm bullish continuation
The next trade setup I’m eyeing is that wave 4 into wave 5 move. I’ll be stalking this ticker closely as structure unfolds.
Trade safe.
Trade clarity.
PENGU Crypto Futures Trade Plan 2025-07-13PENGU Crypto Analysis Summary (2025-07-13)
Comprehensive Analysis of PENGU Cryptocurrency Trading Models
1. Summary of Each Model's Key Points
Grok/xAI Report:
Technical Indicators: Price above key moving averages indicating a bullish trend. However, the RSI is at 85.84, suggesting overbought conditions, and the price is touching the upper Bollinger Band. Resistance at $0.03 and support at $0.02. Market Sentiment: Bullish sentiment with recent price changes but signaling potential exhaustion. Direction: Moderately Bearish, recommending a short trade at $0.03, stop-loss at $0.031, and take-profit at $0.02.
Claude/Anthropic Report:
Technical Indicators: Similar to the Grok/xAI report, emphasizing the overbought RSI and position at the upper Bollinger Band. The price trend is recognized as unsustainable due to parabolic movement. Market Sentiment: Acknowledges extreme euphoria in recent gains and anticipates a potential correction. Direction: Moderately Bearish, suggesting a short position with entry at $0.03, stop-loss at $0.032, and a take-profit level targeting $0.025.
Gemini/Google Report:
Technical Indicators: Consistent with other reports, highlighting decent bullish momentum yet extremely overbought indicators signify imminent pullback risks. Market Sentiment: Observation of speculative rationales driving prices, highlighting risk factors in liquidity and broader market sentiment. Direction: Moderately Bearish; recommending a short trade with entry price at $0.03, stop-loss at $0.032, and take-profit at $0.025, sharing similar parameters with previous reports.
DeepSeek Report:
Technical Indicators: Emphasizes overbought conditions with a risk of a 20-40% correction. The current price is significantly above key averages, indicating parabolic action. Market Sentiment: Low funding rates indicate lopsided long positioning, foreseeing potential liquidation events. Direction: Strongly Bearish, supporting short position ideas with similar entry, stop-loss, and take-profit recommendations.
Llama/Meta Report:
Technical Indicators: Highlights resistance at the current price point and overbought indications based on RSI and Bollinger Bands metrics. Market Sentiment: Recognizes caution due to lack of news and low funding rates, suggesting potential for a reversal. Direction: Moderately Bearish; recommending a short position with similar parameters to the other reports.
2. Areas of Agreement and Disagreement Between Models
Agreement:
All models identify the price as overbought with an RSI above 85, signaling an imminent potential correction. A collective sentiment of caution prevails, leading to a recommendation for short trades given the exhaustion of the current bullish momentum. They recognize the price level at $0.03 as key resistance, along with suggesting a stop-loss around $0.031 to $0.032 and a take-profit around $0.025.
Disagreement:
The Grok/xAI report emphasizes a “Moderately Bearish” sentiment where others like DeepSeek classified the trend as “Strongly Bearish.” Some reports recommend modest leverage (50x), while others suggest higher leverage (up to 100x).
3. Conclusion
Overall Market Direction Consensus: The consensus among all models is a Moderately to Strongly Bearish outlook for PENGU, backed by overbought technical indicators and recent rapid price increases without fundamental support.
Recommended Trade:
Trade Direction: Short Entry Price/Range: $0.03 Stop Loss Level: $0.0315 (offering a buffer against outlier volatility) Take Profit Level: $0.025 Position Size Recommendation: Based on account size, aiming for a maximum risk of 1% per trade (e.g., 1 contract for a $100 account). Adjust size appropriately for larger accounts. Confidence Level in Recommendation: 0.70 (overall strength of indicators). Key Risks and Considerations: Risks include further bullish momentum despite technical indicators, potential slippage in volatile conditions, and market liquidity constraints. High leverage could amplify losses. Trade Entry Timing: Enter at market open.
TRADE_DETAILS (JSON Format)
{ "instrument": "PENGU", "direction": "short", "entry_price": 0.030, "stop_loss": 0.0315, "take_profit": 0.025, "size": 1, "confidence": 0.70, "entry_timing": "market_open" }
This concise trade plan consolidates insights from various analyses, aligning on key indicators and market sentiment to create a robust trading strategy for PENGU.
📊 TRADE DETAILS 📊 🎯 Instrument: PENGU 📉 Direction: SHORT 💰 Entry Price: 0.03 🛑 Stop Loss: 0.0315 🎯 Take Profit: 0.025 📊 Size: 1 💪 Confidence: 70% ⏰ Entry Timing: market_open
Disclaimer: This newsletter is not trading or investment advice but for general informational purposes only. This newsletter represents my personal opinions based on proprietary research which I am sharing publicly as my personal blog. Futures, stocks, and options trading of any kind involves a lot of risk. No guarantee of any profit whatsoever is made. In fact, you may lose everything you have. So be very careful. I guarantee no profit whatsoever, You assume the entire cost and risk of any trading or investing activities you choose to undertake. You are solely responsible for making your own investment decisions. Owners/authors of this newsletter, its representatives, its principals, its moderators, and its members, are NOT registered as securities broker-dealers or investment advisors either with the U.S. Securities and Exchange Commission, CFTC, or with any other securities/regulatory authority. Consult with a registered investment advisor, broker-dealer, and/or financial advisor. By reading and using this newsletter or any of my publications, you are agreeing to these terms. Any screenshots used here are courtesy of TradingView. I am just an end user with no affiliations with them. Information and quotes shared in this blog can be 100% wrong. Markets are risky and can go to 0 at any time. Furthermore, you will not share or copy any content in this blog as it is the authors' IP. By reading this blog, you accept these terms of conditions and acknowledge I am sharing this blog as my personal trading journal, nothing more.

PENGU = ETF Catalyst + Whale Accumulation = +30% More Upside?Today, on the weekend, I want to analyze the Pudgy Penguins project with the PENGU ( BINANCE:PENGUUSDT ) token from a fundamental and technical perspective .
Please stay with me.
Why did PENGU surge nearly 40% in just 48 hours? Here’s what’s driving it:
------------------------------------------
Fundamental Analysis:
1. ETF Momentum via Cboe:
On June 26, Cboe officially filed a 19b-4 form for a new ETF that includes Pudgy Penguins and PENGU as major components.
Although not yet approved, this single move has fueled strong institutional anticipation, similar to what happened with Bitcoin ETFs in early 2023.
The market often prices in future narratives — and this ETF storyline has been a powerful one.
2.Whale Accumulation Signals
According to Nansen data, large holders have increased their balances by 11.37%, and notable wallets linked to public figures by 7% over the last 30 days.
Such coordinated accumulation often precedes major price moves, and that pattern seems to be repeating here.
3.NFT Ecosystem Boost
The Pudgy Penguins NFT collection saw a 400%+ surge in sales volume.
This sharp increase in NFT activity has reignited attention toward the broader Pudgy ecosystem, which naturally benefits its native token, PENGU.
Risk Note:
The ETF is not yet approved — we're still in the hype phase.
Volatility remains high, and strong pullbacks are common in low-liquidity tokens like PENGU.
If whale activity continues and institutional narratives grow, the upside potential remains — but so does the downside risk.
------------------------------------------
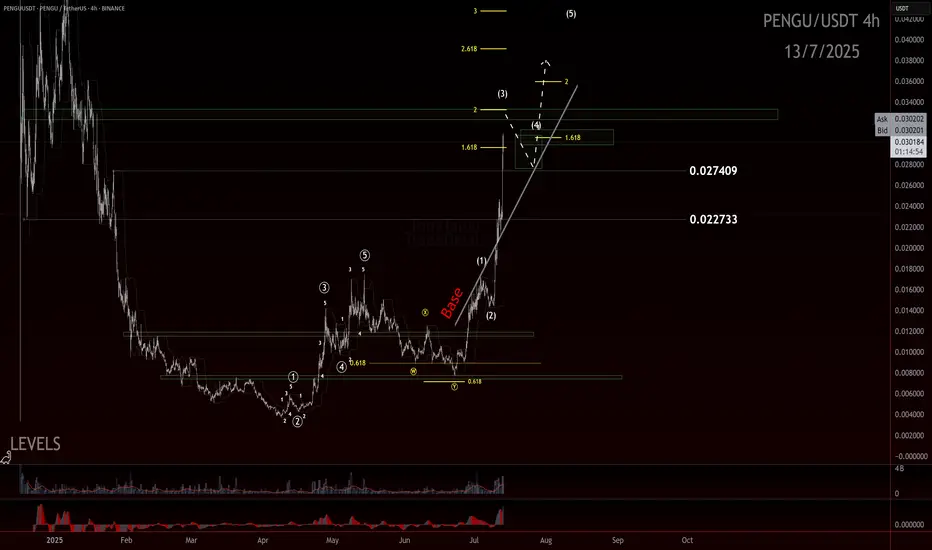
PENGU token started to rise from the Support zone($0.01-$0.0076) . One of the signs of a continuation of the uptrend was the break of the upper line of the descending channel .
Educational Note: One of the price targets after a channel break can be as wide as the width of the broken channel.
In terms of Elliott Wave theory , it seems that the PENGU token has completed the Double Three Correction(WXY) , and we can wait for the next impulsive waves .
I expect the PENGU token to attack the Resistance zone($0.0128-$0.0118) again, and if this zone is broken , it can increase to at least $0.0137(+30%) .
What is your idea about the Pudgy Penguins project?
Note: If the PENGU token drops below $0.01, we can expect a break of the Support zone($0.01-$0.0076).
Please respect each other's ideas and express them politely if you agree or disagree.
Pudgy Penguins Analyze (PENGUUSDT), 4-hour time frame.
Be sure to follow the updated ideas.
Do not forget to put a Stop loss for your positions (For every position you want to open).
Please follow your strategy and updates; this is just my Idea, and I will gladly see your ideas in this post.
Please do not forget the ✅' like '✅ button 🙏😊 & Share it with your friends; thanks, and Trade safe.

$PENGU - Short-term OutlookBINANCE:PENGUUSDT | 4h
Price is now trading above previous resistance. If this level holds as new base support, we could see a retest of the 0.028–0.032 zone
Key local support to hold: 0.0175–0.014
Possible TPs:
.0218-.0233 (scalp)
.0262-.0282
.0295-.0326

The best-looking HTF meme chart, hands down is $PENGUThe team behind the crypto mascot accomplished a lot over the last couple of weeks, and the TA is showing;
- CBOE filing for PENGU ETF
- Appeared at @Nasdaq
- Listed on @eToro
- Listed on @RevolutApp
- Listed on @Official_Upbit
- Listed on @WebullGlobal Pay
- @NASCAR Partnership
- PEZ x Pudgy Penguins Partnership
- Miles & More Partnership
- @PenguClash reached 2M+ on waitlist
- 1B views per day
All this and much more!
@pudgypenguins are doing it the right way 🐧

PENGU/USDT Breakout Power — Start of a New Bullish Wave?
📌 Technical Overview:
The chart of PENGU/USDT on the daily timeframe has just printed a very strong bullish signal. After months of downward movement, the price has successfully broken out from a well-formed Falling Wedge — a classic bullish reversal pattern.
🧠 Pattern Analysis:
📉 Falling Wedge:
The wedge started forming since January 2025, marked by a series of lower highs and lower lows. Price action was squeezed into a narrowing range, indicating weakening bearish pressure.
The breakout in early July came with strong momentum, confirming bullish intent.
🟨 Key Demand Zone (Highlighted Box):
Between 0.0113 – 0.0124 USDT, this area aligns with key Fibonacci retracement levels:
0.5 @ 0.01248
0.618 @ 0.01138
0.786 @ 0.00981
This zone now acts as critical support, offering a possible buy-the-dip opportunity.
📏 Major Resistance Levels (Targets):
TP1: 0.02520 USDT – Minor resistance, first breakout confirmation
TP2: 0.03044 USDT – Structural mid-level resistance
TP3: 0.04316 USDT – Major psychological and structural barrier
TP4: 0.07000 USDT – Former high, potential long-term target
🟢 Bullish Scenario:
Price has cleanly broken above the wedge resistance and is now retesting or consolidating above the prior resistance zone.
As long as the price holds above 0.012 USDT, the bullish structure remains intact.
The ideal bullish path would be:
1. Minor pullback or retest to the yellow box area (demand)
2. Strong rally toward 0.025 USDT, followed by gradual climb toward 0.030 – 0.043 USDT
3. With sustained volume, 0.07 USDT becomes a realistic mid-term target
🔴 Bearish Scenario:
Failure to hold the 0.012 – 0.011 USDT demand zone would trigger a warning sign.
Breakdown below 0.0098 USDT (Fibo 0.786) would invalidate the breakout, and potentially resume the bearish trend.
If this happens, watch for price to revisit lower supports around 0.0075 – 0.0050 USDT
🧩 Volume and Momentum Watch:
The breakout was supported by a clear uptick in volume – a strong confirmation signal.
Keep an eye on RSI and MACD on your platform — if bullish divergence continues, it could fuel a sustained breakout.
💬 Summary:
> “PENGU is no longer hibernating — the breakout from a long-term falling wedge pattern signals the beginning of a new trend. With a confirmed breakout, solid support at Fibonacci levels, and clearly defined targets ahead, PENGU/USDT could be setting up for a powerful bullish leg — but caution remains essential at support levels.”
📣 Join the Momentum Early!
If the bullish scenario plays out, this could be a high-reward setup — but always manage your risk!
#PENGU #AltcoinSeason #CryptoBreakout #FallingWedge #BullishCrypto #CryptoTA #TradingViewAnalysis #USDT #AltcoinAlert #ChartPattern #TechnicalBreakout
