BITCOIN - Price can continue to move up inside wedge patternHi guys, this is my overview for BTCUSDT, feel free to check it and write your feedback in comments👊
A few moments ago, the price declined to support level, after which at once bounced up to resistance area.
Then BTC started to decline inside pennant, where it quickly declined from resistance area to support area.
After this, price bounced from the pennant's support line, broke the $94200 level, and exited from the pennant pattern.
Next, price rose to $102700 points and made a correction move to $90800 points, after which started to grow in wedge.
In wedge, BTC rose to $106500 level and even rose higher, reaching a new ATH and then fell back.
Now I expect that Bitcoin can correct to support line of wedge and then rise to $112K, breaking resistance level.
If this post is useful to you, you can support me with like/boost and advice in comments❤️
Pennant

POLYX Buy Signal Given!Trading Fam,
It’s been a bit slow recently so I thought I’d throw out a free alert just to keep you all in the game. We’re getting close to another run here soon. I know, it feels like I have been saying this for weeks. I have. Trading often involves extreme patience. In our case above, POLYX has given us not one but two green dots from my Dots and Blocks indicator inside the liquidity block. This gives me a special confidence that this coin is going to run soon. I would target that double-top at .435, take some off, and let the rest ride.
Best of luck. Hey, if you do enter this trade and make some cash, be sure to come back here and let me know in the comments. I love it when my followers find profits.
✌️Stew

HelenP. I Bitcoin can correct to support level and start to growHi folks today I'm prepared for you Bitcoin analytics. In this chart, the price declined to the trend line and then rebounded and started to grow inside the pennant, where it soon reached the support level. After this movement, the price broke this level, which coincided with the support zone and made a retest, after which continued to move up to the resistance level, which coincided with the resistance zone. Then BTC made the small correction, after which in a short time, it rose to the resistance zone and then made a correction movement to the 99500 support level. Next, the price made a strong impulse up to 109560 points (NEW ATH), breaking the resistance level, but soon turned around and dropped back to the trend line. Price some time traded near the trend line and then rose to the resistance zone, after which turned around and started to decline. In a short time, BTC fell to the trend line, broke it, thereby exiting from the pennant pattern also, and then continued to fall. At the moment, the price continues to decline and I expect that BTCUSDT will decline to the support level and then start to grow to the resistance level. For this level, I set my goal at 105800 level. If you like my analytics you may support me with your like/comment ❤️

XRP 4H PennantBullish Pennant formed on the 4H as a continuation pattern.
It can still break to the downside side but my bias is expecting the bullish continuation.
More likely for bullish continuation to occur due to pattern following an uptrend.

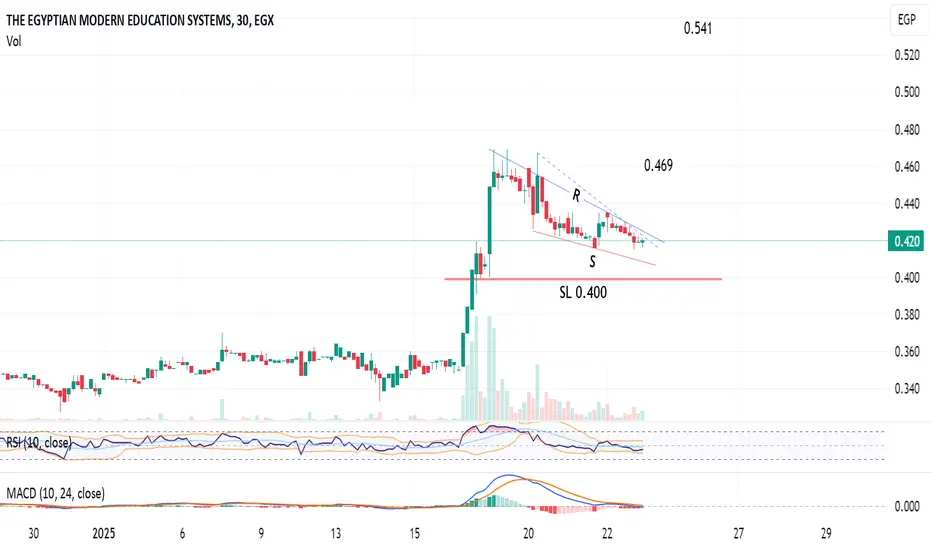
MOED Egypt has a potential for a breakout 0.469 / 0.520 / 0.54130-min chart
The stock EGX:MOED is trading in a falling wedge between R and S lines, and may form a bigger pennant pattern.
We need a confirmation, after closing 3 candles above 0.425, then the target will be 0.469
Above 0.470 for 3 candles, the next target will be 0.520 - extended to 0.541
Consider a near stop loss - and note the important support line at 0.400
Euro will exit from pennant pattern and rise to 1.0400 pointsHello traders, I want share with you my opinion about Euro. Looking at the chart, we can see how the price some time traded inside the range, where it declined to the resistance level, which coincided with the seller zone, and then dropped to the support line, breaking the 1.0460 level. Then price turned around and started to grow near the support line until it reached the resistance level, after which it turned around making an impulse down, breaking the support line, and entering to buyer zone. After this movement, the Euro bounced from the buyer zone and started to grow to the resistance level, but when the price almost rose to this level, it turned around and started to decline inside the pennant pattern. In the pennant, Euro declined to the support line, breaking the support level, after which rebounded and quickly rose to the resistance line of this pattern, breaking the support level one more time. And now, the price continues to trades near this line, so, for this case, I think that the Euro can correct to support line of pennant. Then it will start to grow and even can exit from the pennant, after which continue to move up next. Therefore I set my TP at 1.0400 points. Please share this idea with your friends and click Boost 🚀

ALGO looks to be setting up nicely for another spectacular move.Algorand is setting up nicely within the bull flag pattern it's currently trading in. Compared to many other coveted cryptos, ALGO's gains have been very reserved compared to its structure (maximum supply). I do believe that we are going to see ALGO outperform on the next leg, as it has some catching up to do, especially when compared to what it has done in past bull run cycles.
Good luck, and always use a stop loss!

TOTAL3 - ALT SEASON - Bull Swing CRYPTOCAP:TOTAL3 is ready for the Alt Season.
#Altcoins will be rockin' the boat in '25.
CRYPTOCAP:BTC.D is running out of steam, thus opening the door for #AltSeason to start.
The correction on MARKETSCOM:BITCOIN Dominance is the key to #Alts to shine.
1.13T MC has been touched, previous #ATH.
Now CRYPTOCAP:TOTAL3 is in a Wave 4 (#ElliottWave Triangle), with Wave 5 of the Larger Degree C Wave about to shoot.
Targets between the #Fibonacci Extensions 200-261.8%.
That's the 1.5T to 1.8T range.

Just a little further Bearish pennant on the 15m goes hand in hand with the c wave on the 15 that xrp has been following all day.
Expecting 2.80, potentially 2.40s butttttt I truly hope not because then things could get even worse.
But staying positive, we see $2.80 then buckle up to $3.65, $4.10, and beyond 🚀
I'll be taking profits again all the way from $3 and down. Trade active from $3.26, last took profit at $3.16.
Not financial advice do your own research. Be patient. We are making history!

Bitcoin can enter to seller zone and then start to declineHello traders, I want share with you my opinion about Bitcoin. Observing the chart, we can see how the price some time traded near the support level, which coincided with the buyer zone and then rebounded up, after which it started to trades inside the pennant. In pennant, price at once rebounded from the resistance line and dropped to the support line, but soon BTC turned around and made impulse up. Price rose back, after which made a correction to the buyer zone and then continued to grow. Later, BTC reached the resistance line of the pennant, breaking it, exiting from the pennant pattern, and soon breaking the resistance level, which coincided with the seller zone. Next, the price reached new ATH (108K) and then made impulse down inside the wedge, to support line, breaking the 96500 level. But soon, the price turned around and bounced up, so, after this BTC some time traded between support level until it later dropped to the support line of the wedge again and then started to grow. Bitcoin rose to the resistance line of the wedge, breaking the 96500 level, and then corrected the support line of the wedge, where it made a strong impulse up to the resistance level, thereby exiting from the wedge pattern. Now, I think that price can enter to seller zone and then start to decline. For this case, I set my TP at 101K points. Please share this idea with your friends and click Boost 🚀

2X back to ATH Bullish
Triangle breakout back to $3.5
Gold in triangle breakout
CRB in triangle breakout (Commodities Index)
no brainer!

4x Triangle breakout on Golds rising tide Bullish chart
Looks like multi year triangle break out my guess is upside
It could break out and stop at a fib target so guess round number is 80 at fib =1
I am tracking about 22% increase from here to gold base metal target so this is 4x of that move which seems a lot can it do that in 2025 or will we need a bit longer. I don't know, lets wait and see its a multi year chart so muli year target
Equites look over valued generally so this may be a safe haven in any bear market because it holds many tonnes of gold as per 1929-1935 when in relative terms you had price increase with dividends over 25x in bear or 50x to '35 or 74x incld divi by holding the gold mining stock at the time, plus FDR revalued the gold price. Logic is still the same it will be a bumpy ride as gold is sold to pay margin calls but overall there is a lot of money which will need to be parked. As fund mngrs see gold as a value stock because relatively to the equity index's its not going down as much.
Gold in triangle breakout
CRB in triangle breakout (Commodities Index)
other Gold related mining stocks look very bullish too so confirmation across multiple shares and base metal index plus commodities index too
Good luck to all and wishing you a mighty fine day!
If later when you read this and its obvious by then we are in a bear and you dont know what to do this is a safe play for value fund mangers
Yes they will sell gold to meet margin payments at first then they will start to hold Gold relatively and this company has a lot of gold in the ground which should act as a store of value. So its going to be a bumpy ride
With multi year charts its hard to pinpoint breaks and get the timing right but the idea should be solid enough. A good pension play during difficult times.
You may even get over performance and it shoots up to round number 100 ? too early to tell
Also there are very long 100 yr / 40 year charts showing gold made a break out. Silver is also a play.
This is a well known name, you need to check if they have hedged the price of gold, but the chart says triangle so break out up or down, we take the upside bullish breakout.

100% to ATH & huge flag and Tri target for over performanceBullish chart 100% on the table
I am tracking about 22% increase from here to gold base metal target so this is 5x of that move which seems a lot can it do that in 2025 or will we need a bit longer. I dont know, lets wait and see its a multi year chart so muli year target
Equites look over valued generally so this may be a safe haven in any bear market because it holds many tonnes of gold as per 1929-1935 when in relative terms you had price increase with dividends over 25x in bear or 50x to '35 or 74x incld divi by holding the gold mining stock at the time, plus FDR revalued the gold price. Logic is still the same it will be a bumpy ride as gold is sold to pay margin calls but overall there is a lot of money which will need to be parked. As fund mngrs see gold as a value stock because relatively to the equity index's its not going down as much.
100% back to ATH
higher flag target
higher triangle target
Gold in triangle breakout
CRB in triangle breakout (Commodities Index)

Constellation Network DAG Token - BREAKOUTSUsing traditional technical analysis, I've identified breakouts of a major multi-year consolidation, accumulation cylinder, and recent bull flag. All time highs should be achieved on hype once the US decides to list this token on exchanges, or if it is revealed by a major figurehead that the USAF and DoD are using this network to validate sensitive data.
The 200 week SMA is a target that needs to hold as support, around 0.083.
Elliot Waves - I believe a primary third wave began around 0.02 around Q4 2024 and that we're in an intermediate wave 3, or finishing corrective intermediate wave 2. I'm targeting 0.45 for this current wave structure, and also targeting on or around March 20th for a peak in euphoria.

SEARL Buy CallSEARL (PSX) has given a breakout from the pennant formation with decent volumes. Buy at mentioned price for a risk reward ratio of 2.22. Use trailing stop loss once it hits TP1. Enjoy Trading!

Euro can fall to buyer zone and then start to move upHello traders, I want share with you my opinion about Euro. By observing the chart, we can see that the price entered to pennant and started to decline. In this pattern, the price fell to the 1.0355 level and broke it, after which continued to decline to the buyer zone. In the buyer zone, the price reached the support line of the pennant and started to grow near this line, and later reached the resistance line. Soon Euro exited from the pennant pattern and rebounded up, higher than the 1.0355 resistance level, after which it made a small correction and then started to decline inside the downward channel. Inside this channel, the Euro broke the 1.0355 level one more time and fell to the support line, after which tried to reach the resistance line, but when it almost touched it, the EUR dropped to the buyer zone, breaking the 1.0250 support level. Next, the price fell to the support line, after which made a strong upward impulse, thereby exiting from the channel and breaking the 1.0250 level again. Euro some time traded near this level and then rose to the resistance level, after which started to decline. In my opinion, the Euro can fall to the buyer zone and then start to move up to the 1.0355 resistance level, where is locates my TP. Please share this idea with your friends and click Boost 🚀

Gold will little correct and then to continue grow in channelHello traders, I want share with you my opinion about Gold. The chart shows how the price entered to seller zone, where it reached the mirror line and then dropped to the buyer zone, breaking the 2710 level. After this, the price bounced up from the buyer zone but soon corrected back. Then Gold made a strong upward impulse to the seller zone, breaking the mirror line again. In the seller zone, the price started to decline inside the downward pennant, where it broke the 2710 level one more time and fell to the support line of this pattern, breaking the support level too. Gold some time traded below the support level and later it exited from the pennant pattern, reached this level, and broke it, after which continued to grow. When the price reached 2662 points, the price corrected the buyer zone and then started to grow inside the upward channel. In the channel, Gold rose to the resistance line and then corrected to the support line, after which continued to move up to the resistance level. Recently price reached this level and even try to break it, but failed. For this moment, I think that Gold can correct to support line of the channel and then rise to the resistance level back. After this, XAU can break this level and continue to move up inside the channel. For this case, I set my TP at 2740 points. Please share this idea with your friends and click Boost 🚀

Bullish Pennant forming on the daily Bitcoin chart $BTCWhile a lot of analyst see the bearish head-and-shoulders pattern forming, I can also see a possible Bullish Pennant forming in the daily Bitcoin chart. If it plays out the target is around $140,000.

XAU/USD BUY $$$
the zone is still valid just take LTF CONFIRMATION in it
FOLLOW ME FOR MORE DAILY ANALYSIS

WTL (Triangle Breakout Possibilities)WTL is currently moving in a pennant and likely to give a breakout for towards mentioned TPs. Small qty trade should be taken without any stoploss.

Bitcoin futures eye breakout from falling wedgeBitcoin futures are threatening to break out of the falling wedge established in early December, testing resistance during Asian trade.
With RSI (14) through its downtrend and MACD set to cross over from below imminently, momentum is swinging in favour of the bulls, bolster the case for upside.
If we see a clean downtrend break, longs could be established with a tight stop beneath for protection. Depending on the risk-reward sought, potential targets include the highs set in early January or record high of $108,945.
If the price is unable to break and hold above the downtrend, it would lessen the appeal of initiating longs.
Good luck!
DS

XRPETH chart heading to it’s next breakout targetI do think eth will be making decent gains here in the near future, but t looks like xrp will outpace those gains with its own gains based on the current chart pattern on the XRPETH chart. *not financial advice*

HBAR/USDT Breakout Alert: Ready for a 150%+ Pump!!🚀 Hey Traders! 👋
If this setup excites you, hit that 👍 and smash Follow for high-impact trade ideas that deliver real results! 💹🔥
HBAR: Gearing Up for Liftoff! 🚀
HBAR is looking 🔥 right now, breaking out of a bullish pennant-like structure. This could be the start of a massive 150–180% pump! Time to get in and ride the wave. 🌊
📈 Trade Plan:
Entry: CMP (Current Market Price) and add more up to $0.30
Targets: $0.42 / $0.54 / $0.68 / $0.90
Stop Loss: $0.275
Leverage: Keep it low (max 5x)
💡 What’s Your Take?
Do you see HBAR’s explosive potential here? Drop your analysis, strategies, or predictions in the comments below! Let’s conquer this market together and secure those profits! 💰🔥
