Pennant


#VOXEL/USDT Symmetrical Triangle Breakout Long Setup#VOXEL is breaking out of a symmetrical triangle, signaling potential bullish momentum. The entry is around $0.1983, with a stop loss at $0.1523 and a target of $0.3643, offering a favorable risk-to-reward ratio. Watch for volume confirmation to validate the breakout. This setup has the potential for a 2X move if the momentum sustains. Keep it on your radar!

Albemarle Stock Quote | Chart & Forecast SummaryKey Indicators On Trade Set Up In General
1. Push Set Up
2. Range Set up
3. Break & Retest Set Up
Notes On Session
# Albemarle Stock Quote
- Double Formation
* 146.00 USD | Completed Survey
* 012345 | Wave Count Entry Bias | Subdivision 1
- Triple Formation
* ((Pennant Structure)) | Downtrend Continuation | Subdivision 2
* Numbered Retracement | Short Set Up | Subdivision 3
* Daily Time Frame | Trend Settings Condition
Active Sessions On Relevant Range & Elemented Probabilities;
European Session(Upwards) - US-Session(Downwards) - Asian Session(Ranging)
Conclusion | Trade Plan Execution & Risk Management On Demand;
Overall Consensus | Sell

XRP/USDT Bullish Pennat Breakout LoadingXRP/USDT, Bullish Pennant Formation in Progress
The chart displays a Bullish Pennant, signaling potential upward momentum. However, the price is currently rejecting near the upper trendline, indicating that the breakout may take some time.
Key Insights
1. The pennant structure remains intact, but consolidation might continue before a decisive breakout.
2. Watch for a confirmed breakout above the upper trendline before considering a long trade.
3. Once the breakout occurs, the target range is $2.8 to $3.0.
Patience is crucial as the price may test the trendline support or consolidate further before breaking out.

$TSLA - Long entry after earningsI think NASDAQ:TSLA will shock many in the coming months. People who are too focused on short term performance are overlooking the long term price potential, I think weak hands will be shaken out tomorrow on the somewhat-likely earnings miss.
With that, I expect smart buyers might be able to get an excellent long entry in the $19X.XX price-range tomorrow following a bad print.
I like NASDAQ:TSLL as well, and I think that that will be where I allocate a significant position to.
In an exponential age, prices will go much higher than people realize. This thesis is invalidated with a significant break lower than $190. Plan accordingly!

Ada breaking up out of a Bull pennant.Target for the pennant hound be around $1.86 . I also noticed the.bitcoin dominance chart’s 200ma looks like its finally flipping back to resistance which if so will increase the probability of ADA hitting this pennant target as well as alt season finally officially starting. *not financial advice*

Trading opportunity for SHIBUSDTBased on technical factors there is a Buy position in :
📊 SHIBUSDT
🔵 Buy Now
🪫Stop loss 0.00002245
🔋Target 0.00002390
📏 R/R 2
💸RISK : 1%
We hope it is profitable for you ❤️
Please support our activity with your likes👍 and comments📝

EURO - Price can bounce up from support zone to $1.0430 pointsHi guys, this is my overview for EURUSD, feel free to check it and write your feedback in comments👊
A few days ago price traded inside flat, where it made a gap and then fell to $1.0470 level, after which started to grow.
Then Euro exited from flat and started to decline inside pennant, where it bounced from resistance line to $1.0470 level.
Price some time traded near this level and then broke it, after which fell to $1.0350 level and then started to grow.
In a short time, price rose to resistance line of pennant, after which bounced from it and fell to $1.0350 level.
Now, Euro traded near this level and I think that it can fall to support zone and some time trades inside.
After this, price can turn around and start to grow to $1.0430 resistance line of pennant.
If this post is useful to you, you can support me with like/boost and advice in comments❤️

XRP movement and rhythm originally figured for a smaller abcde triangle with upside resolution, however, zooming out makes it appear as tho maybe we have more time to eat up before the next leg up.
this is just a chart to track progress.
hypothesis: one more leg down, but a higher low, followed by new move up for new ATH sometime around january 29th 2025
two highlighted paths in white and red represent the bullish scenario
separate post may be warranted for bearish case

X to $35My trading plan is very simple.
I buy or sell when price tags the top or bottom of parallel channels.
I confirm when price hits Fibonacci levels.
So...
Here's why I'm picking this symbol to do the thing.
Price at bottom of channels (period 100 52 39)
Stochastic Momentum Index (SMI) at oversold level
VBSM is negative and at bottom of Bollinger Band
Price at or near 1.618 Fibonacci level
Entry at $30.50
Target is $35 or channel top

$AKT - +26% Today, Last Chance?For those that have been holding and staking AKT through the bear, I think the time is soon coming for sewing the rewards!
Here's one of my better posts about CSEMA:AKT , following the first FED Rate Cut:
We anticipated that there may be a flip to 'risk on' following that event, and those that positioned there have been reaping massive rewards, in any alt, let alone just AKT.
Going back further, I initially called out this bull pennant in September 2024:
Today, we're up 26% alone, and I think it is interesting that COINBASE:HNTUSD is not pumping in a similar fashion. Why might that be? Any ideas?
This might be the last chance to get cheap AKT, the decentralized AWS. NFADYOR YAKWTFIGO

Euro can exit from pennant and continue to fall nextHello traders, I want share with you my opinion about Euro. Looking at the chart, we can see how the price some time ago started to grow and soon broke resistance level, which coincided with the seller zone and continued to grow in range. Later EUR reached the top part of the range and then made a correction movement to the resistance level, after which rebounded and quickly rose back. Then price started to decline and in a short time fell to the 1.0475 level and even made a fake breakout of this level, after which backed up to the range. But soon, the price turned around and dropped to the current resistance level, thereby exiting from the range and breaking the 1.0475 level. Next, the price made an impulse up inside the downward pennant, but later it made a small correction. After this, EUR rose to the resistance line of the pennant and then turned around and dropped to the support line, breaking the 1.0350 level, which coincided with the resistance zone. A not long time ago price bounced from the support line, therefore I think that the Euro can reach the resistance zone and then continue to decline, even exiting from the pennant pattern. That's why I set my TP at 1.0240 points. Please share this idea with your friends and click Boost 🚀

AAVE, Break out and bullish move eminent? Aave looks like it's building momentum that could break out of the bull flag/pennant. A break out of this formation could lead to $175 move in fairly short deration.
The technical trade is the break out and a hold of the break out. If it were to fall back in the zone it is considered a fake out.
Either way you cut it, AAVE is good price here for long term growth.
Let me know what you think AAVE and this analysis down below.
Kind regards
WeAreSat0shi

OMNOM. SHIB Killer.Probable OMNOM bullish pennant formation chart implies an x187 up. Preliminary local growth could be 296% - to the resistance. Also, given valid of global ascending channel - bullish pennant breakout will coincide with a channel breakout on x10,000

$ETHUSD Bullpost - Another indicator points to $6.05kHey folks!
Adding to the bullish case for ETHUSD, we have spotted a clear Inverse Head and Shoulders (IHS) pattern on the weekly timeframe—a classic reversal signal with strong upside potential.
1MO Macro TA:
Key Levels to Watch:
Neckline Break: Price has already tested and is flirting with breakout confirmation.
Targets: If this plays out, the measured move aligns with the 6.4k–8k target zone highlighted previously.
Momentum is building across multiple timeframes. The long-term bullish structures (Cup & Handle, Bull Pennant) remain intact, and this new IHS setup strengthens the conviction for a breakout into price discovery.
2WK ETHBTC:
Stay sharp, watch volume, and manage risk. NFA DYOR.
VAMOS
Credit to @sumairk for initially bringing this to my attention.

Cup and Handle 600% upside potential.There is what looks like to me to be a Cup and Handle on DTST with massive upside potential if it plays out.
Price target for measured move about $32, short term target $6.

AI16Z Price Rockets 30% As Crypto Whales Invest $4 MillionThe cryptocurrency market has witnessed yet another explosive movement, this time from AI16Z, a groundbreaking AI-driven project. With a 30% price surge in the last 24 hours, AI16Z has set the stage for potential long-term bullish momentum.
Crypto Whale Activity Sparks Confidence
The recent surge in AI16Z’s price can be attributed to significant whale activity. Notable transactions include:
- Two whale wallets, “6ZFcxR…JkZV” and “HRQXKj…bVFr,” purchased 2.62 million tokens worth $4.34 million.
- Wallet “FU9b2c…fHyc” acquired 1.19 million tokens for $1.65 million.
- Wallet “B6FsUN…XzDV” purchased 869K tokens for $1.09 million.
- Wallet “AVLKwK…x1Mv” bought 998K tokens for $1.22 million.
These high-profile purchases reflect growing confidence in AI16Z’s potential, with whales positioning themselves for future gains as the project garners attention within the crypto and AI sectors.
Technical Analysis
AI16Z’s price action reveals a bullish flag pattern that triggered the recent 30% surge. However, this rally has faced short-term resistance, with the price currently up 0.26% and trading at $1.71. Here’s what the charts suggest:
- Support Levels:
- Immediate support at $1.33, aligning with the 61.8% Fibonacci retracement level.
- A potential dip to this level (an 18% correction) could create a buy opportunity for traders.
- Resistance Levels:
- Current resistance at $1.77, the recent high.
- A breakout above this level could push the price towards new highs, potentially targeting $2.00.
AI16Z’s Vision and Innovation
AI16Z is more than just a token; it represents a paradigm shift in AI-driven ventures. Here’s what sets it apart:
- AI Leadership: The project is led by AI agents, a pioneering move in the venture capital space.
- Ecosystem Development: AI16Z aims to connect AI entrepreneurs, investors, and experts, fostering innovation in a rapidly evolving sector.
- Future Plans: The introduction of a launchpad for AI-driven projects using the Eliza framework promises sustained value accrual. AI16Z is also poised to become the primary currency for agent-to-agent transactions, incentivizing developers and enhancing ecosystem utility.
Market Context and Performance
AI16Z’s current market dynamics highlight its growing prominence:
- Market Cap: $1.8 billion, ranking #201 on CoinMarketCap.
- Trading Volume: $256 million in the last 24 hours, signaling strong market activity.
- All-Time High: $1.771, achieved recently.
- All-Time Low: $0.002979, recorded two months ago, marking a 2,791.76% increase since then.
The broader crypto market’s focus on AI-related projects has bolstered AI16Z’s appeal, with analysts attributing its rally to advancements in AI technology and strategic whale accumulation.
Conclusion: What’s Next for AI16Z?
AI16Z’s recent surge underscores its potential as a leader in decentralized AI innovation. While a short-term correction to $1.33 could be on the horizon, the project’s robust fundamentals and whale-backed confidence suggest sustained upward momentum in the long run.
As AI technology continues to reshape industries, AI16Z is well-positioned to capitalize on this trend, making it a token to watch in 2024 and beyond. Traders and investors should keep an eye on key support and resistance levels, as well as upcoming developments in the project’s ecosystem.

EURUSDSave the idea! big pennant and small pennant plus 5 drive also confirm. hold sell from here in my opinion

LMWR/USD | Stock Quote | Chart & Forecast SummaryKey Indicators On Trade Set Up In General
1. Push Set Up
2. Range Set up
3. Break & Retest Set Up
Notes On Session
# LMWR/USD | Stock Quote
- Double Formation
* 012345 | Completed Survey | Subdivision 1
* (Neckline) | Configuration At 0.20700 USD
- Triple Formation
* ((Pennant Structure)) | Uptrend Bias | Subdivision 2
* Retracement Numbered | Share Out Condition | Subdivision 3
* Daily Time Frame | Trend Settings Perspective
Active Sessions On Relevant Range & Elemented Probabilities;
European Session(Upwards) - US-Session(Downwards) - Asian Session(Ranging)
Conclusion | Trade Plan Execution & Risk Management On Demand;
Overall Consensus | Buy

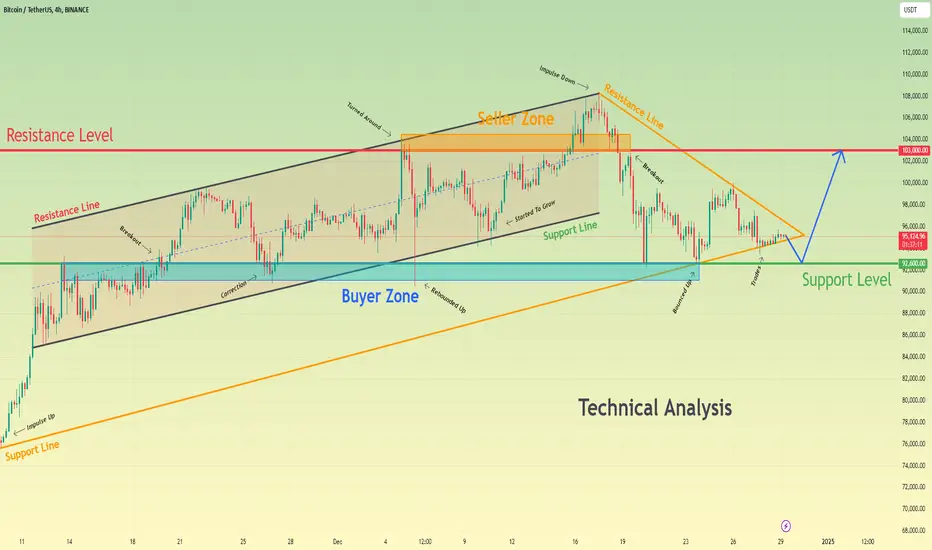
Bitcoin can exit from pennant and then start to grow to 103KHello traders, I want share with you my opinion about Bitcoin. Looking at the chart, we can see how the price started to trades inside the pennant, where it rebounded from the support line and rose almost to the support level, which coincided with the buyer zone. In the pennant pattern, BTC started to grow inside the upward channel, where it broke the 92600 level and then rose to the channel's resistance line, after which made a correction. Next, the price continued to grow and later rose to the resistance level, which coincided with the seller zone and then made a correction movement to the buyer zone. After this, the price continued to move up inside the channel, where it soon reached the 103000 resistance level and broke it. Next, BTC reached the channel's resistance line, which coincided with the resistance line of the pennant, and made a strong impulse down to the support line of the pennant, exiting from the channel and breaking the resistance level. After this movement, the price turned around and started to grow near the support line of the pennant and now I think that BTC can exit from the pennant and fall to the support level. Then it will turn around and start to grow to a 103000 resistance level, which is my TP. Please share this idea with your friends and click Boost 🚀
GOLD - Price can correct to support line and then bounce upHi guys, this is my overview for XAUUSD, feel free to check it and write your feedback in comments👊
A few days ago price entered to triangle, where it at once broke $2700 level and then fell to support line of this pattern.
Also, Gold broke $2595 level, but some time later it turned around from support line and soon broke $2595 level again.
Later Gold rose to resistance zone, after which made correction and then reached support line of triangle.
Then price made upward impulse, thereby exiting from triangle and breaking $2700 level, and started to trades in pennant.
In this pattern, price broke $2700 level one more time and declined to support level, after which rose to resistance line.
In my mind, Gold can fall to support line and then bounce up to $2660, exiting from pennant.
If this post is useful to you, you can support me with like/boost and advice in comments❤️

Ethereum Bullish Penant Reforming... Price Target 10-18kMacro log perspective on ETHUSD shows a massive bull pennant forming since April 20, 2017
Pole height: ~$400
Breakout around ~$350 (conservative)
Price target: $750
Major support: $300
Data From ptk921
Real Height: $1400
History is repating itself
Macro log perspective on ETHUSD shows a massive bull pennant forming since November 30, 2021
Pole height: ~$4800
Breakout around ~$3750 (conservative)
Price target: $10-18k
Major support: $3000
Realistic Height: $14000
The Fib Retracement Illustrates this perfectly.
Solid R:R Here
