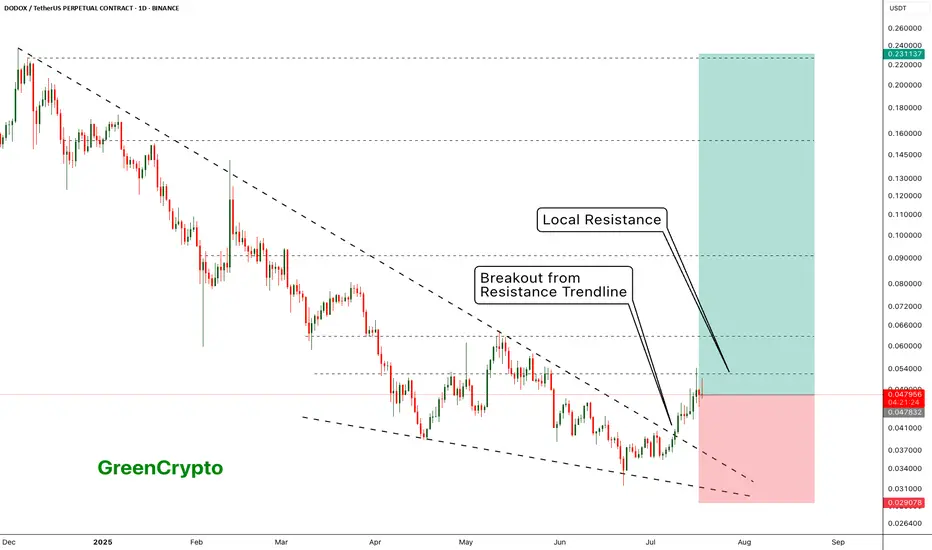
DODOX - Resistance is holding it back - Huge Potential- DODOX has successfully broken out from the resistance trendline
- Now its being pushed back back the weak local resistances
- I see a huge upward potential here.
Entry Price: 0.048271 ( Or you can wait for it breakout from the local resistance of 0.063051)
Stop Loss: 0.029078
TP1: 0.062621
TP2: 0.079766
TP3: 0.103243
TP4: 0.151853
TP5: 0.222332
Max Leverage 5x.
Don't forget to keep stoploss
Cheers!
GreenCrypto
Pennant
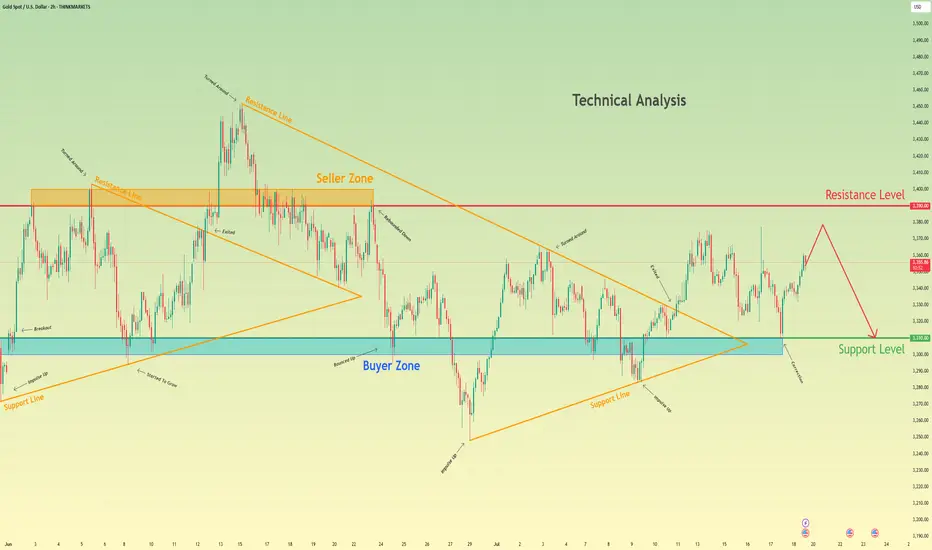
Gold may rise a little and then drop to support levelHello traders, I want share with you my opinion about Gold. Initially, gold was trading within a large consolidating pennant, showing both upward and downward impulses as it moved between the converging trend lines. The price eventually saw a breakout from this pattern, followed by a strong impulse up, but this momentum stalled as it approached the major horizontal resistance level at 3390. This level, which corresponds with the upper seller zone, has proven to be a significant barrier for buyers, rejecting the price and confirming a strong seller presence in that area. Currently, the market is in a corrective phase after being rejected from the highs. The price is drifting upwards once again in what appears to be a final retest of the aforementioned seller zone. This slow upward movement lacks the impulsive strength of the previous trend, suggesting that buyers are losing control and sellers are preparing to defend the 3390 resistance level once more. I expect this corrective move to fail upon reaching the seller zone around 3390. After this retest, I anticipate a sharp reversal and the beginning of a new downward trend. The logical target for this move is the major support level at 3310, an area that has historically acted as a strong buyer zone. That is why my TP is set at 3310. Please share this idea with your friends and click Boost 🚀
Disclaimer: As part of ThinkMarkets’ Influencer Program, I am sponsored to share and publish their charts in my analysis.
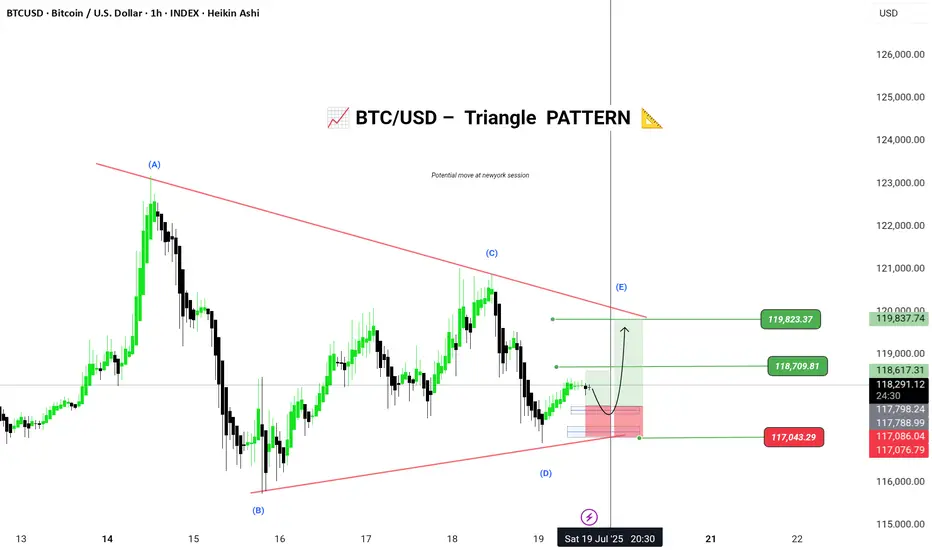
BTC/USD – Triangle Wave E Setup (Potential Bullish Breakout)Bitcoin is currently forming a contracting triangle (ABCDE) structure on the 1H chart. The market appears to be respecting the lower trendline support and could be completing Wave D, now preparing to push into Wave E.
🟢 Entry Zone: 117086 – 117076
🎯 Targets:
• 118709
• 119823
⛔ Stop Loss / Invalidation: Below 117043
🧩 Pattern: Elliott Wave Contracting Triangle
📅 Timeframe: 1H (Heikin Ashi)
📌 Chart by: @Greenfireforex
📌 Wait for a bullish confirmation candle above the support zone for a safe long setup. Triangle break could lead to momentum continuation toward the targets.
---
GBPJPY: Get Ready to Buy 🇬🇧🇯🇵
GBPJPY is consolidating within a narrow horizontal range
on a daily time frame.
I am waiting for its bullish breakout and a daily candle close above
199.85 to confirm the next bullish wave.
A rise will be expected to 201 level then.
❤️Please, support my work with like, thank you!❤️
I am part of Trade Nation's Influencer program and receive a monthly fee for using their TradingView charts in my analysis.

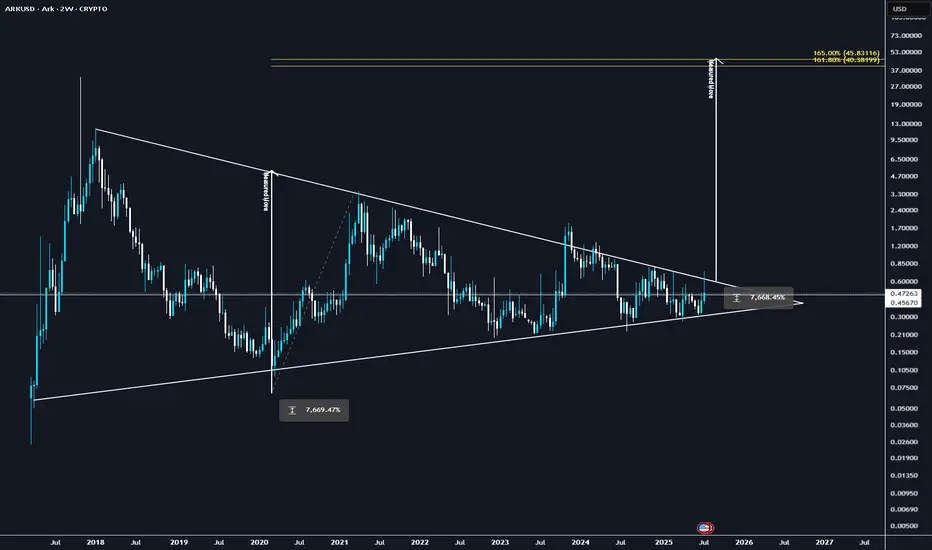
ARK: 100x in the makingMulti year compression, this is simply one of the best set ups in crypto today.
Heavy volume & sharp price moves
ARK didn’t just move—it ripped ~75% in one swing, with daily volume pushing $6–7M. Weekly upside is outpacing the market, classic sign of real demand coming in.
ARK’s more than a meme—it’s built on Delegated Proof of Stake (DPoS), with forging delegates, fast blocks, and governance on-chain. Utility’s there to support a legit move if adoption increases.
Alt season is underway. ARK’s strength isn’t just tagging along—it’s showing independent bullish structure with real volume behind it.
ARK’s showing proper strength—strong volume, clean technical structure, ecosystem fundamentals, and broad altcoin momentum.
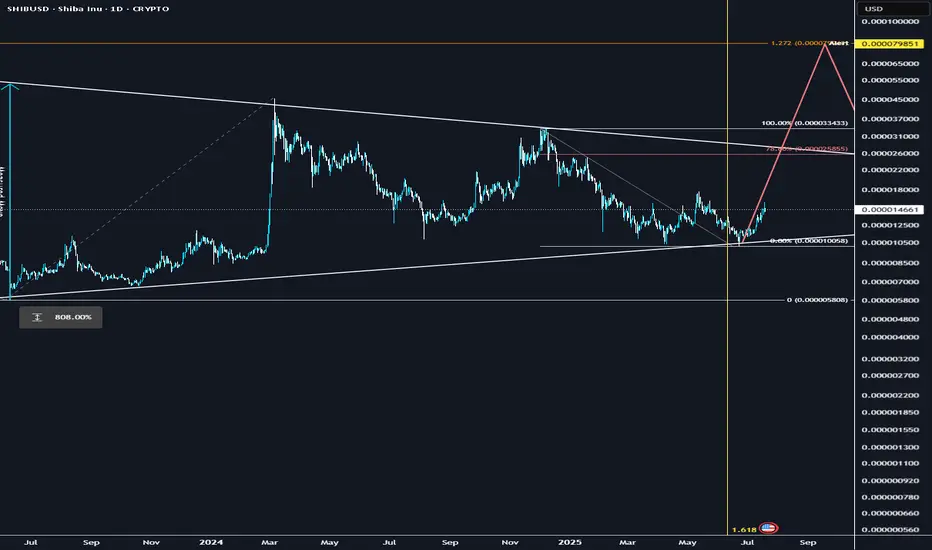
SHIB could explode soon.Multi year accumulation, crossing a significant fib-time pivot, similar set up to XRP.. could follow DOGE once it takes the lead as a catch up trade and rip..
Technical breakout: Above 200-day MA + golden cross formation
Volume surge: Social + trading volume spiking, driving demand
Ecosystem catalysts: Shibarium L2, metaverse progress, aggressive token burns cutting supply
Macro tailwinds: ETH rally + broad altcoin strength
I think it could be one of the leaders before capital rotates into the lower caps
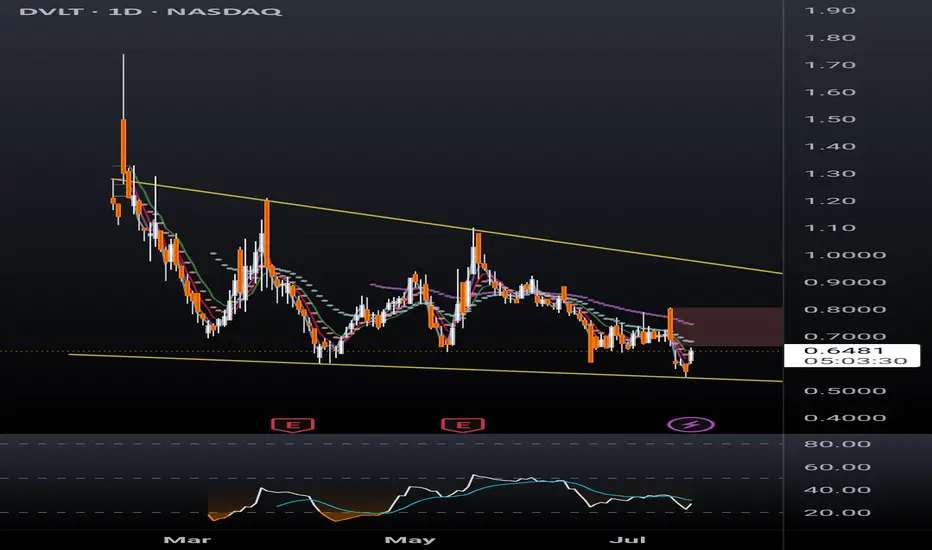
DVLT falling wedge, TP $1+DVLT a relatively new ticker is already drawing a lot of attention. Up 13% today after hitting new all time low yesterday, sure to catch a lot of eyes from retail investors. With recent news releases such as a licensing agreement with IBM, a lawsuit against naked short selling, and US patent allowances, target prices have been announced ranging from $3 to $11/share.
Disclaimer, this ticker is PRONE TO HEAVY DILUTION, however in order to remain listed on NASDAQ the SP will have to hit $1 and remain there. This being the case, the company must have something in the books to break upward out of this falling wedge and give shareholders a reason to stay with the company long term.
I'm just a cat not a financial advisor.
Be careful with RIPPLE !!!The pennant pattern has been broken, and the price follows an AB=CD pattern, targeting a rise above the 5 dollar.
Best regards CobraVanguard.💚

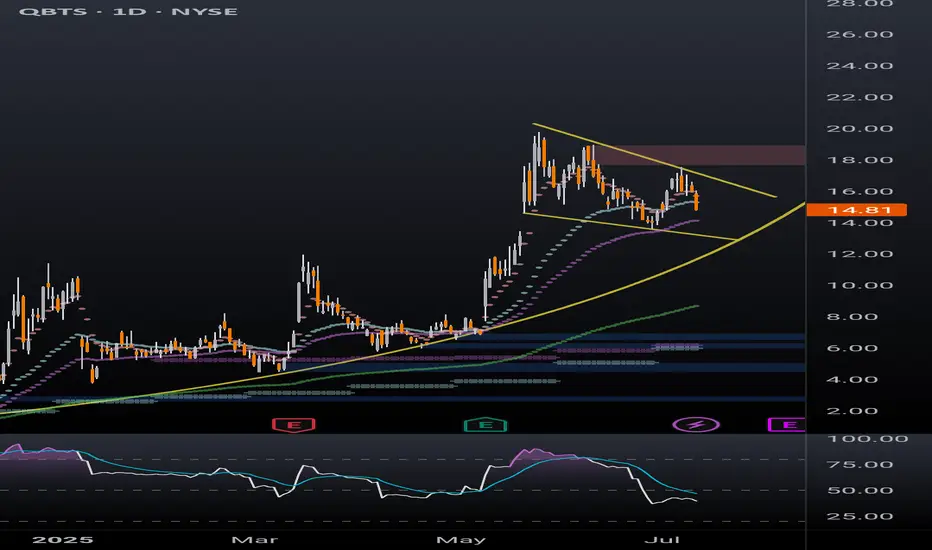
QBTS bull flag dailyBetter look at quantum computing ticker QBTS bull flag on the daily timeframe. Previous post looked at the weekly timeframe to highlight the bullish momentum. Lots of retail money piled into this one in the last few months, a breakout of this bull flag will likely be followed by a parabolic move.
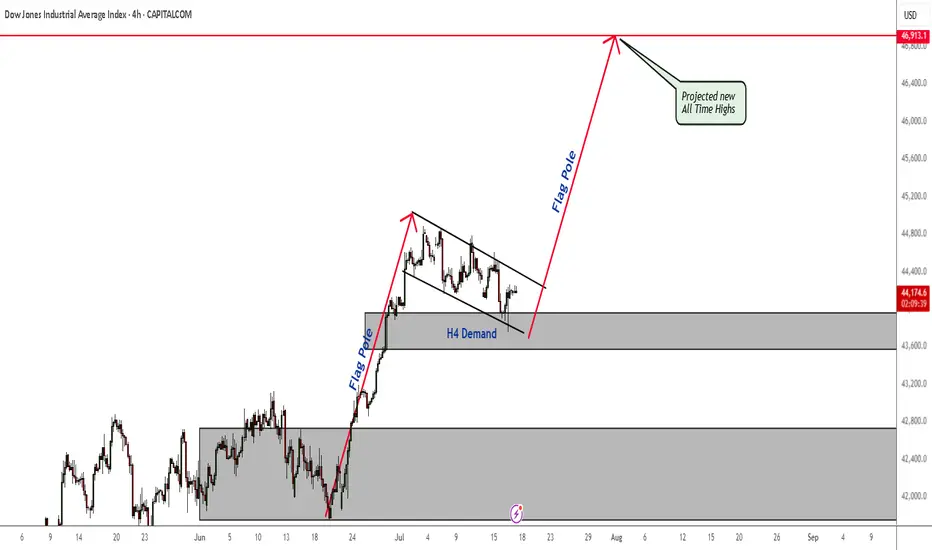
US30 Bullish Flag - All Time Highs The plan for Dow Jones has not changed. Price is still in an H4 demand zone. As soon as price breaks out of this bull flag, nothing will stop the bull run and new All Time Highs being claimed.
Don't miss it.
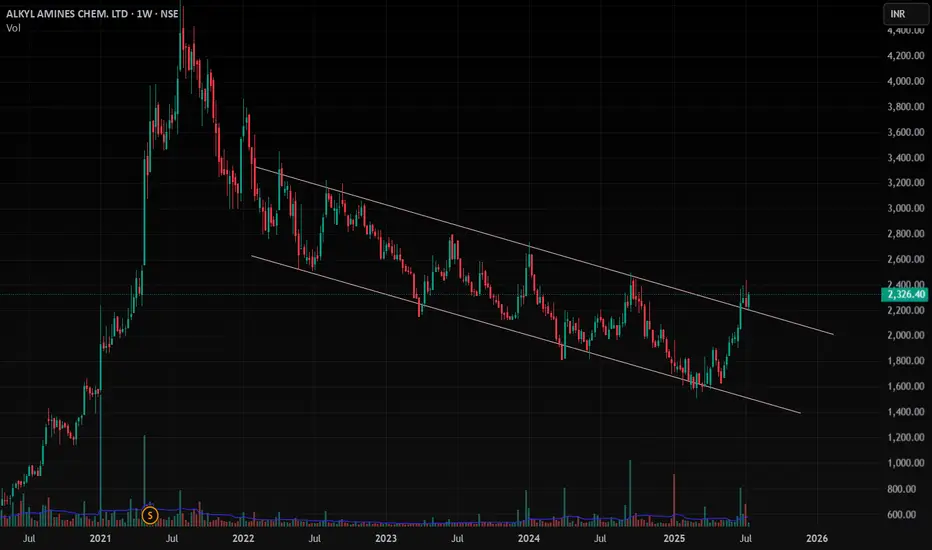
ALKYLAMINE , 1W , Bullishas this stock is given good breakout and now it is at Retest Point and You can enter with Good position Size with very minimal Risk
put the SL below the Swing Low . Take risk according to your position size
Follow for More Swing Ideas Like this
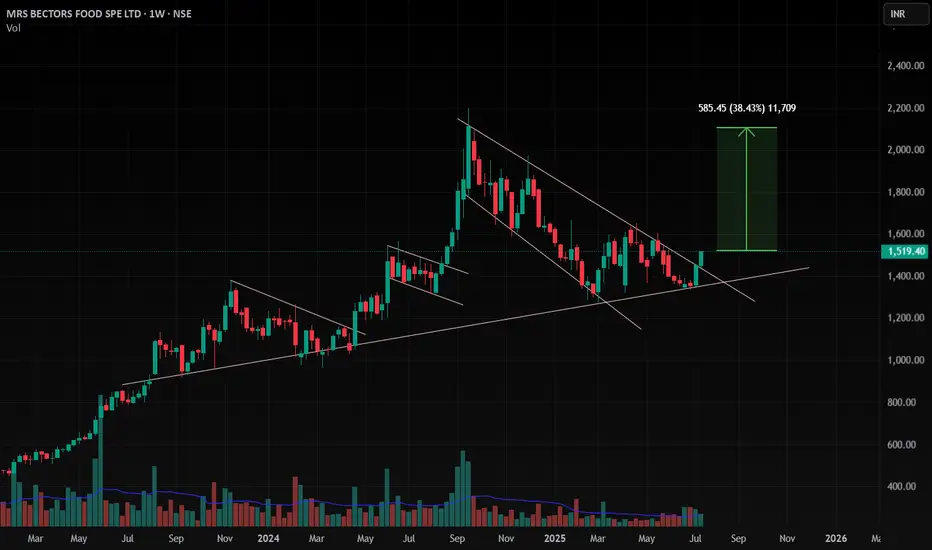
BECTORFOOD , 1W , Bullish As the trendline is giving support at below and formed a good pattern and given breakout with good close in weekly and daily .
This stock is ready to enter into this
Follow for more Ideas like this
Hbar breaking upwar from fallingwedge/pennantAlso in a smaller double bottom setup here. *not financial advice*

DPRO falling wedge breakoutDPRO has broken out of a falling wedge on the weekly. Ticker will respond well to Trump's "Big Beautiful Bill" which includes over $30 billion for defense/military spending. The drone company is already making progress with US military projects and is setting up for a strong rally.

HelenP I. Gold will continue to decline and break support levelHi folks today I'm prepared for you Gold analytics. After a prolonged period of consolidation, we can observe how price has formed a symmetrical pennant pattern. Price respected both the descending and ascending trend lines, bouncing several times from each side. Recently, gold tested the upper boundary of the pennant near the 3390 resistance level but failed to break through, confirming the strength of the resistance zone between 3390 and 3400 points. Following this rejection, the price started to decline and is now approaching the support level around 3305. If this support doesn’t hold, the price may drop further and break out of the pennant downward. In that case, the nearest significant target lies at 3280 points — near the lower trend line and previous reaction zones. Given the current structure, repeated rejection from resistance, and narrowing volatility inside the pattern, I expect XAUUSD to exit from the pennant and move down, breaking the support zone. That’s why I remain short-term bearish and set my goal at 3280 points. If you like my analytics you may support me with your like/comment.❤️
Disclaimer: As part of ThinkMarkets’ Influencer Program, I am sponsored to share and publish their charts in my analysis.

Euro may fall to support area and then start to growHello traders, I want share with you my opinion about Euro. The price previously moved inside a wedge formation, where it tested the buyer zone and showed a strong reaction from this area. After that, the pair broke out upward and started to trade inside an upward channel, building momentum and forming a clear bullish structure. Later, the price created a pennant pattern, often considered a continuation signal. But before continuing the upward trend, I expect the Euro to first exit from the pennant and decline toward the support area. This zone was previously resistantce, and now it may turn into a strong support. Now the price is trading near the pennant resistance, but I don’t expect a breakout right away. The market needs to correct before it resumes the uptrend. Once the price reaches the current support level or slightly lower, it may find demand again and bounce. That’s why I expect the Euro to retest the support zone and then grow further toward TP 1 - 1.1850 points. This target aligns with the upper border of the upward channel and would complete the continuation move after the pennant breakout. Given the previous structure, bullish momentum, and patterns on the chart, I remain bullish after the correction and expect the price to rise from the support zone. Please share this idea with your friends and click Boost 🚀
Disclaimer: As part of ThinkMarkets’ Influencer Program, I am sponsored to share and publish their charts in my analysis.

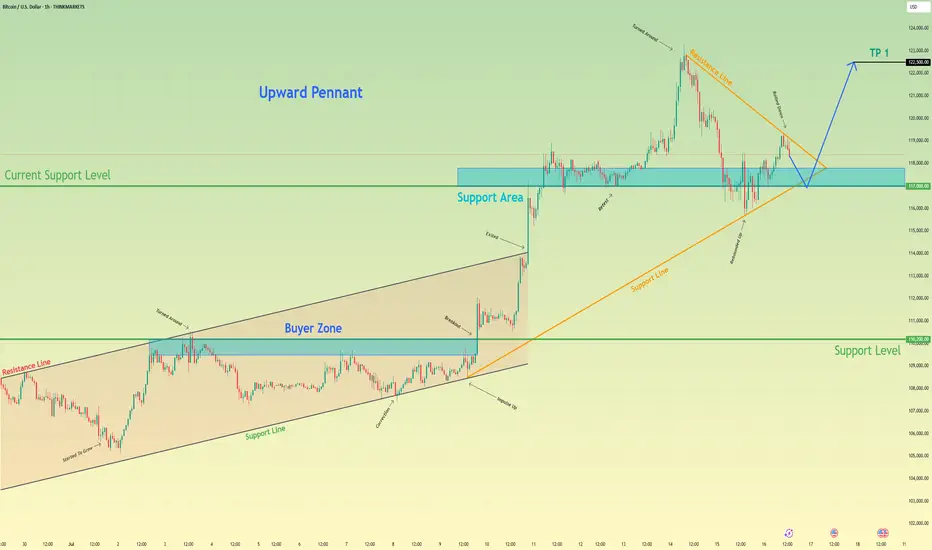
Bitcoin may exit of pennant and then rebound up of support areaHello traders, I want share with you my opinion about Bitcoin. Earlier, the price was moving inside an upward channel, respecting both the resistance and support boundaries. After reaching the buyer zone (110200–109500 points), BTC made a strong impulse up, breaking out of the channel and entering a new phase of growth. This breakout led to the formation of a bullish pennant, which often signals a continuation of the uptrend. Right now, the price is testing the support area between 117000 and 117800, which previously acted as a breakout zone and now serves as a current support level (117000). The structure shows that this level has already worked as a rebound zone multiple times. In my opinion, BTC may continue the correction toward this support area, potentially exiting the pennant to the downside for a short-term pull-back. After that, I expect a new upward movement, targeting the next local high. That’s why I set my TP at 122500 points, which is just below the recent ATH. Given the impulse move, strong support zone, breakout from the channel, and the bullish pennant pattern, I remain bullish and expect BTC to resume its upward trend soon. Please share this idea with your friends and click Boost 🚀
Disclaimer: As part of ThinkMarkets’ Influencer Program, I am sponsored to share and publish their charts in my analysis.
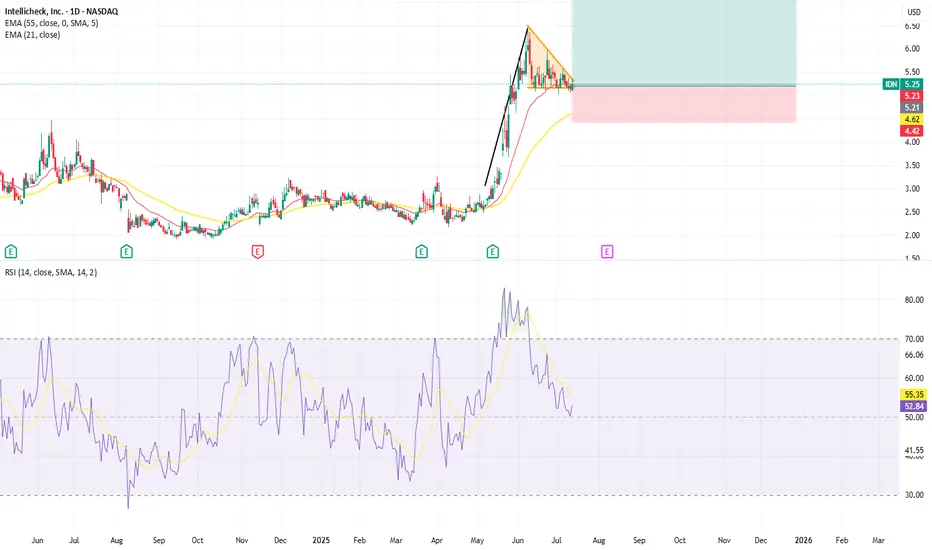
IDN Bullish Pennant FlagNASDAQ:IDN has had a huge run up in the last two month and a Bullish Pennant flag is starting to form with support at 5.16. Below this we saw some support at 4.80. Using a Stop Loss just below this level and a target set at the next resistance level established in 2022 yields a R:R of 1:3.5.
Sperax: Bullish pennant.Sperax is consolidating in a bullish pennant pattern after a strong recovery rally off the March lows. Price action has tightened between ascending support and descending resistance, forming a textbook continuation setup. Volume has decreased during this compression, which is often a precursor to explosive movement.
Fundamental Catalysts (Despite GENIUS Act Stalling):
Retail DeFi Narrative is Still Alive – While the GENIUS Act failed in the Senate, the momentum for regulatory clarity in the DeFi space continues. Future bills or executive actions could unlock capital flows to protocols like Sperax.
Deflationary Pressure —Over 13% of the total SPA supply has been burned, with more tokens locked and lost. The actual circulating supply is meaningfully lower than the total supply shown on aggregators.
SIP-70 has been passed , shifting SPA emissions from an automatic release model to a DAO-controlled emission schedule. This marks a significant milestone towards sustainable tokenomics and the preservation of long-term value.
Long-Term Accumulation – Wallet data and order books suggest that whales and long-term holders quietly accumulate during this sideways range.
Sperax remains a low-cap token with outsized potential in the next altseason if it secures even one meaningful partnership or fiat on-ramp.

SUI on its way to the teal pennants breakout targetSui has joined the bullishness here as it has brown up from the pennant and well on its way to the target. *not financial advice*

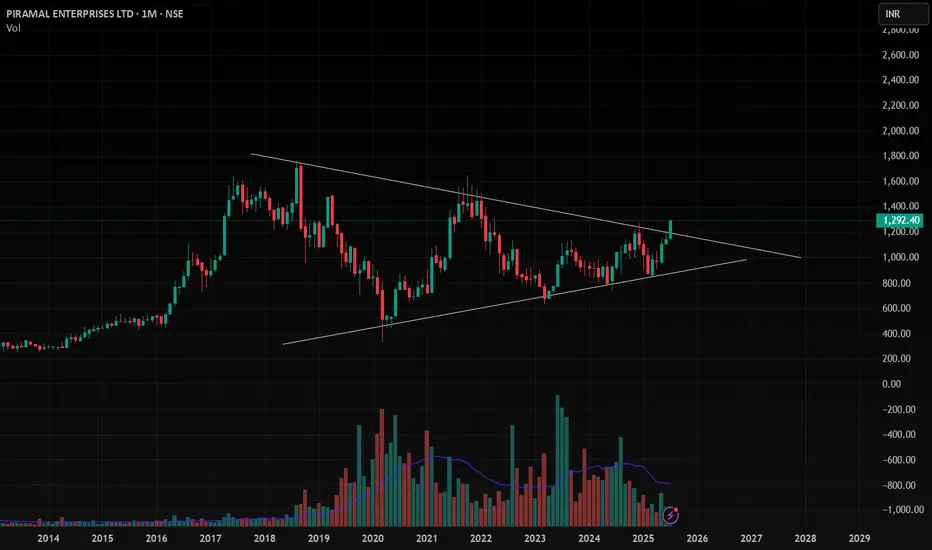
PEL , 1M , BullishThe Triangle Pattern is Breaking Out in Monthly Time Wait for Strong and Perfect close in Weekly Time and Enter after Confirmation .
Take Risk According to your capital
Follow for more ideas like this
EURO - Price will rise a little and then drop to $1.1500 pointsHi guys, this is my overview for EURUSD, feel free to check it and write your feedback in comments👊
Price earlier carved out a pennant pattern after a strong rally, with price oscillating between converging trendlines and indecision mounting near $1.1550 resistance.
After several weeks in consolidation, sellers finally broke down below the pennant base, sending price back toward the support area and trapping late buyers.
Buyers regrouped and launched a new advance, driving EUR into a well-defined rising channel.
During this channel run, two notable breakouts above interim highs were quickly followed by exits at the upper trendline.
Price now sits in a tight consolidation just under the rising channel’s ceiling near $1.1700, forming small corrective swings on lighter volume.
I expect one more shallow rally toward $1.1750 before sellers overwhelm buyers again, pushing Euro down through $1.1550 and toward the $1.1500 points.
If this post is useful to you, you can support me with like/boost and advice in comments❤️
Disclaimer: As part of ThinkMarkets’ Influencer Program, I am sponsored to share and publish their charts in my analysis.

XRP Breakout with Target at $4.80XRP just broke out of a typical complex wave 4 Elliott wave formation by completing the last 2D-candle. Consider taking profits in steps as wave 5 is often surprisingly short and disappointing. A $5–6 target is possible if bullish momentum persists, but monitor for early reversal signs.
