$FTM Bull Case - Multiple TargetsBINANCE:FTMUSDT is looking quite bullish, with a very clean chart and well respected Fibonacci retracement levels.
The support is sitting right at 61.8% of the last leg up. (Common reversal level)
I think the chart is open to multiple interpretations, each with a different target:
Descending Triangle : $1
Also a key psychological level and a previous resistance.
Bull Pennant : $1.15
Previous resistance and close to the top from last March.
Elliott Wave W3 : $1.3 or $1.62
If $0.76 is the local bottom, it would be a perfect Wave 2 end (61.8% of Wave 1).
According to Elliott Wave theory, the Wave 3 target would be either $1.3 (161.8% of W1) or $1.62 (261.8% of W1).
$1.3 is also a key support from 2021/2022.
$1.62 is also a resistance from 2022.
My strategy for this will be:
Open a long position after a break above the resistance trendline, with a wide SL
Take partial profits at each target
Starting from $1.15, move my SL up below the previous target
Not Financial Advice
Pennant

GOLD - Price can bounce up to $2380, leaving pennant paternHi guys, this is my overview for XAUUSD, feel free to check it and write your feedback in comments👊
Some days ago price bounced up to resistance level, which coincided with resistance area, and at once turned around.
Also, price started to decline inside falling channel, where it declined lower than $2315 level, breaking it.
But when Gold reached $2277 points, it turned around again and tried to rise, and some time later made upward impulse.
Gold finally broke support level, exited from falling channel, and continued to rise in pennant pattern.
In pennant, price made fake breakout of $2420 level, after which declined to support line, where continues to trades now.
In my mind, XAU can bounce up from support line, exit from pennant, and continue to rise to $2380
If this post is useful to you, you can support me with like/boost and advice in comments❤️

BTCUSDT1. Beautiful break of smaller Pennant on top of bigger Pennant on $BTC.
2. 1.618 Fib extension Target of this Swing high is $95,700 and a perfect Target for this move.
3. There will be significant profit taking by whales before psychological level of $100k.
4. Take profits!

JASMY: Potential Bullish Pennant Breakout!Hey everyone! If you enjoy this content, please consider giving it a thumbs up and following for more analysis.
JASMY is currently testing the top of a potential bull pennant pattern on the daily timeframe. A confirmed breakout could signal further bullish momentum. Buy some now and add more in the dip.
What to Watch For:
Confirmation of Breakout: A daily close above the resistance level of the pennant strengthens the bullish case.
Volume: Higher trading volume on the breakout can increase confidence in the signal.
Possible Entry & Targets (for educational purposes only):
Entry: $0.021-$0.024
Potential Targets: 300-400%
Stop-Loss: $0.018 (Consider setting a stop-loss based on your risk tolerance strategy)
Let's Discuss!
What are your thoughts on JASMY's current price action? Do you see a bullish pattern? Share your analysis in the comments below!

BNB: Potential Bull Pennant Breakout!Hey everyone! If you enjoy this content, please consider giving it a thumbs up and following for more analysis.
BNB recently completed a formation resembling a bull pennant pattern on the daily timeframe. The price has broken out of this pattern and is currently retesting the breakout zone. If it holds this retest level, it could signal further bullish momentum for BNB.
Buy some now and add more in the dip.
Entry range:- $560-$600
Targets:- $712/$834/$986/$1194
SL:- Daily close below $530
Let's Discuss!
What are your thoughts on BNB's current price action? Do you see a bullish pattern? Share your analysis in the comments below!

Bitcoin can rebound up from support line to 71000 level Hello traders, I want share with you my opinion about Bitcoin. By observing the chart, we can see that the price traded near the resistance level, which coincided with the seller zone and resistance line, after which rebounded down to the support level. When BTC fell to the 60200 level, it turned around and rose to the resistance line, but after the price reached this line, it rebounded and declined lower than the support level, which coincided with the buyer zone. But then the price entered an upward pennant and made an impulse from the support line, breaking the support level again and the resistance line. After this movement, BTC corrected move to support line of pennant, after which continued to grow. In a short time, Bitcoin reached a resistance level and even entered the seller zone, where it reached the resistance line of a pennant. But a not long time ago BTC turned around and declined lower than the 71000 level, breaking it again, after which in a short time rose to the resistance line of the pennant. Also, the price rebounded and started to decline, so, in my opinion, Bitcoin can decline to the support line and then rebound up to the resistance level, thereby exiting from the pennant pattern. Therefore I set my target at the 71000 resistance level. Please share this idea with your friends and click Boost 🚀

Elevated Aussie Inflation Places the Spotlight on AUD/USD ResistOvernight, Aussie inflation accelerated for a second successive month, according to the Monthly Consumer Price Index Indicator, rising +3.6% in the twelve months to April and surpassing the +3.4% median market estimate and the +3.5% print reported in March. This will be unwelcome news at the Reserve Bank of Australia (RBA) and highlights that we will unlikely see a rate cut this year.
The Australian Bureau of Statistics (ABS) noted that price increases were seen in housing (+4.9%), food and non-alcoholic beverages (3.8%) and alcohol and tobacco (+6.5%).
RBA: ‘Not Ruling Anything Out’
The previous RBA meeting saw the nine-member Board hold the Cash Rate at a 12-year peak of 4.35%; this follows a total of 425bps of tightening from May 2022 until November 2023. The central bank's overarching message at this meeting is that they are still ‘not ruling anything out’. The decision to hold rates unchanged followed Q1 inflation surpassing market estimates as well as the RBA’s forecasts.
Looking Ahead
The RBA meets next on 18 June, and given the latest inflation data, a rate adjustment from the central bank is very doubtful. In fact, according to the OIS curve, the chance of a rate cut unfolding this year is unlikely, with investors now pricing in a possible rate hike in September (around a 30% probability is priced in as of writing). This consequently triggered a short-term spike in the AUD versus its US counterpart to a high of $0.6666 before swiftly reclaiming pre-announcement levels.
Regarding where the AUD/USD stands, longer-term market action reveals buyers and sellers have been squaring off between two converging lines on the monthly chart, establishing what many technical analysts will view as a potential bearish pennant pattern drawn from $0.7158 and $0.6170. You will note that price is also challenging the upper boundary of the pennant formation, indicating possible resistance ahead. As a note, it is worth bearing in mind that although pennant patterns are considered continuation formations, they have been known to signal trend reversals upon failure of the pattern.
Another technical observation worth taking on board, of course, is that the Relative Strength Index (RSI) on the monthly chart has been exploring terrain south of the 50.00 centreline since early 2022, demonstrating negative momentum.

ADA Daily Chart Analysis - Long Target $0.62, Short Target $0.26NOT FINANCIAL ADVICE
TL;DR Bear Pennant / symmetrical triangle, No Trade Zone, wait for breakout. Long target is $0.62, short target is $0.26
BITGET:ADAUSDT has been trading in a symmetrical triangle (potential Bear Pennant) since April 13th. For me it's a No Trade Zone now, a breakout is needed to determine the direction of the next trend
Fairly respected fibonacci retracement levels highlight potential areas of interest
Disclaimer: The targets will change if a breakout does not happen soon, as they need to be measured starting from the breakout point
🟢 Bull Case
The target of a breakout from the resistance trendline 🟠 is $0.62, which is also where the breakout that led to the last leg down happened
Watch $0.58 (0.718 fib) as it is a previous key area and a High Volume Node which could offer some resistance
🔴 Bear Case
The Pennant target for a break below the support trendline 🔵 is $0.26, which is a previous key area and inverted 1.618 fib of the last leg down

WIF ANALYSIS🔴 #WIF Analysis : ❓❓
🔮There is a formation of "Bullish Pennant Pattern" in #WIF in daily time frame. We can expect around $4.2370 bullish move if the price perfectly retests the level📈📈
🔰 Current Price: $2.9700
🎯 Target Price: $4.2370
⚡️What to do ?
👀Keep an eye on #WIF price action. We can trade according to the chart and make some profits. ⚡️⚡️
#WIF #Cryptocurrency #Breakout #DYOR

HelenP. I Bitcoin can exit from pennant, and continue to riseHi folks today I'm prepared for you Bitcoin analytics. A not long time ago price declined to the trend line and then at once made impulse up to the support level, which coincided with the support zone. Soon, the price broke this level and made a retest, after which continued to move up to the resistance level inside the upward pennant. When BTC reached the 70500 level, the price broke it and rose to the resistance line of the pennant, but at once turned around and in a short time declined to the trend line, which is the support line of the pennant too, breaking the resistance level one more time. Next, the price some time traded near this line and then rebounded up to the resistance line of the pennant, which at the moment continues to trades near. So, for this reason, I expect that Bitcoin will continue to grow to a resistance level, thereby exiting from the pennant. Also then, I think BTC can break the resistance level, make retest, and continue to grow. So, I set two goals: 1st at the 70500 resistance level and 2nd at the 72500 points. If you like my analytics you may support me with your like/comment ❤️

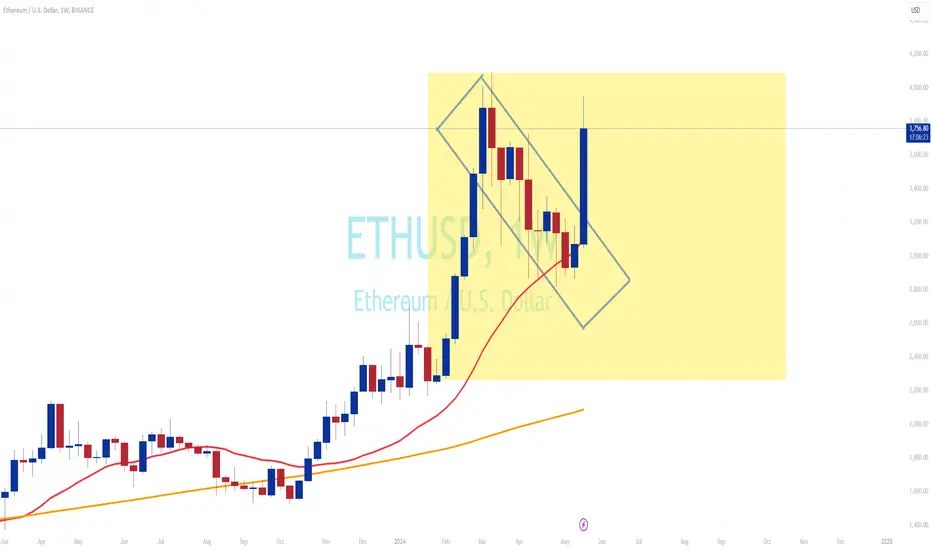
ETH flag breakoutafter retrace for 10 weeks, finally we see a bullish weekly candle on ETH, supported by 20 weeks MAs.
in this zone (in yellow) considered a FLAG formation . is a bullish continuation trend.
will see more upside once market break above $4000 mark.
AUDUSD 1D BEARISH PENNANT A BEARISH PENNANT has formed at the top of the AUDUSD bearish line. The BEARISH PENNANT made a lower high when it tested its upper ceiling 3 times. Opened short and target is 0.55141

BTC Long Target 74KFormations of the triangle are starting to reveal it's with the next long target being 74K

Pennant Pattern on HINDPETROHINDPETRO formed a Pennant pattern on daily chart. Multiple support and resistance levels were tested with aggressive buyers seen in the last swing before the breakout. Also there was a spike in volume on breakout day indicating strong buyers out there. Stop loss can be held just below the breakout candle with target the width of the broader triangle. Risk reward is ideal with 1:2.8
Hope you liked this idea, if so please boost this idea so others could benefit or leave a comment on what you think. I'll be glad to hear from you. Otherwise happy trading :-)

Pennant - EUHere I have EUR/USD on the 4 Hr Chart!
Price made a good push to the Upside surpassing the Highs earlier this month but then getting caught up by the Highs of April
Currently Price is bouncing back and forth between the Falling Resistance and Rising Support.
Potential False Break zones for both Resistance and Support are marked by the High and Low Points starting the pattern!
Pennants are patterns where the fight between Bears and Bulls is equal and eventually one will win out the other, this will be followed by a STRONG, CONVINCING Break of Pattern and Close to Validate the movement.
Fundamentally this week for both EUR and USD will be Flash Manufacturing & Services PMI being released Thursday!
As Indicators go:
-Above 200 EMA
-DSR Assist
-Above 50 RSI
-Super Nova Layout +3

JASMY ANALYSIS🔴 #JASMY Analysis : ❓❓
🔮There is a formation of "Bullish Pennant Pattern" in #JASMY in daily time frame. We can expect around $0.02750 bullish move if the price perfectly retests the level📈📈
🔰 Current Price: $0.02081
🎯 Target Price: $0.02750
⚡️What to do ?
👀Keep an eye on #JASMY price action. We can trade according to the chart and make some profits. ⚡️⚡️
#JASMY #Cryptocurrency #Breakout #DYOR

HelenP. I Euro will make small move up and then start to fallHi folks today I'm prepared for you Euro analytics. A few moments ago price broke the support level, which coincided with the support area and fell to the trend line. After this movement, it turned around and started to trades inside the upward pennant, which soon rose to the 1.0760 level. Also then, EUR broke this level, made a retest, and then continued to move up to support 1, which coincided with the resistance zone. When the price reached this level, it broke and rose higher even the resistance zone to the resistance line of the pennant. After this move, EURUSD made a correction a little below support 1, after which in a short time rose back to the resistance line of the pennant, but soon turned around and started to decline. In a short time, it fell to the trend line, which is the support line of the pennant, breaking the 1.0850 level. But recently Euro rebounded up and broke this level again and now it continues to trade inside the resistance zone in an upward pennant. For my mind, EURUSD will rise to the resistance line of pennant and then start to decline to the trend line, breaking the support level. So, for this case, I set my goal at 1.0830 points, which is located a little below the trend line. If you like my analytics you may support me with your like/comment ❤️

ZIM - Setting Up NicelyShipping stocks been in favour recently.
ZIM is setting up nicely, I would like it to rest for this week and early next week would love to a break on huge volume. It is being bought up on any down bars.
Might happen today as well so keenly monitoring this stock.

Gold can continue to decline to support levelHello traders, I want share with you my opinion about Gold. Observing the chart, we can see that the price some time ago declined to 2157 points, but at once turned around and started to grow inside the upward pennant, where it soon reached the 2280 support level, which coincided with the support area. Soon, Gold broke this level and continued to grow to the resistance line of the pennant, which coincided with the resistance level with the seller zone too, but at once rebounded, after reaching this line, and made a correction movement to support line of the pennant pattern. Next, the price exited from this pattern and fell almost to the support level, where it turned around and started to rise inside the upward channel. In this channel, in a short time rose to a resistance level, and even entered to seller zone, leaving the channel. But a not long time ago Gold turned around and made a strong downward move from the seller zone, making a fake breakout of 2430 level. Now, in my opinion, the price can continue to decline to the 2280 support level, therefore I set my target at this level. Please share this idea with your friends and click Boost 🚀

KPIGREEN : PENNANT FORMATIONNSE:KPIGREEN has recently experienced a significant bullish run, pushing its stock prices to new highs. Following this surge, the stock appears to be forming a classic pennant pattern, which is a continuation pattern often indicating that the prior trend will resume after a period of consolidation.
Breakout Potential: If NSE:KPIGREEN breaks above the upper trendline of the pennant with increased volume, it could signal the continuation of the bullish trend. Traders might look for a breakout above the resistance level as a buy signal.
Target Price: The height of the initial flagpole (the previous uptrend before consolidation) can be projected from the breakout point to estimate the potential upside target.
Stop Loss: To manage risk, consider placing a stop-loss order just below the lower trendline of the pennant. This helps protect against downside risk if the pattern fails and the price breaks below support. As always, proper risk management and due diligence are essential when trading pattern formations.

GOLD Wedge Pennant Break-out IncomeSee chart for analysis.
Options:
1) waiting for price to break falling wedge to the upside and catch the pullback.
2) if price breaks to the downside then consider looking for scalp shorts NOT swing shorts because how strong the metals market is.

Euro can rebound up to 1.0900 points, exiting from pennantHello traders, I want share with you my opinion about Euro. By observing the chart, we can see that some time ago price rebounded from the support level, which coincided with the buyer zone and declined to 1.0650 points. After this, the EUR turned around and started to trades inside an upward pennant, where it in a short time rebounded from the support line and rose to the 1.0725 level. Soon, the price broke this level and started to trades inside the range, where it at some time rose to the top part of the consolidation, but soon turned around and declined to support line of pennant. After this movement, the EUR made an impulse up to the current support level, which coincided with the support area, thereby exiting from the range. Also soon, the price broke this level and later reached the resistance line of the pennant, after which turned around and started to decline near this line to 1.0835 level. Now, it continues to trade near this level, so, in my opinion, the Euro can little decline and then rebound up, exiting from the pennant pattern. For this reason, I set my target at 1.0900 points. Please share this idea with your friends and click Boost 🚀

