Total Cryptocap’s log chart just hit the falling wedge targetIf we take the teal bull pennant and only measure the pennant part which is also a falling wedge, the target we get from the breakout has just been hit by our current price action. I felt that was worthy of posting a chart bout. Though bitcoin has already achieved a new all time high days ago, the entire market cap for all of crypto is still just below it’s previous all time high currently. I would expect that to change in the very near future, however there’s always a chance at a retracement once rice hits the full breakout target. Since we just hit the full breakout target of the teal falling wedge, then it could retrace, if it does it may take longer to reach a new all time high. ALso possible for it to pump just enough to reach a new all time high then start its retrcement, correction, or sideways consolidation. Either way we can see as I have stated in previous charts, that this falling wedge is also a very valid bullish pennant and the breakout target once you include the height of the pennants flagpole for your measured move line, Is a staggering 17.5 trillion or so…No guarantee we hit the full target this bull run, however the ay the bitcoin spot etf buying has kind of changed the paradigm of what’s possible there’s definitely a chance we could hit this full target for this current bull run. As I have stated in the past the dotted yellow measured move line to the left is a measured move target from a pennant we broke up from 2 bull cycles ago and it didnt hit its full target in that bull run. However since it is in a very close proximity to the price target of this teal pennant’s measured move breakout target as well, it creates a good bulllish confluence and we could see both targets hit this bull run. I would say worst case scenario we head to those targets by next bull run but very plausibly can reach them during this one. *not financial advice*
Pennant

Swiss Franc can exit from pennant and continue fall to 0.8700Hello traders, I want share with you my opinion about Swiss Franc. Looking at the chart, we can see how the price reached the resistance line of the downward channel, after which CHF rebounded down and declined to the support line of the channel, breaking the 0.8635 level, which coincided with the buyer zone. Then the price turned around and entered the pennant, where it made a strong impulse up to the resistance level, exiting from the downward channel and breaking the 0.8635 level one more time. After this CHF broke the 0.8820 level, which coincided with the seller zone, but soon it turned around and fell back and some time traded very close to the resistance level. Later, the price started to grow back and in a short time, CHF reached the 0.8820 level again, broke it, and rose to the resistance line of the pennant. But soon, the price rebounded from this line and declined to support line of the pennant, thereby breaking the 0.8820 resistance level again. After this, the price bounced from the support line and rose to the resistance line of the pennant, where, at the moment, CHF continues to trades near. In my opinion, the Swiss Franc can fall to the support line, after which it at once will bounce to the resistance line and then CHF can make an impulse down, thereby exiting from the pennant. For this case, I set my target at the 0.8700 level. Please share this idea with your friends and click Boost 🚀

MRCB Breakout From DT Line - Good Price to EntryThis undervalued construction and property player in Malaysia, MRCB has shown good performance recently. Pullback from the 52Wk high at 0.705, the price now stabilize around 0.56 to 0.59.
The intrinsic value for Malaysian Resources Corporation Berhad is RM9.91 based on Discounted Cash Flow Valuation, that is discounted 94.2% from current price.
Price now recently break from downtrendline (refer chart) and need to break MID BB (MA20) at daily timeframe to confirm the uptrend mood. My price target using fibo is at TP1 D: RM0.795, TP2 D: RM1.03
Hold for long term investment! cheers

How to Trade BLS InternationalBLS Intl, now at 343 on March-14-2024 :
2 ongoing patterns can be seen
#1. Per EW, the major Motive wave is completed and retracement is done closer to 0.382 and rising again, So, invest few now, invest until 256 for target of 604.5 in 1-1.5 yr holding period
#2. Per another ongoing pattern ( highlighted zone ), One can invest until 300 for a target of 604
As strict stoploss of 255
Expected Gains from curent price --> 76.2%
Prefer to invest regularly in this

VET: Fractal Patterns and OpportunitiesVeChain (VET) is a blockchain platform that aims to improve supply chain management and traceability. The VET/USDT trading pair has been exhibiting fractal patterns on the daily chart, which can be used to identify potential trading opportunities.
Fractal Analysis:
Repeating patterns: The VET/USDT chart has been forming a series of repeating patterns, such as triangles and flags. These patterns suggest that the price is likely to continue moving within a range until a breakout occurs.
Fibonacci retracement: Applying Fibonacci retracement to the previous bullish impulse wave shows that the 0.618 and 0.5 retracement levels are at $0.06 and $0.07, respectively. These levels could act as potential targets for a breakout.
Trading Opportunities:
Breakout trades: Traders can look for breakout opportunities above the resistance level of the current pattern. A breakout above $0.055 could signal a continuation of the bullish trend.
Retracement trades: After a breakout, traders can look for retracement opportunities to enter a trade in the direction of the breakout. The 0.618 and 0.5 Fibonacci retracement levels could be potential areas of support.
Artificial Intelligence (AI) Hype:
There is currently a lot of hype surrounding AI-related cryptocurrencies. VET has been associated with AI due to its partnership with IBM and its use cases in supply chain management. This hype could provide additional tailwinds for the VET price.
Conclusion:
VET/USDT is trading in a range on the daily chart, with repeating fractal patterns. Traders can look for breakout and retracement opportunities based on these patterns. The recent hype surrounding AI-related cryptocurrencies could also provide additional momentum for VET.

3 month log chart on btcThe green symmetrical triangle pattern that also doubles as a bull pennant here on the 3 month btcusd log chart gave us 100% exact precision on the measured move just from the triangle portion of the pattern. We can see the measured move from the triangle alone was the exact top of the recent bull market exactly. We can also see the correction we had the past year that most are considering a bear market did not even come close to retesting that green triangle and likely will not. That means the actual bull pennant that triangle is part of is still very much in play. When you attach the pole to the pennant you get a much much higher target. It may not fully reach this target for at least two more bull cycles but this target is still very much in play and it likely will reach $586k this decade. In the mean time we can see in yellow here a smaller pennant fractal that is most valid on the 1 week and 1 month charts. If it behaves similarly to the larger shape, then we should see the first significant correction of the current uptrend occur after reaching the measured move breakout of the wedge around 49-52k. Odds are good the correction even if steep will still result in a higher low and continue the macro uptrend at that point to the full measured breakout move of the yellow pennant somewhere around 148-150k. I think then we would probably see another bear season and it is after that bear season we would likely finally start heading to the full measured move breakout target of the larger green pennant in the 580-590k region. Of course for now the timing on all this is still heavy speculation but I thought it would be fun to post just to see how closely it follows my prediction. My guess is it can reach the highest price target on this chart before 2030, maybe even by 2028 or if we’re lucky even sooner. *not financial advice*


$INJUSDT Breakout and Retest Successfully done!!!The purpose of this setup is to provide an analysis that suggests if the current market conditions are bullish or bearish, potential entry and exit points, and to identify key levels of support and resistance that might influence future price movements. It is important for the community to know that such technical analysis is based on historical data and patterns, and it does not guarantee future price movements. All investments and trades come with risk, and one should only trade with money they can afford to lose.
Now we move to the analysis. What are my considered parameters for this trade?
Price Action: The setup shows the priceaction of Injective in a Daily TF. There has been a recent uptrend as indicated by the price being above the 50 EMA line, which is the green curved line on the chart.
Fibonacci Retracement Levels: The chart shows a clear bounce off the 0.618 level from the recent dump, which could be seen as a potential support level and which confirms as well the Fibonacci setup that we have for this Trade.
Bullish Pennant Pattern: The purple lines show an ascending trendline as support trendline and a descending trendline as a resistance trendline. These two formed a perfect Bullish Pennant Pattern, from where the price broke and retested recently with the recent dump that we had in the market.
All these points speak for a long trade here taking no more than a 200% TPR to reduce risk and not be greedy as well.
I will keep posting follow ups and updates on this trade. Good Luck

GTAI's situation+next targets and expected movements.Hi.
KUCOIN:GTAIUSDT
Today, I want to analyze GTAI for you in a 9H time frame so that we can have a SHORT-term view of GTAI regarding the technical analysis. (Please ✌️respectfully✌️share if you have a different opinion from me or other analysts).
We have a Bullish Structure here
GTAI formed a Bullish Pennant on 9h timeframe🤔
Up we go if we do breakout.
✅ Due to the Ascending structure of the chart...
- High potential areas are clear in the chart.
- Bullish Pennant
-AB=CD
Stay awesome my friends.
Previous Analysis :
_ _ _ _ _ _ _ _ _ _ _ _ _ _ _ _ _ _ _ _ _ _ _ _ _ _ _ _ _ _ _ _ _
✅Thank you, and for more ideas, hit ❤️Like❤️ and 🌟Follow🌟!
⚠️Things can change...
The markets are always changing and even with all these signals, the market changes tend to be strong and fast!!

ATOM / Bullish pennantWe have an ascending trend. There was accumulation with ABC movement inside the bullish pennant. The target of the formation has been marked.
There is a pool of liquidations up to the valuable level of 14,400, which is also likely to be reached.

Shiba Inu.... Tecnicall analysis After resting, Shiba can go up as much as it went up for some time, in fact, it can be said that Shiba has set an ascending flag, and it will go up to the length of the flag pole and hit its previous ceiling and go higher.

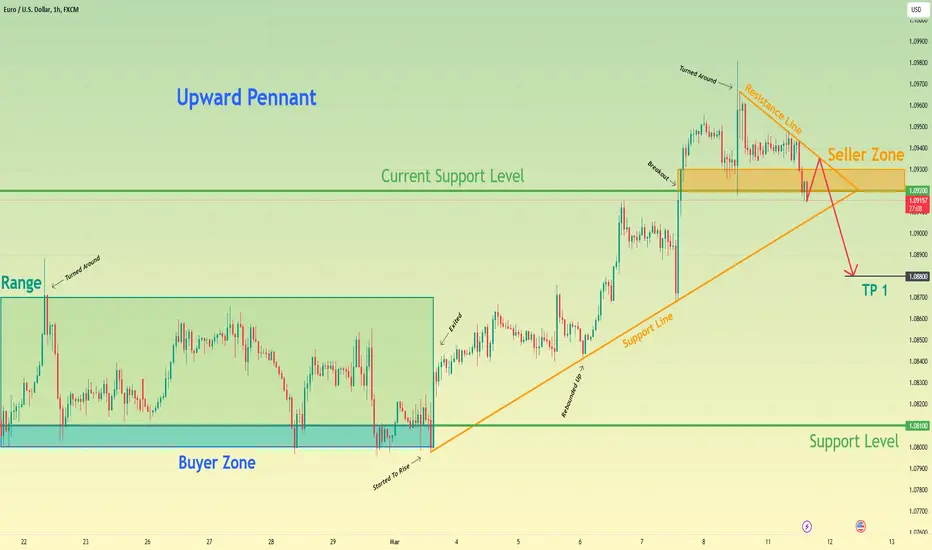
Euro can exit from pennant and decline to 1.0880Hello traders, I want share with you my opinion about Euro. Looking at the chart, we can see how the price some days ago started to trades in the range, where firstly it reached the top part, but then the price in a short time declined to the 1.0810 support level, which coincided with the buyer zone. After this, the price rebounded from this level and tried to back up, but failed and declined to the buyer zone and even lower, thereby exiting from the range and breaking the 1.0810 support level. Then Euro entered to upward pennant, where it at once rebounded from the support line and started to move up. In a short time price rose higher than the 1.0810 level, breaking it one more time, and later made a correction to support line of the pennant. Next, the EUR rebounded from this line and soon rose to the current support level, which coincided with the seller zone. Soon, the price broke this level and rose to the resistance line of the pennant, but a not long time ago it turned around and fell back to zone, where the Euro continues to trades very close to the 1.0920 level. I think that the Euro can bounce to the resistance line of the pennant, after which it turns around and rebounds down, thereby breaking the 1.0920 level and exiting from the pennant pattern. For this reason, I set my target at the 1.0880 level. Please share this idea with your friends and click Boost 🚀
$GROK breakoutAnother contender to be the memecoin of this cycle. Great looking chart: bullish pendant within a bull flag. And supposedly Elon Musk was talking about it, so could emulate $DOGE.

LINKUSD 📈 Long Idea ✔We observe similar patterns and high buy volume here. I do not take any other possibilities real 😁 Let's see what happens 💵💵💵
Good Luck!

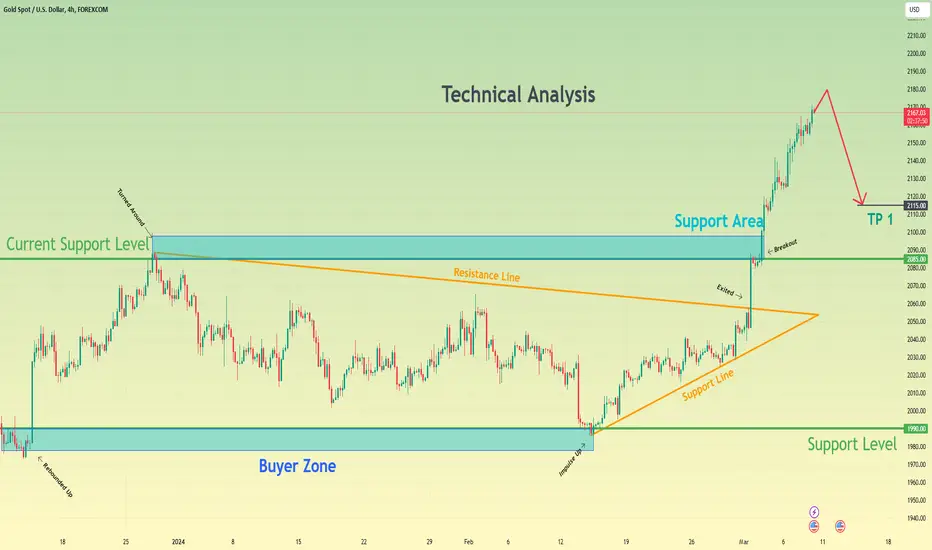
Gold can make little movement up and then fall to 2115 pointsHello traders, I want share with you my opinion about Gold. Looking at the chart, we can see how the price some days ago long time rebounded from the buyer zone, which coincided with the support level and rose to the 2085 level, thereby breaking the 1990 level. After this, Gold started to trades in a pennant, where it rebounded from the resistance line and in a short time declined to the buyer zone, which coincided with the support line of this pattern. Next, the price turned around and made a strong upward impulse from the support line to the 2085 level, thereby exiting from the pennant, and also soon, the price broke the 2085 level, which coincided with the support area. After this, Gold made retests and then continued to move up, and now the price trades higher than the support area. So, in my mind, Gold can make a little movement up, after which it will turn around and start to decline. Therefore I set my target at the 2115 level. Please share this idea with your friends and click Boost 🚀
Log channels of bitcoins entire history suggest serious upsideIm seeing confluence of last bull market cycles potential pennant target(yellow dotted line) and the current bitcoin cycle flag’s measured move line (purple target). Now I’m not suggesting that we will definitely reach this target level on the current bull market, as we have already seen this was a target from the pennant we broke up from during the last bull market and have already had a bear market since then before getting anywhere near the target, so there’s a solid chance we could see another bear market before finally reaching this target in the bull market after the current one. However considering the bitcoin etfs have led to such an exponential increase in institutional buying, there’s also still a decent probability that we could somehow hit this target during the current bull market. A safer bet is probably somewhere around 120-140k imo,then again if we have a massive correction here thats larger than the average 30-40% corrections we usually have during bull markets maybe that could help reset the health of the market to prolong it and allow it to reach higher heights.Hard to say. Either way I wanted to post a copy of this idea while I have it charted so I can look back it later to see how price action responds to these channel trendlines once it reaches them. If somehow e do reach the full target of the current bullflag we are breaking up from we could see anywhere from 300-320k the dotted blue line I included is for if the previous bull pennants pole is actually the fully extended price impulse, if so i am almost certain it will take at least 1-3 more bull markets before we would reach the full dotted blue line. I also have a monthly char that shows key channels that connect the previous few bull and bear cycles tops and bottoms but not the entire history like this one does and those channels would only allow for about 140-150k top in 2025 if we were to stay inside of them….if we broke out of them that’s when the targets shown here then start to become more of a reality in the current bull run. Until then I won’t expect anything above 140-160k and more realistically probably 120k range. Still worth posting this to eep a better eye on it. *not financial advice*

DOGE Opportunity ~ June 2023 call playing out like a dream DOGE / USD
Originally shared this back in June 2023 noting potential opportunity & now I'm in 250%+ profit
✅ Break out of pennant
✅ Above 21 month moving average (blue line)
✅ Almost out of 35 month decline/consolidation
Understand anyone longing Doge here with 3 - 6 month time horizon. I would be out of the trade as soon as the 21 month moving average is lost.
AS you can see from the below attached idea from June 2023...We got the timing on this one spot on. Thank god I picked up the allocation and forgot about it.
#doge CRYPTOCAP:DOGE

Petronet LNG breakoutPetronetLNG breaking out of 4 year long range/pennant consolidation.
Target - 410 / 600

Euro can exit from pennant and then rise to resistance levelHello traders, I want share with you my opinion about Euro. Observing the chart, we can see that the price a not long time ago declined from the resistance level, which coincided with the seller zone, but soon it turned around and rebounded higher than the 1.0890 level and even the seller zone. But then EUR started to decline and in a short time it fell below the 1.0890 level, breaking it one more time, to the 1.0800 level, which coincided with the support area. Then price bounced to the resistance level and made a downward impulse lower than the 1.0800 level, breaking it and also entering to range. In range, the price tried to back up, but failed and declined to bottom part of this pattern. After this, the price reached the support line of the pennant, and made a strong upward impulse higher than the 1.0800 level, breaking it again, and exiting from the range too. Later Euro reached the resistance line of the pennant, but at once turned around and declined to the support level. Also recently, the price bounced from the support level and now it trades near the resistance line of the pennant, therefore I think Euro can fall to the support line of the pennant and then make an impulse up to the resistance level, thereby exiting from this pattern. For this case, I set my target at the 1.0890 level. Please share this idea with your friends and click Boost 🚀

BITCOIN - Price can exit of pennant and continue grow to $68350Hi guys, this is my overview for BTCUSDT, feel free to check it and write your feedback in comments👊
A not long time ago price declined to the support area, which coincided with support level, and started to trades in this area.
After few time, BTC entered to pennant, where it at once bounced from support line and made strong upward impulse.
BTC broke $51800 level and soon reached $61300 level, which coincided with one more support area.
Soon, price broke this level and rose to resistance line of pennant, after which it corrected $51800 level.
Then price some time traded near this level and a not long time ago it bounced up to resistance line of pennant.
Now price I think Bitcoin can correct to support line and then bounce up to $68350, exiting from pennant.
If this post is useful to you, you can support me with like/boost and advice in comments❤️

BTCUSD: Penant Breakout ZoneFollowing closely on the heels of a Flag breakout, BTCUSD is ripe for another Penant Breakout.
BTCUSD (Daily)
Flag Breakout 1
Target 61170 (Done)
Pennant Breakout 2
Active above 64000 (Closing)
Target 71570 (Short Term)
SL 60500

BNBUSDT - Price can leave pennant and rise to $430 pointsHi guys, this is my overview for BNBUSDT, feel free to check it and write your feedback in comments👊
Recently price trades near support level, but later it declined to support area, where BNb entered to pennant.
Then price made strong upward impulse from support line of pennant to $387 points, thereby breaking $350 level.
BNB made little correction and then continued to grow to next support level, which coincided with one more support area.
Later, price broke this level too and rose to resistance line of pennant, but in a short time later it declined to support line.
Soon BNB bounced of support line and rose back to resistance line, breaking $405 level, where continues trades near.
Now, I think Binance Coin can fall to support level and then bounce up to $430, exiting from pennant.
If this post is useful to you, you can support me with like/boost and advice in comments❤️

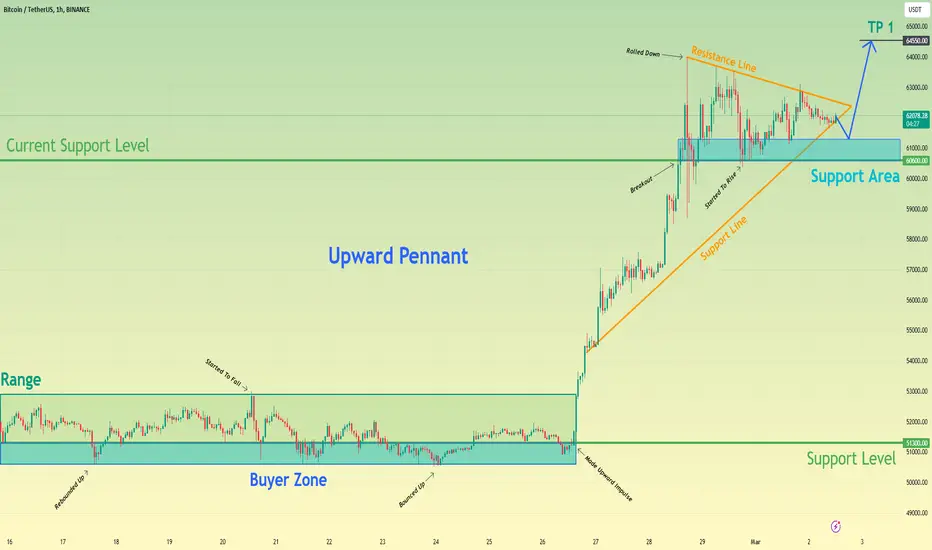
Bitcoin can exit from pennant, make correction and continue growHello traders, I want share with you my opinion about Bitcoin. Looking at the chart, we can see how the price some days ago started to trades in the range, where it at once declined to the buyer zone, which coincided with the 51300 support level, but soon it rebounded back. Later BTC reached the top part of the range and then turned around and in a short time declined back to the buyer zone, where the price some time traded. After this, it bounced up from this zone and few time traded near the support level, after which BTC fell back to the buyer zone and soon made a strong upward impulse to 54800 points, thereby breaking the 51300 level one more time and exiting from the range. Next, the price started to rise in an upward pennant, where it soon reached the 60600 current support level, which coincided with the support area and later broke this level. Then BTC rose to the resistance line of the pennant, but after this it turned around and in a short time declined to support area. After this price bounced up to the resistance line of the pennant back, where it at the moment continues to trades near. In my mind, Bitcoin can fall to the support area, thereby exiting from the pennant and then it will start to grow. So, that's why I set my target at the 64550 level. Please share this idea with your friends and click Boost 🚀