Buy GBPNZD Bullish PennantThe GBP/NZD pair on the M30 timeframe presents a potential buying opportunity due to the presence of a well-defined bullish pennant pattern. This pattern often suggests a continuation of an uptrend, potentially leading to further advances in the coming minutes or hours.
Key Point s:
Recent Price Action: The recent price action shows the price holding above the support line of the pennant, indicating continued bullish momentum.
Buy Entry: Consider entering a long position around the current price of 2.0740, positioned near the support line of the pennant. This offers an entry point close to potential buying pressure.
Target Levels: Initial bullish targets lie at the following levels:
2.0900: This represents the height of the pennant, measured from the top to the bottom of the pennant, projected upwards from the breakout point.
2.1000: This is achieved by adding the height of the pennant to the breakout point (which coincides with the support line in this case). These targets act as potential resistance zones that could see buying pressure.
Stop-Loss: To manage risk, place a stop-loss order below the broken resistance line of the pennant, ideally around 2.0660. This helps limit potential losses if the price breaks down and invalidates the bullish pattern.
Thank you
Pennantbreakout

Watching to see if we break the up side of a long term triangleNASDAQ:EA The daily chart shows a pennant forming, which has been broken by closing above the top of the pennant @ $140.
In the weekly view (shown here), there's a triangle pattern. Top of the triangle is ~$151 and was established in 2018 and tested in 2021. If the top of the triangle is tested and broken (closing above $151 for the week), then this has a lot of upside.
If $151 is tested and rejected, then we're heading back down to test the lower edge of the triangle.
Good Luck!

DDOG Ready to Make Another RunDDOG looking really attractive here. Came back down to test the support/resistance flip (blue area) and has been tightening in a pennant. Now resting on the 50 and 20 EMAs on the 65min. RSI right at 50 and looking to hold that and maintain strength.

Follow-Up Analysis on FSL: Confirmation of Pennant BreakoutBuilding upon the analysis conducted yesterday, it is observed that NSE:FSL stock has successfully experienced a breakout upside from the Pennant pattern. Today's price action has confirmed the Pennant pattern breakout, signaling a continuation of the prevailing uptrend. The breakout is characterized by a decisive move above the upper trendline of the Pennant, validating the technical analysis shared in the previous report.
Target Projection:
The target for this trade can be estimated by measuring the height of the pole formed before the Pennant pattern. The pole is the strong, vertical price movement that precedes the consolidation phase. To calculate the target, this measured distance is then added to the breakout point.
To protect against adverse price movements, a strict stop-loss order should be implemented. The stop-loss level is determined based on the characteristics of the Pennant pattern and should be placed just below the lower trendline of the pattern.

BALKRISIND - Pennant Breakout: A Promising Signal for Traders📝 In this educational technical analysis, I would like to discuss BALKRISIND. Understanding key technical terms and patterns, such as pennants and ascending triangles, can help new traders identify potential trade setups. Remember, I am not a SEBI registered analyst, and this analysis is solely for educational purposes.
BALKRISIND experienced a bull run from March 2020, starting at 650 INR and peaking at 2075 INR in September 2021. This move represents an impressive 314% increase.
After the bull run, a pennant pattern formed. Pennant patterns typically occur after a strong price movement and signify a brief consolidation before the trend resumes.
Pennant Breakout and Retest:
📈 On May 23, 2023, BALKRISIND witnessed a pennant breakout with good volume. However, what followed was an interesting development—a retest of the breakout level with strong volume. Retests are not commonly observed after pennant breakouts. Moreover, during this retest, an ascending triangle pattern formed on the 30-minute time frame, indicating a potential trend continuation.
🔎 Technical Term Explanation:
Pennant Pattern : A pennant pattern is a continuation pattern that occurs after a strong price movement. It is characterized by converging trendlines, resembling a small symmetrical triangle, and represents a temporary pause before the trend continues.
Ascending Triangle Pattern : An ascending triangle pattern is a bullish continuation pattern formed by a horizontal resistance line and an upward sloping support line. It suggests an ongoing uptrend and often leads to further price advances.
Potential Trade Opportunity:
🎯 Traders can plan their entry upon the breakout of the ascending triangle pattern, as it indicates a high probability of trend continuation to the upside. Monitoring the price action and volume closely during the breakout will help confirm the strength of the upward move.
Conclusion:
I appreciate your support and encourage you to like this analysis if you found it helpful. Feel free to share your observations and comments. Your feedback keeps me motivated to consistently provide valuable insights. If you want to stay updated with more technical analysis articles and trade setups, follow me on TradingView through the link: in.tradingview.com
💪 Remember, successful trading requires continuous learning and adapting to market conditions. As the saying goes, "The only way to do great work is to love what you do." Keep exploring and growing in the exciting world of trading! Happy trading! 📈💰

I Cannot Long This !!! situation+next targets.As you can see, the price increased a lot after breaking the pennant, but now it's time for the price to correct a little, and my target level is Fib 0.618=1.075.
🍻Hard for everyone but easy for me. thanks God...
_ _ _ _ _ _ _ _ _ _ _ _ _ _ _ _ _ _ _ _ _ _ _ _ _ _ _ _ _ _ _ _ _
✅Thank you, and for more ideas, hit ❤️Like❤️ and 🌟Follow🌟!

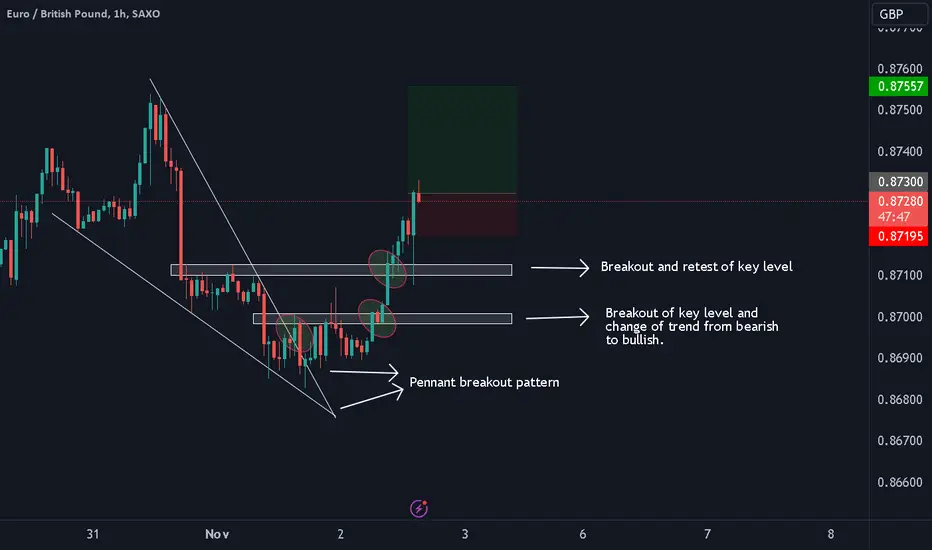
EURGBP Pennant Pattern Breakout We expect further upside on this pair, signalled by the breakout of the pennant pattern. We can also see the formation of a new high and a breakout of two key levels which further supports our directional basis.
Btc bullBtc forming a pennant pattern which is a bullish pattern. If the pattern breaks upwards then we could see btc to 35,000$+ .
.
.
.
.DYOR!!!

Pennant Pattern BreakoutThe stock has made a breakout with volumes of 10x and an increase an RSI from 48 to 57. Buy AB CAPITAL AT 122, TARGET 181

BNB next moveBNB making a pennant pattern which is bullish pattern. if the pattern breaks upward direction ,Then we can easily expect BNB to 300$ easily. Let's see what is going to happen. Weather it's breakout or breakdown of pattern occur.
.
.
.
.DYOR !!!

ONMOBILE: PENNANT FORMATIONNSE:ONMOBILE Is forming Pennant. The trade should be taken only after confirmation of pattern that is after closing of candle above pattern. Target and stoploss for the same are given

Solusdt bullish or bearish scenarios Solusdt forming a pennant pattern which is considered as bullish pattern as well as bearish pattern it's depends upon which side the pattern breaks upside or downside. Now we can see sol is sitting at good buying price (trend line support)in short timeframe with proper stoploss. Because there are 30-50% chances of breakdown. (Tight stoploss necessary) .
not a financial advice.
.
.
.DYOR!!!!!

Gold AnalysisMy Analysis on Gold:
1) Reach a monthly high
2) Retraced on a FIB ratio between 50% and 61.8%
3) Had a breakout from a bullish pennant and also made a retracement
NB: These confirms our bullish sentiment on Gold.
FOR ENTRY:
AN AGGRESSIVE TRADER can enter with a good candle pattern from a lower timeframe (1H, 4H) and volume confirmation.
A CONSERVATIVE TRADER Can wait for a breakout from the resistance zone with a high volume confirmation before entry in a lower timeframe (1H, 4H).

UBER Bullish Pennants for ContinuationUBER on the 15-minute chart this week has printed a small bullish pennant pattern
then continued into another larger print of the same pattern. The Price Volume
Trend Oscillator went red to green as the initiation of this trend over the past
two days. Trading volumes have pushed prices and are in the range of double the
moving average. The zero-lag MACD indicator shows a pattern of bullish
momentum in the mornings followed by fades at lunch and afternoons.
I believe that this 5-6% trend up has another 1-2 days to go before a profit-taking
session to close out the trading week.

🚀EURUSD finally broke the pennant! HUGE BUY OPPORTUNITY📈The bullish setup on EUR/USD is gaining momentum as price consolidates within a massive bullish pennant formation over the past three weeks. With the breakout now confirmed, a strong upward impulse is expected to continue the prevailing trend.
This presents an optimal entry opportunity to go long on the pair. Traders can set their sights on multiple take profit levels based on technical analysis: the first take profit target is set at 1.09750, followed by 1.10600, and the ultimate target is located at 1.11400.
Join the bullish ride and seize the potential for profits in this exciting setup! 🌟💹
Feel free to share your toughts in the comments section, follow me for updates and don't forget to press the like button if you think this insight was helpful 🚀💪

EURJPY POTENTIAL PROGRESS FORMATION IN PROGRESSWe can see that the pair has turned bullish after a short correction. We have also identified certain patterns which further
support our bullish basis. These have been listed below:
1: The pair is in a strong uptrend as the price is making new highs
2: Trendline breakout
3: Pennant pattern breakout
We will wait for the price to correct on the lower time frames after the trendline breakout then only can we start to look for
reasons to enter long. We do not take trades with less than 1 to 3 risk rewards. If we get stopped out , we follow our trading plan as
we wait for a new setup to form. We only take one entry per setup and do re-enter when stopped out as we see this as revenge/over-trading.

$XRP Bullish Pennant Breakout?Ripple CRYPTOCAP:XRP has been in the news again in regards to their ongoing court case with the SEC. Rumors of a positive verdict are circulating, which typically creates bullish sentiment for price action- but Ripple has been in this situation several times over this long litigation. So what does the chart say?
The white trend lines show a pennant formation on the daily time frame that has been in progress for over 2 months. One thing we teach our course takers is to pay attention to is how many attempts were made to break either trend line. With that in mind, the upper trend line has been touched many more times than the lower trend line, which could produce a bullish break out. But what does the TBO show?
The TBO stands for Trending Break-out, and is our favorite indicator for gauging the strength of a trend, as well as identifying when a break-out might happen next.
When we look at the TBO alone, we can clearly see that the trend is bullish since the lowest line, the TBO Slow Line, is angled up and moving up. TBO Resistance (the dotted green lines at the bottom of the chart) has moved up to 0.4157, which confirms that support has been moved higher- a bullish sign.
Things that make us concerned when we look at the TBO are the fact that the price of XRP is inside the TBO Cloud, similar to what the Ichimoku Cloud means in terms of confirming consolidation. While the TBO Fast Line is pink (confirming the previous TBO Open Short symbol on May 8th), which should be a bearish indication for the trend, the fact that XRP is currently above the TBO Fast Line is a good sign of a change from bearish sentiment to bullish sentiment.
The final thing we will leave you with are words of wisdom from long ago:
Buy the rumors and sell the news.
However, a break above this long-term white overhead trend line would be very big for XRP, allowing it to move up to 0.50 or higher very quickly.

VETUSDT is creating a pennantVETUSDT is currently forming a pennant pattern on the chart, which is a continuation pattern that typically occurs after a strong price move. The formation of a pennant pattern suggests that there is a potential for a continuation of the previous uptrend.
However, for the uptrend to continue, the price of VETUSDT needs to hold the support level at the 0.022$ area, where the price has already established liquidity. If the price breaks below this support level and retests it as new resistance, according to Plancton's Rules, new short positions may be considered.
–––––
Follow the Shrimp 🦐
Keep in mind.
🟣 Purple structure -> Monthly structure.
🔴 Red structure -> Weekly structure.
🔵 Blue structure -> Daily structure.
🟡 Yellow structure -> 4h structure.
⚫️ Black structure -> <= 1h structure.
Follow the Shrimp 🦐

ENJUSDT is creating a new pennantENJUSDT is showing signs of potential weakness. The market has created a pennant formation after a clear bearish move, indicating a temporary pause in the trend before a potential continuation in the direction of the prior move.
Currently, the market is in a consolidation phase after a clear bounce on the daily support. If the price creates a bullish impulse and retests the 0.46$ area and creates another bearish impulse, the target could be the 0.34$ area.
According to Plancton's Rules, if the price loses the 0.39$ area, a new short position may be possible. This is because the breakdown from the support level indicates that the bears have gained control, and there is potential for the price to continue moving lower.
–––––
Follow the Shrimp 🦐
Keep in mind.
🟣 Purple structure -> Monthly structure.
🔴 Red structure -> Weekly structure.
🔵 Blue structure -> Daily structure.
🟡 Yellow structure -> 4h structure.
⚫️ Black structure -> <= 1h structure.
Follow the Shrimp 🦐

BTC is about to close above the 25k, and the Houlry is bullishThe hourly for BTC looks bullish with this bullish pennant or wedge, or whatever you would like to call it.
The weekly overall is about to close above 25k. Bitcoin does NOT look bearish, it looks BULLISH.
I made a whole stream going over recent news, including my opinion of the 1 MILLION DOLLARS debt on bitcoin : www.tradingview.com

$STX - Bullish Pennant Breakout Entry$STX is in news after publication by LunarCrush. On Daily and Weekly it's showing a heavily bullish sign, this is 4h timeframe and it did a breakout from pennant which is ascending means forming HL but also LH.
I have kept two targets, first target is a resistance on Daily and second target is a Weekly resistance.
You can either enter if price comes back for a retest at breakout level or you can take entry at any level in between, but I technically believe that bullish momentum is strong and price might not come back for a retest.
Plan your trade and DYOR.

IOTAUSDT needs more Liquidity?IOTAUSDThad a false breakout from its daily resistance level and is currently consolidating below it.
The market is creating a pennant, which is a common technical chart pattern that can indicate a potential continuation or reversal of the current trend.
Traders who follow technical analysis may be watching for a breakout from the pennant pattern to signal the direction of the next price move. However, it is important to note that false breakouts can occur and may lead to significant losses if traders are not careful.
In addition, traders should also be aware of the potential for a false breakout on the previous support level. If the price breaks below the support level but quickly rebounds back above it, this could be a false breakout and may lead to further consolidation or a potential reversal of the current trend.
–––––
Follow the Shrimp 🦐
Keep in mind.
🟣 Purple structure -> Monthly structure.
🔴 Red structure -> Weekly structure.
🔵 Blue structure -> Daily structure.
🟡 Yellow structure -> 4h structure.
⚫️ Black structure -> <= 1h structure.
Follow the Shrimp 🦐

GRTUSDT is inside a PennantGRTUSDT is creating a pennant below the 4-hour resistance level, following a previous bull run.
A pennant is a technical chart pattern that is formed when the price moves within converging trendlines, forming a symmetrical triangle shape. The pattern is characterized by a sharp price move in either direction, followed by a consolidation phase where the price forms lower highs and higher lows. The pennant pattern typically indicates a continuation of the previous trend, which in this case was a bullish trend.
In this scenario, the market is consolidating after a strong bullish run, which could indicate that the market is gathering new liquidity. The previous support level at the 0.15$ area could act as a source of liquidity, as traders who missed the previous bull run may be looking to buy at a lower price.
To apply Plancton's Rules in this scenario, traders should wait for the breakout from the current resistance level to be confirmed before opening a new long position. This means waiting for the price to break through the upper trendline of the pennant and establish new support.
–––––
Follow the Shrimp 🦐
Keep in mind.
🟣 Purple structure -> Monthly structure.
🔴 Red structure -> Weekly structure.
🔵 Blue structure -> Daily structure.
🟡 Yellow structure -> 4h structure.
⚫️ Black structure -> <= 1h structure.
Follow the Shrimp 🦐
