XAUUSD 4H Trend Continuation Week of March 18th4h is creating a pennant indicating strong possibility of continuation.
All time highs currently so only possible resistance levels to go off of is the Fib levels.
-23.6=TP1
-50=TP2
-61.8=TP3
Price is rejecting the 50% 4h fib level.
Pennantpattern

Nasdaq 100 Daily PennantDaily pennant near psychological level 18000.
Expecting Bullish continuation for monthly time frame.
If Daily pennant breaks out for buys expecting it to shoot for 18500 then 18900 area.

Neutral - Watching Pennant/Triangle Consolidation PatternCisco is having trouble getting past the high from the tech bubble at the turn of the century. Keeping an eye on this chart pattern that has formed as it consolidates (may take several more years to play out). I won't short if it breaks down, but I'm watching for a potential upward breakout to trade on (looking for a decisive monthly close above the green tend line ideally with significant volume).

Bitcoin consolidating in a flat bullish triangle pennantIt's clear that with a massive overbought RSI on the daily and the 4h charts, Bitcoin's fate for the following weeks is to cool down and to consolidate, giving room to altcoins to start moving up. Is it the start of an alt season? I think so. Until the consolidation ends and bitcoin starts moving up again.

AMD Beautiful Consolidation into PennantAMD is consolidating really nicely after making new highs in late January. Surfing the 20 EMA on the daily chart as well. This will be a top focus for me heading into next week.

Follow-Up Analysis on FSL: Confirmation of Pennant BreakoutBuilding upon the analysis conducted yesterday, it is observed that NSE:FSL stock has successfully experienced a breakout upside from the Pennant pattern. Today's price action has confirmed the Pennant pattern breakout, signaling a continuation of the prevailing uptrend. The breakout is characterized by a decisive move above the upper trendline of the Pennant, validating the technical analysis shared in the previous report.
Target Projection:
The target for this trade can be estimated by measuring the height of the pole formed before the Pennant pattern. The pole is the strong, vertical price movement that precedes the consolidation phase. To calculate the target, this measured distance is then added to the breakout point.
To protect against adverse price movements, a strict stop-loss order should be implemented. The stop-loss level is determined based on the characteristics of the Pennant pattern and should be placed just below the lower trendline of the pattern.

FSL : PENNANT FORMATIONUptrend Observation:
The first notable aspect of NSE:FSL stock is the sustained uptrend it has displayed over a significant period. This bullish movement is characterized by higher highs and higher lows, indicating a strong buying interest in the market.
Identification of Pennant Pattern:
A Pennant is a technical analysis pattern that resembles a small symmetrical triangle, often forming after a strong price movement. The Pennant is typically considered a continuation pattern, suggesting that after a brief consolidation period, the prevailing uptrend is likely to resume.
Key Characteristics of a Pennant:
Symmetrical Triangle: The Pennant pattern is characterized by converging trendlines, forming a symmetrical triangle. This indicates a temporary balance between buyers and sellers.
Decreasing Volume:
During the formation of the Pennant, there is often a decline in trading volume. This reflects a contraction in market activity as the stock consolidates.
Duration:
Pennants are generally short-term patterns, with the consolidation phase lasting anywhere from a few days to a few weeks.
Traders and investors who recognize the Pennant pattern in NSE:FSL stock may consider implementing a trading strategy based on a breakout. The breakout occurs when the stock price breaches either the upper or lower trendline of the Pennant pattern.
Long Position: A trader might take a long position if the stock breaks out above the upper trendline, signifying a potential continuation of the uptrend.
Short Position: Conversely, a short position could be considered if the stock breaks below the lower trendline, suggesting a possible reversal or downtrend.
Regardless of the chosen direction, implementing a sound risk management strategy is crucial. Setting a stop-loss order just outside the boundaries of the Pennant pattern can help mitigate potential losses in case the breakout does not follow through as expected.

XRP Long Term Bullish OutlookCRYPTO:XRPUSD long term is very bullish.
I measured that we will hit the target profit $27 around early to mid 2025 based on the previous 1 year pole. You can see the formation of rally-consolidation-rally with a bullish pennant consolidation. RSI is looking good too, i'm certain it will close with a crossing but you can wait until december closing to make sure.
Also outside of technical analysis, xrp or ripple is very good fundamentally and narratively. The narrative of CBDC will be major if the world government implement this globally, i think it will be implemented in 2024 or 2025. It's best to buy XRP now.

🚧ADAUSDT is Bullish now🚧 & many Traders don't see it 👀!!!Hi every one
➡️ADA has done a Impressive Movement recently but the odds of another bullish Movement is Pretty high because the pattern which ADA is in, Is a Bullish Pennant Pattern! Since The break out has not happened, there is no confirmation of a Bullish Movement But If It happens, we Can Expect a Bullish Movement as much as the Measured Price movement (Pennant pole) to happen!
🟡Summery:
-ADA has been Bullish Recently!
-The odds of another Bullish Movement is High!
-Bullish Pennant is Visible on The chart!
-No break out yet!
🤑Stay awesome my friends.
_ _ _ _ _ _ _ _ _ _ _ _ _ _ _ _ _ _ _ _ _ _ _ _ _ _ _ _ _ _ _ _ _
✅Thank you, and for more ideas, hit ❤️Like❤️ and 🌟Follow🌟!
⚠️Things can change...
The markets are always changing and even with all these signals, the market changes tend to be strong and fast!!

Finnair: Pennant pattern on 1h chartFinnair has broken the 4h TL and 1h pennant pattern. For this reason I'm short term bullish. In case we break the most recent support zone, the pennant pattern has failed.

What is a Bearish Pennant Patterns?Imagine a rollercoaster: first, a steep drop (downtrend), then a brief pause (consolidation) before another drop.
💜 If you appreciate our charts, give us a quick 💜
This pause creates a symmetrical triangle of highs and lows, indicating market uncertainty. When prices break out below this triangle, it signals a likely continuation of the downtrend.
1️⃣ The Downward Journey:
A clear, steep downtrend sets the stage, indicating prices are likely to fall. Think of it as the initial dive on the rollercoaster.
2️⃣ The Pennant Pause:
Consolidation forms a triangle, showing market indecision. This is akin to the rollercoaster momentarily leveling out before the next plunge.
3️⃣ The Breakout Moment:
A swift breakout below the triangle confirms the downtrend. It's like the rollercoaster taking a sudden, sharp drop.
🚀 How to Ride the Bearish Pennant:
Step 1: Spotting the Pattern
Look for a well-defined downtrend followed by consolidation forming a triangle. The triangle's upper line is resistance; the lower one is support.
Step 2: Timing the Breakout
Be patient; wait for a rapid breakout below the triangle. High trading volume confirms the breakout's strength.
Step 3: Making Your Move
Enter a short position right after the breakout or when the breakout candle closes. This aligns your trade with the downtrend momentum.
Step 4: Planning Your Exit
Set a profit target based on your risk tolerance. Implement a stop loss above the breakout candle's highs to guard against false breakouts.
Pro Tips for Success:
✅ Stay in the Downtrend Lane:
Only trade bearish pennants within a downtrend. Avoid it during uptrends or sideways markets for optimal results.
✅ Don't Jump the Gun:
Wait for the breakout confirmation to avoid falling for false signals. Patience pays off!
✅ Volume: Your Secret Weapon:
Strong breakouts occur with high volume. More participation means stronger market conviction.
✅ Plan Your Exit:
Have a clear exit strategy. Acknowledge that breakouts might fail, and be ready to exit if the trade goes south.
Mastering the bearish pennant pattern requires a blend of technical expertise, patience, and disciplined execution. Think of it as your guide to mastering market dips and making strategic moves.
Happy trading!

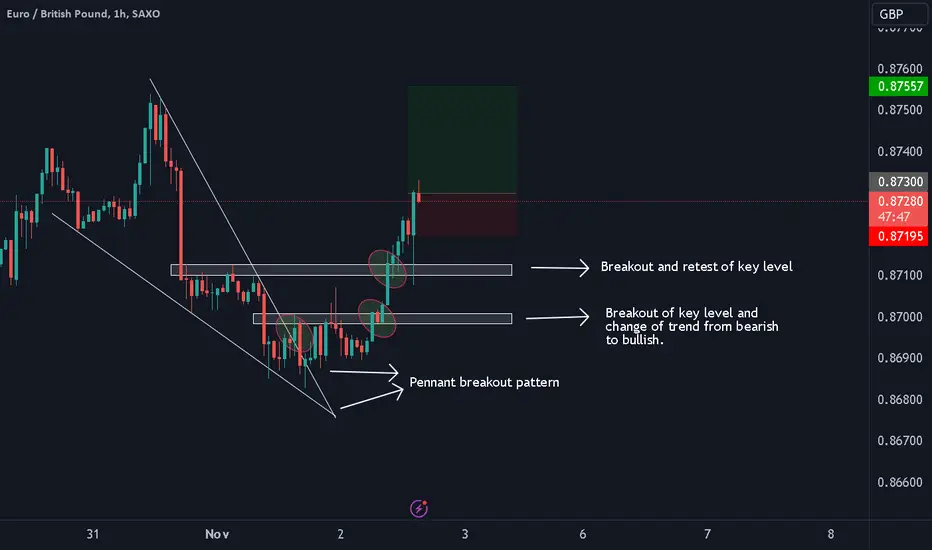
EURGBP Pennant Pattern Breakout We expect further upside on this pair, signalled by the breakout of the pennant pattern. We can also see the formation of a new high and a breakout of two key levels which further supports our directional basis.
Surfing the Waves of Shiba Inu's ConsolidationShiba Inu is currently undergoing a consolidation pattern that is approaching a descent to the 50% retracement line with an approximate $0.00000745 price target. This greets the support line of what may be a several week long symmetrical pennant and an opportunity for a short-term trade that garners notable profits.
Significant buy back at this level will most likely cause the asset to retrace back to the 78.6% Fibonacci level ($0.00000790). Significant resistance at this level will most likely result in a support touch at 61.8% ($0.00000763) before returning to a resistance range around $0.00000780. This completes the M pattern and places us several days from a potential breakout or breakdown around the second week of November.
With a total increase in value of +24.65% during this uptrend, a high volume breakout can take Shiba Inu's price to 0.00000927 while a high volume breakdown can diminish its value to 0.00000599.
COINBASE:SHIBUSD

GBPNZD - Triangle & Wedge Breakout TradeWe've got a triangle, wedge, pennant pattern forming here on the GBPNZD and in this video i want to show you how I use the anchored volume tool to project the levels that price is likely to go to once we breakout from the pattern.
If you have any questions or comments about the idea, or if you just want to share your own views, please leave it in the comment section below.
Akil

Bullish pennant still in playIf Bitcoin Successfully Breaks out from Pennant, We might see 5-7 % pump over the weekend.

Btc bullBtc forming a pennant pattern which is a bullish pattern. If the pattern breaks upwards then we could see btc to 35,000$+ .
.
.
.
.DYOR!!!

Sell GBPJPY Bearish PennantSell GBPJPY Bearish Pennant
GBP/JPY - M30 Chart - Price breaks the bearish pennant pattern now,
Its good chance to sell now.
Thank you

Pennant Pattern BreakoutThe stock has made a breakout with volumes of 10x and an increase an RSI from 48 to 57. Buy AB CAPITAL AT 122, TARGET 181

$XLM to 32¢ CRYPTOCAP:XLM Presenting a pretty Stellar Setup
CUP N' HANDLE
FLAG/PENNANT
GODD FIBONACCI CONFLUENCE

Bitcoin in #BullRun Pattern#Bitcoin Weekly Chart Analysis
In Parabolic format, CRYPTOCAP:BTC always moving as per #Bullish Pennant Pattern, it shows here 2017 #BullRun and after that it goes into #BearishZone market in 2018-19, and then #BullRun of 2020-21 and after that again #Bearish cycle starts and still running at present.
After that triangle pattern finish, #BullRun starts and it Continues in 2024-25 approx. $240k-$280k...
#DYOR #NFA #StopLoss #Crypto

BNB next moveBNB making a pennant pattern which is bullish pattern. if the pattern breaks upward direction ,Then we can easily expect BNB to 300$ easily. Let's see what is going to happen. Weather it's breakout or breakdown of pattern occur.
.
.
.
.DYOR !!!

ONMOBILE: PENNANT FORMATIONNSE:ONMOBILE Is forming Pennant. The trade should be taken only after confirmation of pattern that is after closing of candle above pattern. Target and stoploss for the same are given

Btc quick update Btc forming a bearish pennant pattern which is already brokedown in 15 min timeframe. For the current market situation please avoid trade.
.
.
.. DYOR!!
