Bearish pennant BTC? From my perspective, it doesn't look as good for Bitcoin as you hear from the perma-bulls.
The 40k support is still holding and I myself also expected a strong reaction, but hardly anything came.
What do you think? Trend continuation or liberation blow from the bulls?
Pennantpattern

Bullish Pennant Pattern in MIndtreeMindtree is continuously making higher highs and higher Lows HHHL with Pennant pattern.
Once broken then we might see 4220 in the coming month.

Patel Integrated Logistics for Long TermScrpit was in Downtrend since 2015 and now it is in Consolidation making HL& LH. Can be entered after the horizonal Black Line (34.2) is taken out indicationg begining of the Upmove and T1- 44 (Fib Level)


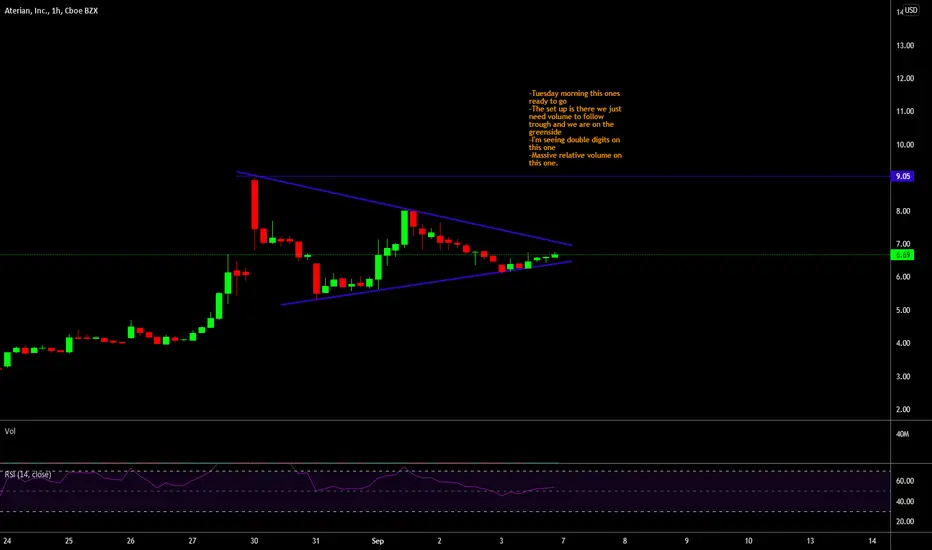
ATER HIGH RELATIVE VOLUME!!!-Tuesday morning this ones ready to go
-The set up is there we just need volume to follow trough and we are on the greenside
-I'm seeing double digits on this one
-Massive relative volume on this one.
Trading Pennants You can see a pennant formation in this dailychart of Kotak Mahindra, most likely to give a breakout. Pennant A gave a breakout but sellers took the hold and price again tested the support level and again buyers took the charge. Stock has touched 1702 support level many a times never breaking down. Buyers always take the hold of it whenever it touches the support level. A solid consolidation above the support line, along with two pennant formations, predicts a good upcoming rally which may touch the resistance level around 2000. Target Price-2025, SL- 1700.

CHRUSDT is creating a pennant CHRUSDT is creating a pennant below the weekly resistance. IF the price is going to have a breakout, According to Plancton's strategy (check our Academy ), we can set a nice order
–––––
Follow the Shrimp 🦐
Keep in mind.
🟣 Purple structure -> Monthly structure.
🔴 Red structure -> Weekly structure.
🔵 Blue structure -> Daily structure.
🟡 Yellow structure -> 4h structure.
⚫️ Black structure -> <4h structure.

FLMUSDT is creating a pennant 🦐FLMUSDT is creating a pennant. IF the price is going to have a breakout, According to Plancton's strategy (check our Academy ), we can set a nice order
–––––
Follow the Shrimp 🦐
Keep in mind.
🟣 Purple structure -> Monthly structure.
🔴 Red structure -> Weekly structure.
🔵 Blue structure -> Daily structure.
🟡 Yellow structure -> 4h structure.
⚫️ Black structure -> <4h structure.

Where is AAPL headed next?AAPL broke out of the symmetrical triangle that started forming early July 2021.
Next stop is $160!
$160 is the measured objective of the pattern and also the resistance of the long equidistant channel forming since September of 2020

#C98, #Coin98 and its nice looking pennant!A quick look at Coin98 (#C98USDT, 4HR and 15m, Binance):
According to CoinMarketCap, "Coin98 is a decentralized finance (DeFi) solution that allows users access to cross-chain swaps, staking and yield farming." The project was launched on Binance's Launchpad and opened for trading on July 25. I have been quite satisfied trading this coin so far. Today, it surprised me with a very nice pump!
Main Points
Price broke the upper resistance of the wedge supported by the third largest volume candle since launch. Admittedly, I was waiting for a breakout, but not so strong. Price eventually reached a peak at $1.85.
Price action is now forming a pennant ranging between $1.72 and $1.60.
Closest support levels are at $1.60, $1.51, and $1.45. The last two coincide with Fibonacci levels 0.5 and 0.618 respectively.
Strategy
If price breaks above the pennant, look for:
TP1: $1.85
TP2: $2.10
SL: n/a(*)
If you want to read more about Coin98 on CoinMarketCap, click here .
What do you think?
Still learning here, so any constructive feedback and positive vibes to improve my analysis are welcome.
But if you enjoy my chart, please like, comment or follow me. :)
Thank you and Happy trading!
(*) I do not use Stop-Loss for the simple reasons that I do not margin trade, and I trade only assets that I do not mind keeping long-term should the price suddenly crash.
------------------------------------------------------
Some of my charts represent actual trades, and some are just paper trading.
Needless to say, this is not financial advice!

DOGEUSDT is creating a pennant below the weekly resistance 🦐DOGEUSDT is creating a pennant below the weekly resistance 🦐, According to Plancton's strategy (check our Academy ), we can set a nice order
–––––
Follow the Shrimp 🦐
Keep in mind.
🟣 Purple structure -> Monthly structure.
🔴 Red structure -> Weekly structure.
🔵 Blue structure -> Daily structure.
🟡 Yellow structure -> 4h structure.
⚫️ Black structure -> <4h structure.

AAPL Chart Pattern Flag (Pennant)!Price in one penny!
Do you see the flagpole?
The price is expected to rise as much as the flagpole

EURJPY Rising Wedge in 4H! The price has entered a symmetrical triangle after the wedge pattern.
I say triangle. Do you think it is Pennant?
Please leave me your comment
I need it to learn more!

AXSUSDT is creating a daily pennant 🦐AXSUSDT is creating a daily pennant after the price bounced on the 0.382 Fibonacci level. IF the price is going to have a breakout, According to Plancton's strategy (check our Academy ), we can set a nice order
–––––
Follow the Shrimp 🦐
Keep in mind.
🟣 Purple structure -> Monthly structure.
🔴 Red structure -> Weekly structure.
🔵 Blue structure -> Daily structure.
🟡 Yellow structure -> 4h structure.
⚫️ Black structure -> <4h structure.


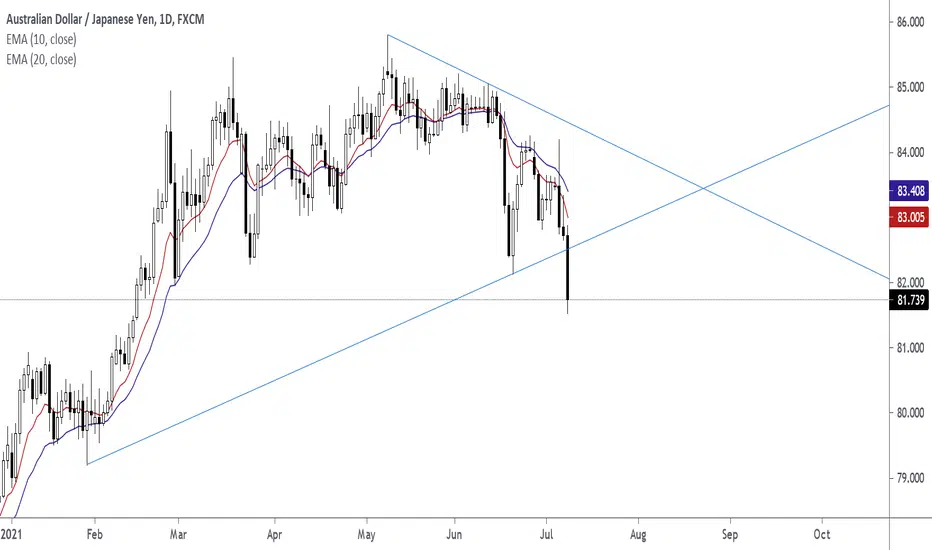
6.98R AUDJPY Profit Level 79.201 Pennant Pattern Entry Price 82.420
Profit Level 79.201
Stop Level 82.881
6.98R
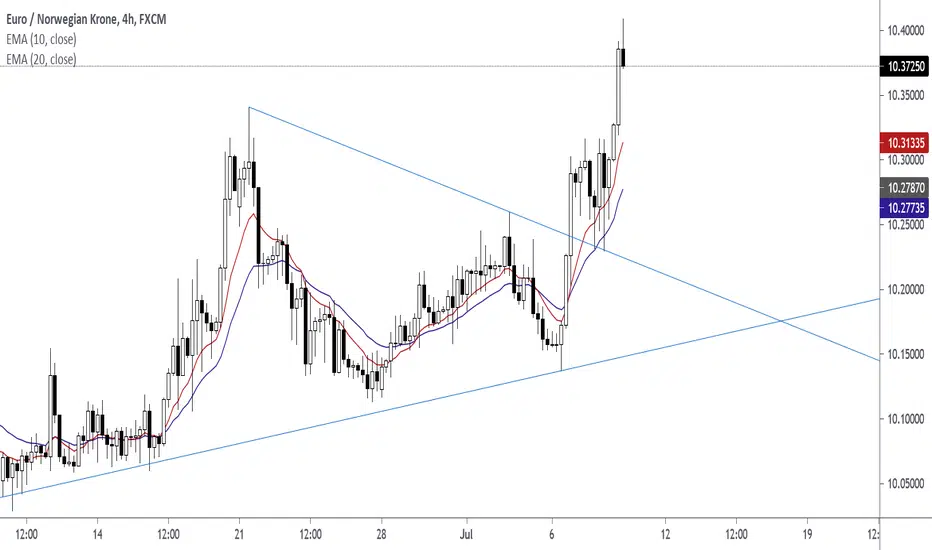
USDNOK Pennant Pattern and Pin Bar and EMAUSDNOK Entry Price 8.68647
Measured Move Distance In Chart Below

TSLA - Pennantwatching for the higher low. NAS in a 2 hour right shoulder supported by the 50 SMA - 8 EMA RES

