Bitcoin summer of fun...If we are in a continuation pattern, and Bitcoin breaks the neckline soon.
We could be on the cusp of a very interesting and strong few months of price action.
Continuation upward sloping #inverseheadandshoudlers
Pepe

Skeptic | PEPE : Spot & Futures Triggers for Maximum EdgeWelcome, traders, its Skeptic! Ready to dissect PEPE’s next moves? I’m diving into a pro-level analysis of PEPE, the #30 crypto and 3rd largest meme coin with a $4.08B market cap. This Analysis delivers a comprehensive breakdown—quick facts, 2025 performance, community strength, and technical triggers for spot and futures trading, all rooted in HWC, MWC, LWC cycles. Trade with no FOMO, no hype, just reason. 🙌 Let’s master PEPE! 🚖
Quick Facts
PEPE, an Ethereum-based meme coin launched in April 2023, is inspired by the Pepe the Frog internet meme. With a 420.69 trillion token supply, it features a deflationary burn mechanism and redistribution rewards for long-term holders. Currently trading at $ 0.00000946 , it ranks as the # 30 cryptocurrency and the 3rd largest meme coin behind Dogecoin and Shiba Inu, with a $ 4.08B market cap. Let’s unpack its 2025 performance and technical setup for actionable trades. 📊
2025 Performance & Community
PEPE has faced significant volatility in 2025, down 25.7% year-to-date and 35% this month. Despite this, its community remains robust with 456,000 + holders, and an impressive 37% haven’t sold in over a year , signaling diamond hands and strong belief in the project. This resilience suggests potential for recovery if market sentiment shifts.
Technical Analysis: Cycle-Based Breakdown
From a cycle perspective, Weekly/Monthly timeframes are range-bound, meaning lower timeframes drive most price action and shape near-term opportunities. Let’s break it down:
Daily Timeframe
After a 100% jump from May 6-22, 2025, PEPE retraced nearly the entire move. Momentum is currently bearish on the Daily, but declining volume during this pullback suggests traders view it as a correction rather than a trend reversal. Interest in heavy trading is low, indicating limited momentum for now.
Key Insight: The Daily is bearish but lacks strong selling pressure, hinting at consolidation. Watch for volume spikes to confirm directional moves.
Triggers for Spot Trading
Long Trigger: Break above resistance at $ 0.00001403 , confirmed by a volume surge during the breakout. For extra confirmation, check PEPE/BTC.
If PEPE/BTC breaks its downtrend line, it signals liquidity inflow and potential for strong growth. The primary trigger is a break of 0.0000000001399 on PEPE/BTC, which could spark explosive rallies for PEPE. Use indicators/oscillators (e.g., RSI) for additional confirmation, as PEPE/BTC volume is fake due to it being a ratio.
Key Insight: A PEPE/BTC breakout is a strong bullish signal, but volume confirmation is critical to avoid fake moves.
4-Hour Timeframe for Futures Triggers
On the 4-hour chart, PEPE has started an uptrend momentum. Should you go long on a break of resistance at $0.00001049? No —the Daily remains bearish, making the first wave risky. First-wave moves against the Daily often face high volatility and fake breakouts, lowering your win rate. Instead:
Long Trigger: Wait for the second uptrend wave after breaking $0.00001049, forming a range ceiling. Confirm with a volume increase, RSI entering overbought, or other oscillators to avoid fake breakouts or stop-loss hunts.
Short Trigger: Break below support at $ 0.00000894 is a strong short trigger, aligning with the bearish Daily. This setup offers favorable R/R ratios, especially if 4-hour momentum turns bearish. Set alarms for this level to catch the move.
Pro Tip: Shorts are safer due to Daily alignment. For longs, skip the first wave, wait for the second, and use tight risk management to navigate volatility.
Final Vibe Check
This PEPE Analysis arms you with precise triggers for spot and futures trading, leveraging cycle-based strategies. With a range-bound Weekly, focus on Daily and 4-hour for opportunities. Short at $0.00000894 aligns with the trend, while longs need second-wave confirmation above $0.00001049 or a PEPE/BTC breakout at 0.0000000001399. Protect your capital—stick to MAX 1%–2% risk per trade. Want more cycle-based setups or another pair? Drop it in the comments! If this analysis sharpened your edge, hit that boost—it fuels my mission! 😊 Stay disciplined, fam! ✌️
💬 Let’s Talk!
Which PEPE trigger are you watching? Share your thoughts in the comments, and let’s crush it together!

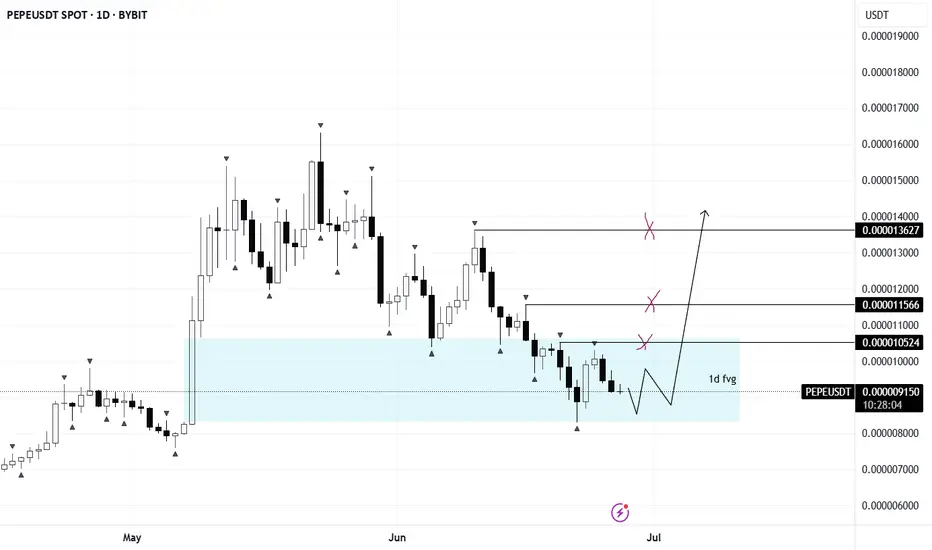
PEPE/USDTDaily FVG has been fully filled. Now watching lower timeframes for long entry conditions.
If confirmed, upside targets sit in the 105–136 range. Let the setup come to you — no entry without clear signals.
pepe updateentry price 0.00001425
stop loss update 0.00001425
take profit
0.00001172
0.00001022
0.0000086
result full target

Pepe Prepares To Grow After 5 Weeks Red (5X Possible)I am sorry, the system is not working and won't let me write more than a few lines. This is the best I managed to publish without getting an error.
You can get the idea by looking at the chart and drawings. It points to higher prices in the coming weeks and months. Namaste.

$PEPE follow up for June 2025Follow-up on my previous CRYPTOCAP:PEPE analysis — it played out exactly as expected.
CRYPTOCAP:PEPE remains my top meme coin, backed by some of the strongest tokenomics in the space. When altseason hits — if it hits — this one is primed to pump hard.
Like most altcoins right now, CRYPTOCAP:PEPE is in a short-term corrective pattern. That opens up another great opportunity to enter low and potentially ride a 2x or 3x move on the next leg up.
I’ve marked my usual buy zone. It may seem optimistic for now, but history shows how fast meme coins can dump… and then recover just as quickly. A drop into that green zone is entirely possible.
📲 Follow me for alerts — I’m monitoring CRYPTOCAP:PEPE daily. It’s one of my top picks.
DYOR.
Here was the previous analysis:
#PEPE #MemeCoin #Altseason #CryptoGems #BuyTheDip #Altcoins #CryptoTrading #Tokenomics #DYOR #CryptoAlerts
COINBASE: Is it a guide on how to trade PEPE??Coinbase saw a massive surge yesterday as the Senate cleared the path for stablecoin regulation. This turned its 1D technical outlook almost overbought (RSI = 68.001, MACD = 11.870, ADX = 26.090). Our TP = 348.50 on COIN remains but oddly enough, we see a stronger than expected correlation with PEPE. Since it is now lagging after the Senate decision, this may be a great time to buy PEPE as this pattern shows that soon it will follow Coinbase upwards anf they will converge.
See how our prior idea has worked out:
## If you like our free content follow our profile to get more daily ideas. ##
## Comments and likes are greatly appreciated. ##

Most see capitulation. I see clean premium-to-discount deliveryPEPE just swept deep into the 0.786 retracement — right where most fear sets in. But Smart Money? This is where they reaccumulate. The structure isn't broken — it's resetting.
Here’s what the chart tells me:
Price dipped straight into the FVG + 0.786 (0.00000945) zone
That's the deepest discount before structural invalidation — exactly where Smart Money looks for reversal footprints
The upside draw sits cleanly at 0.00001194 (0.5 fib), with an extension possible toward 0.00001297 and even 0.00001424
This move down didn’t violate anything. It rebalanced prior inefficiency and opened the door for premium delivery.
Execution logic:
Accumulate within 0.00000945–0.00000918 (discount zone)
Invalidation: break below 0.00000758 closes the book on this setup
Targets: 0.00001194 → 0.00001297 → 0.00001424
The biggest moves don’t start when it feels safe. They start when it feels late.
For setups like this — built on logic, not luck — check the profile description. I trade where Smart Money trades.

$PEPE looks ready to leap again!CRYPTOCAP:PEPE looks ready to leap again! 🐸
After its massive December 2024 rally, CRYPTOCAP:PEPE has undergone an equally strong correction — but signs suggest the bottom is in.
✅ Strong support at 0.0000700 and 0.0000650
✅ MACD stabilizing
✅ RSI showing a huge bullish divergence
Momentum is building — don’t lose sight of the frog! 🐸🚀
DYOR
#PEPE #Altcoins #CryptoTrading #BullishSetup #RSIDivergence #MemeCoinSeason #CryptoAlert #PEPEArmy
Everybody loves green, but don't forget about redWhy $PEIPEI Could Perform in Autumn 2025 Bullrun
Meme Coin Surge: Bullruns historically favor meme coins due to retail hype. $PEIPEI’s Pepe branding and low price point make it an attractive speculative pick for investors chasing 100x gains.
NFT and Gaming Potential: If the team delivers on promised NFT utility or gaming integrations by Autumn 2025, it could drive demand, especially if the NFT market rebounds.
Low Market Cap: At ~$150M, $PEIPEI has significant room for growth compared to larger meme coins, appealing to risk-tolerant investors.
Community Momentum: The Pepe meme’s cult-like following and active community could amplify hype on platforms like X, fueling price pumps during a market upswing.
Exchange Listings: New listings on major exchanges in 2025 could increase liquidity and exposure, a common catalyst for meme coin rallies.

Compression, rejection, and the trap belowPEPE isn’t random here — it’s in a calculated drawdown. Not a dump — a design. What looks like weakness is really compression into a reactive pocket.
The logic:
Price is descending inside a compression channel. But the real interest lies lower — specifically around the FVG and the untouched demand range down to 0.0000089. That’s the key.
The 0.0000103 zone is a surface-level fib level (0.382), but the deeper intention is beneath it — where Smart Money will want to accumulate before running it back into inefficiency.
Above us? There’s a massive void sitting between 0.0000115 and 0.0000126. That’s the draw — but not before a deeper sweep to fuel it.
Two key paths:
Ideal: Full sweep of 0.0000089 demand → strong reversal → drive back into the .5/.618 fib cluster near 0.0000115–0.0000126
If front-run: Hold near current level (0.0000103) and deliver into the FVG gap above
Anything below 0.0000083? That’s your invalidation. Until then, compression is the setup.
Final thought:
“Smart Money doesn’t chase the wick. It sets the trap — then steps in with size.”

Pepe, Finding The Next Support ZoneThe same analysis that I made for Dogecoin is true here on PEPEUSDT.
We have two support zones. We have lower highs long-term, starting December 2024 (six months is already long-term), and short-term, June vs May.
What we are seeing is a repeat of the December correction but a miniature version. The bullish wave that follows will be a repeat of the April-May advance but with total growth highly magnified.
So the correction will end up being much smaller while the bullish wave that follows much stronger. Alternation.
If you want more information on price action, what is happening, read all the recent charts I just published. The situation across several projects is quite similar, at least the ones I've been seeing.
The duration of the correction will vary between a few days to a few weeks. Some pairs are already at bottom and will recover soon while others still have a long way to go. Those that grew nicely recently will remain lower, those that didn't grow will move up strong first.
Each chart needs to be considered individually but that's the general picture. You can find which ones will move first on the next wave based on recent past action.
Thank you for reading.
Namaste.

Pepe Support Confirmed, Bullish Continuation Next (Trade & Win)Support is now confirmed with four green days after EMA55 and EMA89 hold as support. PEPEUSDT is bullish now and set to grow.
The peak happened 24-May. The low 5-June.
This retrace lasted 13 days with a total drop of 36%. For future reference.
After each bullish wave, there is always a retrace or correction. In this case only a retrace because the bullish cycle is just getting started, the previous wave of growth was very small.
The next advance will be very, very strong so we can expect a correction after it. The difference between the retrace and a correction is about size. The correction lasts longer and goes deeper, that's all there is.
Expect maximum growth now but this won't be the end. It will grow super strong in the coming weeks and months, then we get a correction and then even more growth. But the fifth wave is the last one, after this we get a bear market so pay attention.
Pepe's support has been confirmed. This bullish continuation will turn the market full green.
Follow me to trade with me and win.
Namaste.

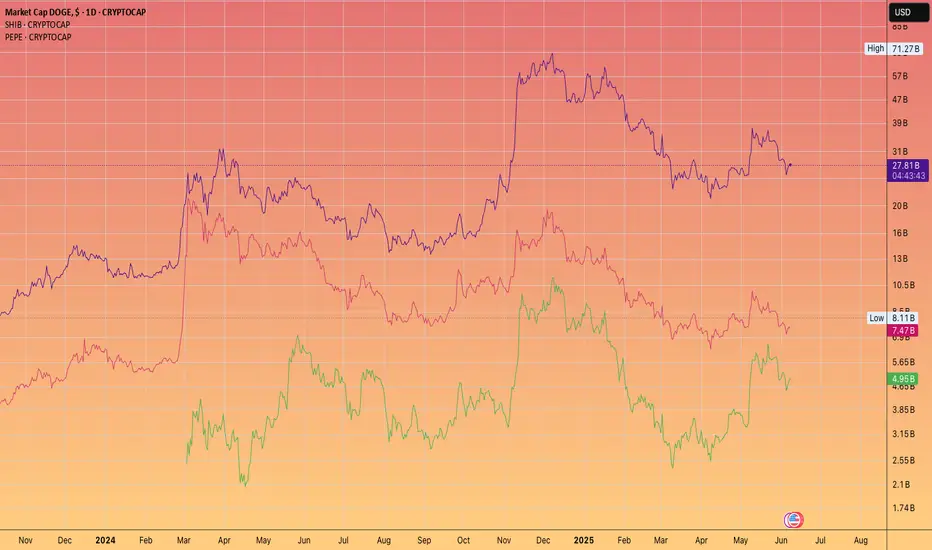
Pepe is going flip SHIB. But can it catch Dogecoin?If Ethereum were to smash $10k
Then it has a genuine chance IMHO
We shall be watching and tracking this as the cycle reaches it's mania phase!
PEPE Phoenix Revival: The +70% Bottoming Pattern Confirmed
The PEPE/USDT daily chart from May 10, 2025, reveals a textbook "Phoenix Rising" pattern that signals an extraordinary trading opportunity currently unfolding. Trading at 0.00001305 with significant momentum (+5.50% on rising volume), PEPE appears poised for a massive recovery rally toward historical resistance.
---- Technical Structure: Bottoming Pattern Complete ---
After a prolonged downtrend from January 2025, PEPE has formed a perfect bottoming pattern with these key components:
1. Accumulation Channel Formation (yellow boundaries) - The March-April base-building phase where smart money quietly accumulated positions between 0.000005-0.000008
2. Channel Breakout Confirmation - The recent powerful green candle with expanding volume (28.17T) signaling institutional entry
3. Historical Supply Zone (purple rectangle) - This is the crucial 0.0000175-0.0000185 range that previously acted as support before the January breakdown
--- Trading Roadmap: The 66% Upside Play ---
The blue pathway illustrates the anticipated price movement, with three distinct phases:
Phase 1: Consolidation - After the initial breakout surge, price will likely form a higher low around 0.00001033 (marked as entry point), creating the ideal risk-reward opportunity
Phase 2: Stair-Step Advance - A series of higher highs and higher lows as price climbs through previous resistance levels
Phase 3: Target Achievement - Final push toward the 0.00001715 take-profit target, representing a 66% gain from the suggested entry point
--- Technical Reasoning: The Triple Confluence ---
What makes this setup particularly compelling is the triple confluence of factors:
1. Volume Confirmation - The breakout candle shows 5.50% gains on expanding volume, the textbook definition of genuine price movement
2. Historical Context - The current price structure mirrors almost identically the bottoming pattern seen in early 2024 before PEPE's previous major rally
3. Macro Alignment - This move coincides perfectly with the projected Bitcoin dominance decline (as seen in broader market analysis), creating ideal conditions for meme coin outperformance
--- Strategic Entry Plan ---
The optimal approach to this opportunity is to wait for the pullback to the 0.000010 level, which provides:
- Clear invalidation point (below 0.0000095)
- Exceptional risk-reward ratio (over 5:1)
- Confirmation of higher low pattern formation
4H VIEW HERE
The current market structure suggests this retracement will likely occur within the next 10-14days, creating the perfect entry window before the projected June rally toward the target zone.
This Phoenix pattern represents one of the clearest technical setups currently visible in the crypto market, offering a well-defined opportunity with precise entry, target, and invalidation levels.
HELP US WITH LIKE AND FOLLOW GUYS .. THANK YOU

PEPE Ready to Rip? 3 Take-Profits Lined Up from This Key SupportPEPEUSD is currently forming a potential bullish reversal near the key support zone between 0.00001060 and 0.00001099. This level has acted as a solid demand zone previously, with price bouncing off this range multiple times in the recent past. The current price action suggests consolidation above this level, hinting at potential accumulation by buyers.
We can observe a compression in volatility, with recent candles showing smaller bodies and longer wicks near support—classic signs of weakening bearish momentum. The prior price rejection from the 0.00001318 zone and the smooth retracement to support further confirm this as a healthy correction rather than a trend breakdown.
The DPO (Detrended Price Oscillator) is hovering close to zero, suggesting the asset is entering a potential pivot zone. A move into positive territory would support the bullish scenario, ideally confirmed by an increase in volume on the breakout above short-term resistance.
This setup is particularly attractive for scalpers or short-term traders, aiming to capture quick momentum surges across multiple resistance levels.
📌 Trade Setup
• Entry Zone: 0.00001167–0.00001177
• Stop-Loss (SL1): 0.00001060
• Take-Profit 1 (TP1): 0.00001318
• Take-Profit 2 (TP2): 0.00001443
• Take-Profit 3 (TP3): 0.00001603
Strategy Note: The risk-to-reward ratio is highly favorable, particularly for TP2 and TP3. The setup allows for flexible scaling of positions as price hits each resistance level. With no immediate macro threats on the 4H structure and price defending support, this setup offers a clean bullish opportunity.

They saw weakness. I saw PEPE return to the source.Every time price dropped today, people called it a breakdown.
But Smart Money doesn’t break price — they rebalance it.
PEPE just swept the prior low into 0.00001145 — the 0.786 retracement — and bounced. No hesitation. That wick? That was engineered. The goal wasn’t to fall — it was to fill.
Now we sit below the 15m OB at 0.00001167–0.00001175. That’s the gate. If price reclaims and consolidates above this zone, the next draw becomes obvious: 0.00001204 — clean inefficiency, clean liquidity.
If it rejects? Watch for one more final liquidity raid into 0.00001129 before the macro expansion.
Execution breakdown:
🔑 Entry: 0.00001145 (0.786)
🎯 TP 1: 0.00001175 (OB mitigation)
🎯 TP 2: 0.00001204 (full inefficiency reclaim)
❌ Invalidation: sustained close below 0.00001129
The chart didn’t break down.
It paused — to let the untrained exit early.

Don't miss today's signal.Hello friends
Given the good growth we had, the price has corrected and now we can buy in steps in the specified areas with capital and risk management and move with it to the set goals.
*Trade safely with us*

"PEPE 1H Analysis - Breakout Incoming? 📊 *PEPE/USDT – 1H Technical Analysis*
An ascending triangle pattern is developing on the 1-hour timeframe, which often indicates potential bullish momentum.
🟢 Price is approaching a key resistance near *0.00001516*.
🟡 A clean breakout above this level with strong volume may open the door for further upside.
🔴 Watch for *confirmation* before considering any move.
🔍 This chart is purely for educational and analytical purposes.
No financial advice. Do your own research before making any trading decisions.
#PEPE #PEPEUSDT #Crypto #TechnicalAnalysis #TradingView #Altcoins

Pepe 5X Lev. Full PREMIUM Trade-Numbers (PP: 1670%)The market always offers a second chance. The full trade-numbers below have targets up to 0.00003381 for a maximum profits potential for 1670%. The chart goes higher and reaches 2235% (0.00004264) and 3715% at 0.00006575.
How far up it goes and how fast is for the market to decide.
These trade setups are good if we can catch the bullish breakout, once the breakout is in, the rest is an easy wait.
I know some people that are happy to secure their trades after 200-300%, some even at 100%. Others wait long-term because these are awesome chart setups and can reach much higher. In past cycles we've done trades with more than 10X easily. This is one of those.
The question is, will it hit or will it fall?
The market always offers a second chance and a second chance is upon us, now.
Full trade-numbers below:
_____
LONG PEPEUSDT
Leverage: 5X
Entry levels:
1) 0.00000810
2) 0.00000715
3) 0.00000690
4) 0.00000630
Targets:
3) 0.00000867
4) 0.00001071
5) 0.00001222
6) 0.00001408
7) 0.00001681
8) 0.00001953
9) 0.00002342
10) 0.00002836
11) 0.00003381
Stop-loss:
Close weekly below 0.00000625
Potential profits: 1670%
Capital allocation: 5%
_____
Why Pepe and not some other Altcoin?
I shared trade-numbers for you for pairs as varied as Bitcoin and Ethereum, Notcoin and Dogs, Solana and Filecoin, Pepe, EOS, XRP, Cardano and Compound, to name a few. The truth is that I pick what in the moment looks good.
Market conditions can always change, but at the time of writing the chart looks great.
Notice that the action is 100% full red, that's the time to buy as I always remind and say; Buy when prices are low or trading near support; buy when the market is red.
The market is red now and that's the time to buy before a reversal happens. You will see, our time to sell comes when the market turns green.
Many average players will do it in reverse, right now they are selling and they will buy at the top of the bullish wave. I know, it is tempting, it is the market impulse but we have to learn to control our emotions if want success in this game.
There is risk involved. Leveraged trading is for experts only.
Thanks a lot for your continued support.
Namaste.

PEPE/USDT Potential UpsidesHey Traders, in today's trading session we are monitoring PEPE/USDT for a buying opportunity around 0.00001360 zone, PEPE/USDT is trading in an uptrend and currently is in a correction phase in which it is approaching the trend at 0.00001360 support and resistance area.
Trade safe, Joe.

Phemex Analysis #84: Pro Tips for Trading PEPEIn the vibrant and ever-changing landscape of cryptocurrency trading, PEPE ( PHEMEX:1000PEPEUSDT.P ) has recently captured significant attention from investors. Over the past 30 days, PEPE surged an impressive 130%, showcasing strong bullish momentum after a prolonged downtrend. This recent rally has rekindled investor interest, suggesting that a potential bullish reversal may be underway.
Yet, with volatility remaining high, traders should remain cautious.
Let’s explore several possible price scenarios and strategies to capitalize effectively on PEPE’s movements.
Possible Scenarios
1. Accumulation Followed by Breakout Rise
Currently, PEPE is showing signs of accumulation in the $0.015 to $0.012 range. This sideways consolidation typically indicates that market participants are gathering positions before a potentially significant upward move. If PEPE breaks decisively above the critical resistance at $0.0163, especially accompanied by a notable spike in trading volume, it would be a strong confirmation of bullish sentiment.
Pro Tips:
Entry Strategy: Consider accumulating positions within the consolidation range ($0.015 - $0.012). Wait for confirmation of a breakout above $0.0163 to scale up your positions confidently.
Risk Management: Place stop-loss orders below $0.012 to mitigate downside risk should the breakout fail to materialize.
2. Retesting the $0.007 Support Area
A pullback scenario could also unfold, bringing PEPE’s price down to retest the critical support zone around $0.007. If this retest occurs with relatively low trading volume and the RSI remains higher compared to previous lows—signaling a Double Bottom formation with RSI divergence—this could provide an excellent accumulation opportunity.
Pro Tips:
Accumulation Signals: Monitor trading volume and RSI closely. A successful retest at $0.007 with bullish divergence could indicate strong buying pressure.
Entry Confirmation: Conservative traders may prefer waiting for a confirmed breakout upward from the $0.007 support area before entering positions.
3. Bearish Drop Scenario
Despite the recent bullish signs, a bearish scenario remains possible. If PEPE declines towards the support level at $0.012 with increasing trading volume, and subsequently drops to $0.007 with even higher volume, it could indicate strong bearish momentum and weak market sentiment. Under these conditions, caution is highly recommended.
Pro Tips:
Market Caution: If price action unfolds this way, it’s advisable to refrain from entering positions immediately.
Wait and Observe: Allow price to stabilize before reconsidering any potential entry points, ensuring clear evidence of support.
Conclusion
PEPE’s recent 130% surge represents promising signs of a bullish reversal, yet navigating such volatility demands careful planning and strategic execution. By closely monitoring the outlined scenarios—recognizing accumulation signals, bullish divergences, and maintaining disciplined risk management—traders can maximize their potential returns while minimizing risk exposure. Always stay alert, responsive to market signals, and ready to adapt to changing conditions to trade PEPE confidently and profitably.
Tips:
Trade Smarter, Not Harder with Phemex. Benefit from cutting-edge features like multiple watchlists, basket orders, and real-time strategy adjustments. Our unique scaled order system and iceberg order functionality give you a competitive edge.
Disclaimer: This is NOT financial or investment advice. Please conduct your own research (DYOR). Phemex is not responsible, directly or indirectly, for any damage or loss incurred or claimed to be caused by or in association with the use of or reliance on any content, goods, or services mentioned in this article.

