PEPE BUY ...Hello friends
Due to the price drop, good conditions have been created to buy with risk and capital management and move towards the specified goals...
If you are risk-averse, this signal is for you...
*Trade safely with us*
Pepe

PEPE | BULLSH | ALT can +150%PEPE seems to have bottomed out after flashing bullish signs on the chart.
Once we close ABOVE the 50 day moving averages (green line) in the weekly timeframe, that's when we'll know the bullish action is full steam:
Make sure you don't miss the update on BTC here:
______________________
BINANCE:PEPEUSDT

BUY PEPE ...Hello friends✌
As you can see in the picture, we have specified a purchase range for you to buy in stages, of course with capital and risk management.
🙏If you like it, support it with a ✔like✔ and ✔comment✔.
*Trade safely with us*

PEPE/USDT 1H: Bullish Structure – Long Setup Above 0.000089PEPE/USDT 1H: Bullish Structure – Long Setup Above 0.000089
🚀 Follow me on TradingView if you respect our charts! 📈 Daily updates!
Current Market Conditions (Confidence Level: 8/10):
Price broke above equilibrium (0.000089), confirming bullish market structure.
Hidden bullish divergence spotted on RSI, suggesting momentum continuation.
Market Makers likely accumulating around discount zone between 0.000084 – 0.000086.
Trade Setup (Long Bias):
Entry: 0.0000895 – 0.000090 range.
Targets:
T1: 0.000092
T2: 0.000094
Stop Loss: 0.0000875 (below recent swing low).
Risk Score:
7/10 – Volume profile favors upward movement, but proximity to resistance at 0.000092 introduces moderate risk.
Key Observations:
Strong support confirmed at 0.0000875 (FVG area).
Premium resistance zone located between 0.000092 – 0.000094.
Smart Money positioning signals potential breakout after accumulation phase.
Volume increasing after liquidity sweep below 0.000086.
Recommendation:
Long positions favored within entry range with tight stop below 0.0000875.
Consider scaling partial profits at 0.000092 and fully exiting near 0.000094.
Monitor price action around 0.000092 for potential rejection or clean breakout.
🚀 Follow me on TradingView if you respect our charts! 📈 Daily updates!

PEPECOINHello friends
Considering the price growth we had, you can see that the upward channel has been broken by the price correction and now you can enter the price correction.
The purchase and target points have also been determined...
Follow capital management.
*Trade safely with us*

PEPE : WHAT WE WANT?Hello friends
Given the good price growth, we see that we had a correction, which we found the support area using Fibonacci, and the price has returned from that area by buyers and is now in an ascending channel, which we expect to move to the specified targets.
Trade safely with us

ALTSEASON | ALTS | BUY Zones SummaryOver the past few weeks I've been gradually analyzing the alts that I believe have great potential for the next cycle.
These include:
✅ ATOM
✅ Litecoin
✅ Fantom
✅ Doge
✅ SUI
✅ SHIB
✅ DOT
✅ PEPE
✅ BNB
✅ Tron
✅ The Graph
✅ Render
✅ Maker
✅ AAVE
Here's your quick video summary on ideal buying zones for the above altcoins. Enjoy!
____________________________

PEPEUSDT 2DPEPE ~ 2D Analysis
#PEPE Buy after successfully penetrating this resistant line with a short -term target of at least 15%+ from here.

Opportunity in PEPEUSDT PEPEUSDT has just broken its previous high and is attempting to retrace to the 0.00000665 - 0.00000656 range. This could present an opportunity to join the uptrend.
Price reversal confirmation >0.00000679.
Upside target 0.00000728 - 0.00000737.
Invalid level below 0.00000663
PEPE/USDT:BUY!!!Hello friends
Due to the heavy price drop we had, the market has fallen into fear and the price has been well supported in the specified support area, according to which we can buy in steps in the specified areas with capital and risk management and move to the specified goals.
Always buy in fear and sell in greed.
*Trade safely with us*

PEPEUSDT Eyes the Sky!BINANCE:PEPEUSDT has shown a strong bounce from a key support level, signaling potential for a continued bullish move. The overall market sentiment is positive, which could act as a catalyst for further upside. With the price structure leaning bullish and momentum picking up, there’s a good chance we’ll see higher highs in the coming sessions. Traders should keep an eye on the next resistance zone as a possible target while maintaining disciplined risk management. Always trade with a clear plan—and most importantly, don’t forget your stop loss!
$1000PEPEUSDT Currently trading at $0.00735
Buy level : Above $0.0071
Stop loss : Below $0.0056
Target : $0.0145
Max leverage 3x
Always keep Stop loss
Follow Our Tradingview Account for More Technical Analysis Updates, | Like, Share and Comment Your thoughts

Corrective waves continue on the chart.I don't think there will be enough demand before new lows come.
* The purpose of my graphic drawings is purely educational.
* What i write here is not an investment advice. Please do your own research before investing in any asset.
* Never take my personal opinions as investment advice, you may lose your money.

Long idea on $PEPEAfter completing its full growth, this altcoin has formed a larger-scale correction, and now I believe there will only be a technical rebound within the broader correction.

Block orders showing we are entering a buy range 719 -735 could be a potential sell area.
4 hour block chart is showing we are entering a buy range. I usually try to put stop loses in a little under the buy range for liquidity grabs. However this is where I begin investing funds till it fails or goes to the sell range. This could take hours to days though off the 4 hour chart.

PEPE/USDT:FREE SIGNALHello dear friends
Given the price drop we had in the specified support range, a double bottom pattern has formed, indicating the entry of buyers.
Now, given the good support of buyers for the price, we can buy in steps with capital and risk management and move to the specified targets.
*Trade safely with us*

PEPE Ready to Dump? This Key Zone Could Trigger a Sharp ReversalYello Paradisers — did you catch the recent shift on PEPEUSDT? If not, now’s the time to zoom in, because the setup is looking primed for a big move, and you don’t want to be caught on the wrong side.
💎PEPEUSDT has broken out of Ascending Channel & shown a clear bearish CHoCH (Change of Character), confirming a shift in market structure. Following that, we’ve now seen a proper pullback. Currently, the price is sitting right at a critical resistance zone.
💎What makes this zone especially significant is the confluence of technical factors stacked at the same level — the 200 EMA, a Fair Value Gap (FVG), and the Fibonacci Golden Zone are all present. This combination significantly increases the probability of a bearish move from here.
💎If PEPE breaks out and closes a candle above our invalidation level, the entire bearish idea gets invalidated.
🎖Paradisers; the next 6–9 months will be juicy for some and painful for others. Discipline, patience, robust strategies, and trading tactics are the only ways you can make it long-term in this market.
MyCryptoParadise
iFeel the success🌴

PEPE(UPDATE)Hello friends
Due to the heavy price drop, you can see that buyers are slowly entering, and now there is a good opportunity to buy in stages and with capital management and move towards the specified goals.
Don't forget to save profit on each target.
*Trade safely with us*

PEPEUSDT 2DPEPE ~ 2D Analysis
#PEPE Buy gradually after re -testing this support with a short -term target of at least 15%+.

Road to riches - paved with good intentions Order block 1 day timer has yet to fall to the previous buy zone
Order block 1 hour timer just hit the bottom of a buy zone and may reverse to 800 zone.
The 4 hour order block is half way thru a plunge of 3 buy zones
Once 1 hour recovers and higher ones do too.
But how much further will we drop?
Right now we entering a high order block buy zone that can drop to 400 or 500 zone.
Be careful trading lower time frames - we are still seeing turbulence.

PEPEUSDT - Are you ready?PEPE USDT is at a much strong OB where validation is done, if not other slips, this is a range to be formed likely marked in piink (darvas) and a spring to be done for further upmove! The cyan box is all the prev vol marked!

Breaking: $PEPE Coin Dipped 10% Today- Is the Frog Meta Dead?Pepe the Frog ( CRYPTOCAP:PEPE ) memecoin saw its token price plummet by 10% today albeit the general crypto landscape experienced a deja vu as The US Personal Consumption Expenditures (PCE) inflation numbers for February have been released, showing a steady trend in headline inflation but a slight uptick in core inflation.
Bitcoin and altcoins have extended losses further from earlier today as BTC slips under $85,000, while Ethereum (ETH) tanks 7% slipping under $1,900. Current trend shows that investors could expect strong volatility over the weekend.
US PCE Data Shows Inflation Remains Sticky
As per the Bureau of Economic Analysis, the US PCE inflation data remained unchanged at 2.5% for the month of February, aligning with the market expectations and the previous month’s reading. However, the year-over-year core inflation came hotter-than-expected at 2.8%, higher than both the previous reading of 2.6% and the expected 2.7%.
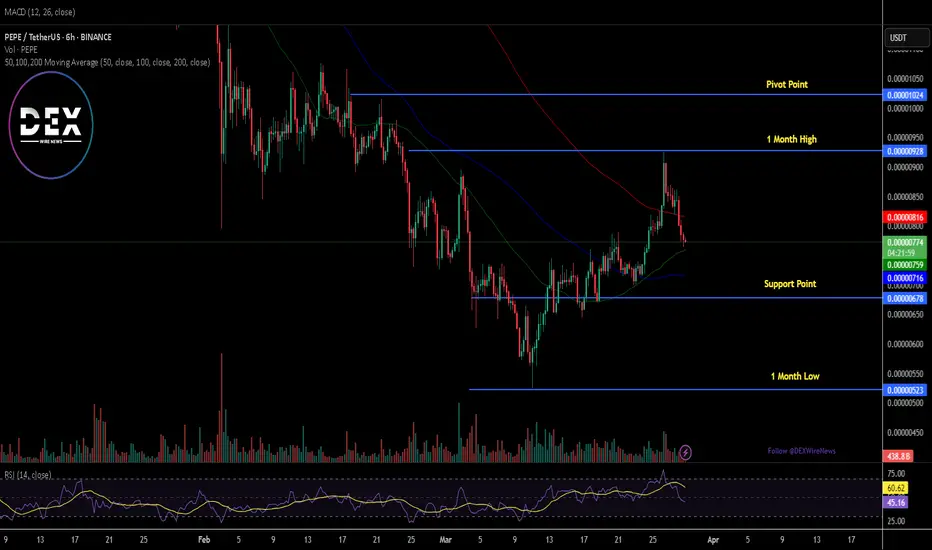
Technical Outlook of PEPE
As of the time of writing, CRYPTOCAP:PEPE is down 8% trading within a bearish trend pattern. the asset is approaching the 65% Fibonacci retracement point is serving as support point should selling pressure submerged. Furthermore, with the RSI at 45, there might be further consolidatory move by CRYPTOCAP:PEPE to cement a perfect liquidity pick region to increase the demand for $PEPE.
Pepe Price Live Data
The live Pepe price today is $0.000008 USD with a 24-hour trading volume of $519,642,130 USD. Pepe is down 8.84% in the last 24 hours. The current CoinMarketCap ranking is #31, with a live market cap of $3,265,213,245 USD. It has a circulating supply of 420,689,899,653,544 PEPE coins and a max. supply of 420,690,000,000,000 PEPE coins.
Trading opportunity for PEPEUSDTBased on technical factors there is a Buy position in :
📊 PEPEUSDT
🔵 Buy Now
🪫Stop loss 0.00000640
🔋Target 0.00000900
📏 R/R 1,6
💸RISK : 1%
We hope it is profitable for you ❤️
Please support our activity with your likes👍 and comments📝

PEPE...Hello friends
Regarding the price drop, now that buyers are supporting the price, it was entered within the specified support ranges with capital and risk management.
*Trade safely with us*
