PEPEUSDT Forming Falling ChannelPEPEUSDT is showing promising signs of a potential breakout, supported by a clear price structure that resembles a falling channel pattern. This technical setup is widely known among traders for indicating a possible trend reversal when the price successfully breaches the channel’s upper resistance line. Coupled with good trading volume, the current market sentiment around PEPE is generating optimism for a potential 60% to 70% gain as buyers step in at these attractive levels.
This crypto pair has caught the attention of both retail and institutional investors due to the growing hype and community-driven momentum behind the PEPE token. Despite its meme origins, PEPE has demonstrated significant staying power in the market, with steady liquidity and regular price swings that attract short-term and swing traders alike. As new investors continue to accumulate positions, the probability of a breakout move increases, reinforcing the bullish outlook.
Technically, the price action indicates that PEPEUSDT may be forming a solid base for an upward surge. The falling channel pattern, if validated with a confirmed breakout and retest, could set the stage for a strong push towards higher levels, aligning perfectly with the projected upside potential. Traders should keep a close eye on the breakout level and volume spikes, as these will serve as key confirmation signals for the next move.
✅ Show your support by hitting the like button and
✅ Leaving a comment below! (What is You opinion about this Coin)
Your feedback and engagement keep me inspired to share more insightful market analysis with you!
Pepebtc

PEPEUSD going to moon according to my analysis. {08/june/2025}Educational Analysis says that PEPEUSD may give trend Trading opportunities from this range, according to my technical analysis.
Broker - binance
So, my analysis is based on a top-down approach from weekly to trend range to internal trend range.
So my analysis comprises of two structures: 1) Break of structure on weekly range and 2) Trading Range to fill the remaining fair value gap
Let's see what this pair brings to the table for us in the future.
Please check the comment section to see how this turned out.
DISCLAIMER:-
This is not an entry signal. THIS IS FOR EDUCATIONAL PURPOSES ONLY.
I HAVE NO CONCERNS WITH YOUR PROFIT OR LOSS,
Happy Trading, Fx Dollars.

Don't miss today's signal.Hello friends
Given the good growth we had, the price has corrected and now we can buy in steps in the specified areas with capital and risk management and move with it to the set goals.
*Trade safely with us*

PEPE 80% Profit🚀 BINANCE:PEPEUSDT just made a big move!
It surged from 0.00000820 to 0.00001244 and then corrected to 0.00000956 📉
Now it’s sitting on strong support — and if it holds, another rally could be on the way! 💥
🎯 Next resistance levels:
0.00001244 (recent high)
0.00001719 (next key level)
0.00002317 (major long-term target) 🏁
📌 Key support zones:
0.00000956 (current support)
0.00000820 (late May support)

PEPE will be bullish soon (12H)It appears that we have an ABC pattern on the chart, with wave C forming as a terminal wave.
Currently, we seem to be in wave 4 of C. Wave 4 may complete within the green zone, leading to wave 5 of C, which is a bullish wave.
We are looking for buy/long positions in the green zone.
Targets are marked on the chart.
A daily candle closing below the invalidation level will invalidate this analysis.
For risk management, please don't forget stop loss and capital management
Comment if you have any questions
Thank You

PEPE : WHAT WE WANT?Hello friends
Given the good price growth, we see that we had a correction, which we found the support area using Fibonacci, and the price has returned from that area by buyers and is now in an ascending channel, which we expect to move to the specified targets.
Trade safely with us

#PEPE/USDT#PEPE
The price is moving in a descending channel on the 1-hour frame and is adhering to it well and is heading to break it strongly upwards and retest it
We have a bounce from the lower limit of the descending channel, this support is at a price of 0.00000935
We have a downtrend on the RSI indicator that is about to break and retest, which supports the rise
We have a trend to stabilize above the moving average 100
Entry price 0.00000950
First target 0.000000960
Second target 0.00001000
Third target 0.00001047

#PEPE/USDT#PEPE
The price is moving in a descending channel on the 1-hour frame and is adhering to it well and is heading to break it strongly upwards and retest it
We have a bounce from the lower limit of the descending channel, this support is at a price of 0.0.00000970
We have a downtrend on the RSI indicator that is about to break and retest, which supports the rise
We have a trend to stabilize above the moving average 100
Entry price 0.0.00000986
First target 0.000001013
Second target 0.00000103
Third target 0.000001068

$COINEX:PEPEUSDT Pepe is a meme-based token that references the famous image of "Pepe the Frog." This image has become very popular on the internet and symbolizes meme culture.
- **Inspired by Previous Successes:** Other tokens like Dogecoin and Shiba Inu have inspired the creation of such cryptocurrencies.
- **Developers and Community:** The developers of the token and the user community significantly impact its success. Social activities and marketing can help increase its price and adoption.
- **Price Volatility:** The prices of meme-based currencies tend to fluctuate significantly. Investors should be cautious of these fluctuations.
- **Adoption and Use:** Although Pepe was initially created as a meme token, it needs wider adoption in wallets and exchanges to survive.
- **Liquidity:** One of the main challenges for new cryptocurrencies is low liquidity, which can affect buying and selling capabilities.
- **Regulation:** As governments pay more attention to the cryptocurrency market, regulations can significantly impact the development and acceptance of these tokens.
Pepe is an appealing token linked to meme culture, but investing in it, like any other cryptocurrency, carries risks. It is advisable to conduct thorough research before investing and to gather more details about the community, goals, and future of this token. If you have specific questions or need more details on particular aspects, I’d be happy to help!
PEPE looks bearish (1D)PEPE seems to be completing a diametric pattern and is now entering wave F.
Wave F is bearish. The drop in wave F is expected to continue until it reaches the green zone.
Targets are marked on the chart.
A daily candle closing below the invalidation level will negate our buy outlook.
For risk management, please don't forget stop loss and capital management
Comment if you have any questions
Thank You

PEPEUSDT: Flash Crash? I’m Ready!PEPEUSDT isn’t looking too strong right now, big sell-offs, not great.
But here’s the deal: I’ve got my blue boxes lined up, and they’re solid. If a flash crash comes, those zones are where I want to meet the price.
This is a long-term play, folks. Smart levels, strong technicals, and a tight stop-loss just below—because we don’t take unnecessary risks. If the market gives us the opportunity, we’re ready to take it.
Patience is key here. Big moves, smart decisions that’s how you win. Let’s watch and see!
I keep my charts clean and simple because I believe clarity leads to better decisions.
My approach is built on years of experience and a solid track record. I don’t claim to know it all, but I’m confident in my ability to spot high-probability setups.
My Previous Analysis
🐶 DOGEUSDT.P: Next Move
🎨 RENDERUSDT.P: Opportunity of the Month
💎 ETHUSDT.P: Where to Retrace
🟢 BNBUSDT.P: Potential Surge
📊 BTC Dominance: Reaction Zone
🌊 WAVESUSDT.P: Demand Zone Potential
🟣 UNIUSDT.P: Long-Term Trade
🔵 XRPUSDT.P: Entry Zones
🔗 LINKUSDT.P: Follow The River
📈 BTCUSDT.P: Two Key Demand Zones
🟩 POLUSDT: Bullish Momentum
🌟 PENDLEUSDT.P: Where Opportunity Meets Precision
🔥 BTCUSDT.P: Liquidation of Highly Leveraged Longs
🌊 SOLUSDT.P: SOL's Dip - Your Opportunity
🐸 1000PEPEUSDT.P: Prime Bounce Zone Unlocked
🚀 ETHUSDT.P: Set to Explode - Don't Miss This Game Changer
🤖 IQUSDT: Smart Plan
⚡️ PONDUSDT: A Trade Not Taken Is Better Than a Losing One
💼 STMXUSDT: 2 Buying Areas
🐢 TURBOUSDT: Buy Zones and Buyer Presence
🌍 ICPUSDT.P: Massive Upside Potential | Check the Trade Update For Seeing Results
🟠 IDEXUSDT: Spot Buy Area | %26 Profit if You Trade with MSB
📌 USUALUSDT: Buyers Are Active

PEPE Looks bullish (1H)PEPE appears to be completing an ABC pattern, where wave B has formed a triangle.
We are looking for buy/long positions around the green zone.
Closing a daily candle below the invalidation level will invalidate this analysis.
For risk management, please don't forget stop loss and capital management
Comment if you have any questions
Thank You

PEPE/USDT 4-Hour Chart Analysis. PEPE is trading at 0.00001862, in a downtrend, moving away from the key Ichimoku Cloud resistance area.
Significant bearish momentum after breaking below 0.00002285 (key support turned resistance).
Immediate support at 0.00001732–0.00001700 (highlighted green area).
Strong demand area below at 0.00001641 (key level to watch for risk of further declines).
Nearest resistance: 0.00002285.
Key breakout levels for potential recovery: 0.00002360 and 0.00002690.
Stop loss: Located slightly below 0.00001641, protection against further declines.
Take profit zone: Above 0.00002831, targeting a significant correction towards the previous highs.
If PEPE sustains the 0.00001732–0.00001700 zone, expect a rebound towards:
Short-term target: 0.00002285.
Mid-term target: 0.00002690.
A breakdown below 0.00001641 could lead to further declines, testing lower unknown levels.
Maintaining caution below the Ichimoku Cloud zone is a must for longs.
Disclaimer: This analysis is for informational purposes only and does not constitute financial advice. Always conduct your own research and consult a financial advisor before making investment decisions.
For updates on other coins or personalized insights, feel free to reach out via DM.
@Peter_CSAdmin

PEPEUSDT AnalysisWhen our latest PEPEUSDT.P analysis( 1000PEPEUSDT.P: Prime Bounce Zone Unlocked ) was very accurate I wanted to check the chart again and sharing my thoughts with you.
Demand Zone: The price action indicates a clean demand zone where buyers previously stepped in.
Range Analysis: Using the recent swing high and low, the 0.5 Fibonacci retracement level aligns closely with the demand zone, strengthening its importance as a possible buyer zone.
Key Levels to Watch:
Demand Zone: Blue Box
0.5 Fibonacci Level: (0.022)
A confluence of these levels could attract buyer interest if the price retraces into this area.
Trading Plan:
Bullish Scenario:
Wait for the price to retest the demand zone.
Confirm with bullish price action, such as pin bars or engulfing candles, for a long entry.
Bearish Scenario:
If the price breaks below the demand zone and the 0.5 Fibonacci level, consider this invalidated. Look for new structures below.
Additional Notes:
Keep an eye on the volume; increased volume near these levels could signify stronger buyer activity.
Place stop losses below the demand zone for protection.
I keep my charts clean and simple because I believe clarity leads to better decisions.
My approach is built on years of experience and a solid track record. I don’t claim to know it all, but I’m confident in my ability to spot high-probability setups.
My Previous Analysis
🐶 DOGEUSDT.P: Next Move
🎨 RENDERUSDT.P: Opportunity of the Month
💎 ETHUSDT.P: Where to Retrace
🟢 BNBUSDT.P: Potential Surge
📊 BTC Dominance: Reaction Zone
🌊 WAVESUSDT.P: Demand Zone Potential
🟣 UNIUSDT.P: Long-Term Trade
🔵 XRPUSDT.P: Entry Zones
🔗 LINKUSDT.P: Follow The River
📈 BTCUSDT.P: Two Key Demand Zones
🟩 POLUSDT: Bullish Momentum
🌟 PENDLEUSDT: Where Opportunity Meets Precision
🔥 BTCUSDT.P: Liquidation of Highly Leveraged Longs
🌊 SOLUSDT.P: SOL's Dip - Your Opportunity
🐸 1000PEPEUSDT.P: Prime Bounce Zone Unlocked
🚀 ETHUSDT.P: Set to Explode - Don't Miss This Game Changer
🤖 IQUSDT: Smart Plan
⚡️ PONDUSDT: A Trade Not Taken Is Better Than a Losing One
💼 STMXUSDT: 2 Buying Areas

PEPE Pump to 120%📊 PEPE/USDT Analysis 💹
🔎 After a long period of consolidation 🤝, PEPE broke out of a major resistance 💥, showing strong bullish momentum 🚀.
🎯 Current target: 120% Profit 💰
📈 Key Levels:
🟢 Support Zone: $0.00001756 – $0.00001900
🔴 Resistance Zone: $0.00002776 – $0.00003400
⚠️ If momentum continues, we could see new highs soon 🌟.
💡 PEPE holders, are you ready for this ride? 🎢🐸

Prime Bounce Zone Unlocked!PEPE/USDT – Demand Zone and Fibonacci Confluence Setup
PEPE is approaching a demand zone that aligns with a key Fibonacci retracement level, suggesting a potential short-term reaction. However, due to the volatile nature of this asset, traders are advised to manage risk and confirm entry signals carefully.
Demand Zone Context : This level represents an area where buyers have previously shown interest, offering a potential opportunity for a bounce.
Fibonacci Alignment : The zone coincides with a significant retracement level (e.g., 0.618 or 0.786), providing added confluence and increasing the probability of a reaction.
Caution Points for PEPE/USDT
Volatility Risk : PEPE is a highly volatile token, making the demand zone more prone to false breakouts.
LTF Nature : This setup is based on lower timeframe (LTF) analysis, which lacks the robustness of high timeframe (HTF) zones.
Breakdown Potential : If the zone fails, the price could cascade to lower levels, underscoring the importance of a stop-loss.
Trading Plan for PEPE/USDT
Wait for Confirmation : Look for bullish signals, such as reversal candlestick patterns (hammer, bullish engulfing) or a surge in volume, before entering a position.
Use Tight Stop-Losses : Set your stop-loss just below the demand zone to limit downside risk.
Focus on HTF Trend : If the broader market trend is bearish, this level may act as a weak support, so proceed with caution.
Smaller Position Sizes : Trade with reduced size compared to higher timeframe zones to mitigate potential losses from volatility.
Summary
The PEPE/USDT demand zone and Fibonacci confluence provide a possible short-term setup for a bounce. However, the lower timeframe nature and inherent volatility of PEPE make risk management and confirmation critical for successful trading.
I keep my charts clean and simple because I believe clarity leads to better decisions. Trading doesn’t have to be overly complicated, and I enjoy sharing setups that have worked well for me.
My approach is built on years of experience and a solid track record. I don’t claim to know it all, but I’m confident in my ability to spot high-probability setups. It’s all about learning and growing together as traders, and I’m here to share what I see.
The markets can confirm what the charts whisper if we’re paying attention. I hope these levels help you as much as they’ve helped me in the past. Let’s see how this plays out!
My Previous Hits
🐶 DOGEUSDT.P: Next Move
🎨 RENDERUSDT.P: Opportunity of the Month
💎 ETHUSDT.P: Where to Retrace
🟢 BNBUSDT.P: Potential Surge
📊 BTC Dominance: Reaction Zone
🌊 WAVESUSDT.P: Demand Zone Potential
🟣 UNIUSDT.P: Long-Term Trade
🔵 XRPUSDT.P: Entry Zones
🔗 LINKUSDT.P: Follow The River
📈 BTCUSDT.P: Two Key Demand Zones
🟩 POLUSDT: Bullish Momentum

Building Momentum for a Potential Breakout!The meme coin sensation, PEPE, is showing signs of a powerful technical setup that could lead to significant upside in the near future. With the market sentiment improving and buyers stepping in at critical levels, PEPE is positioned to make a notable move. I will be looking for entries from blue box.
Key Factors to Watch:
🔑 Volume Surge: Keep an eye on a sudden spike in trading volume. This will signal that the bulls are gaining control.
📈 Bullish Price Action: Look for chart patterns like double bottoms, bullish pennants, or even a clean breakout above resistance levels.
🟢 Support Zones Holding: PEPE has shown resilience by bouncing off key support levels, indicating that buyers are defending these areas strongly.
With its strong community backing and improving technicals, PEPE is gearing up for a potential rally. If you're looking for high-risk, high-reward plays, this could be your chance to ride the wave.
👉 Stay tuned for real-time updates and actionable insights as PEPE sets the stage for its next big move!
I don’t clutter my charts with a mess of indicators that look like a toddler went wild with crayons. Clean, simple, and effective—that’s my style. Don’t believe me? Check out my hits below. 🎯
When it comes to trading, I’m all about confidence backed by experience. I’m not claiming to be the best (yet), but my results do most of the talking. Keep an eye on these levels—sometimes the charts quietly suggest what the markets will shout later. Let’s see how this ride unfolds together! 🚀
My Previous Hits
🐶 DOGEUSDT.P | 4 Reward for 1 Risk (or more if you’re bold).
DOGEUSDT.P: Next Move
🎨 RENDERUSDT.P | HTF Sniper Precision
RENDERUSDT.P: Opportunity of the Month
💎 ETHUSDT.P | Buyer Zone So Accurate You’ll Double Check
ETHUSDT.P: Where to Retrace
🟢 BNBUSDT.P | Buyer Zone Mastery (CZ vibes).
BNBUSDT.P: Potential Surge
📊 Bitcoin Dominance | Called it Like a Pro
BTC Dominance: Reaction Zone
Now sit back, relax, and watch the market do its thing. Or don’t, FOMO is real. 😉

#PEPE/USDT#PEPE
The price is moving in a descending channel on the 1-hour frame and sticking to it well
We have a bounce from the lower limit of the descending channel, this support is at a price of 0.00000780
We have a downtrend, the RSI indicator is about to break, which supports the rise
We have a trend to stabilize above the moving average 100
Entry price 0.00000811
First target 0.00000852
Second target 0.00000892
Third target 0.00000950

PEPE attempts to breakout !PEPE / USDT
another accumulation zone has been formed last few months and about to breakout !
Conditions:
If price will able to break and fix above the potential bull flag in my chart i see a strong bullish wave coming like the last one
Best of wishes

Pepe's bullish era is overOn the chart, as you can see PEPE has a liquidity pool at the bottom of the chart and is about to break the liquidity pool below the candles.
This bullish wave can be considered an internal structure and pullback.
By maintaining the red range, it can drop towards the demand range
Closing a daily candle above the invalidation level will violate this analysis
For risk management, please don't forget stop loss and capital management
Comment if you have any questions
Thank You

PEPE Is Looking SEXY MartyBoots here , I have been trading for 17 years and sharing my thoughts on PEPE .
Pepe is looking beautiful , very sexy chart for more upside
Very similar to Bigtime which is up nearly 30% today
Do not miss out on PEPE as this is a great opportunity
Watch videos for more details

PEPE/USDT technical analysis and trading plan by Blaž FabjanPEPE/USDT trading pair, here's a breakdown of the technical analysis and trading plan by Blaž Fabjan:
Symmetrical Triangle Formation:
There is a symmetrical triangle pattern highlighted. This is typically a continuation pattern that signals a breakout, either upward or downward, depending on which side breaks first.
Currently, the price is consolidating near the end of the triangle. A breakout is expected soon.
Support and Resistance Levels:
Immediate support: $0.000000807 (marked by a blue horizontal line). This is a key level to watch; if it breaks below, the price may retest lower support zones.
Next support: $0.000000766.
Key resistance: $0.000000886. This level represents a potential target for an upward breakout from the symmetrical triangle.
Higher resistance: $0.000000986, should the price breach the first resistance level.
Volume:
The volume bars are relatively lower in recent periods, but the volume could increase when a breakout occurs. Pay attention to a spike in volume confirming a breakout direction.
VMC Cipher-B Indicator:
The VMC Cipher indicator shows a bit of sideways movement in the momentum, with no strong divergences visible. Keep an eye on this to spot potential bullish or bearish divergence.
RSI (Relative Strength Index):
RSI is around 51.88, which indicates a neutral market. There’s no overbought or oversold signal, but the RSI may rise if there’s an upward breakout from the symmetrical triangle.
Stochastic RSI:
The Stochastic RSI is at 46.67, which is close to neutral but leaning slightly toward a potential upward crossover. This could indicate buying pressure may soon increase.
Potential Trading Plan:
Bullish Scenario (Breakout Upwards):
Entry point: If the price breaks above the symmetrical triangle resistance line and holds above $0.000000886 with increased volume.
Target: First target can be around $0.000000986. If strong momentum continues, higher targets may be set at key psychological resistance levels.
Stop-loss: Place a stop-loss just below the triangle support level, ideally around $0.000000807.
Bearish Scenario (Breakout Downwards):
Entry point: If the price breaks below the symmetrical triangle and the $0.000000807 support level with high volume.
Target: First target would be $0.000000766 and further down to $0.000000666 if the bearish momentum persists.
Stop-loss: Place a stop-loss above the resistance level of the symmetrical triangle, around $0.000000850.
Neutral/Consolidation Scenario:
If the price continues to move sideways and no clear breakout occurs, it’s best to wait and observe how the market reacts at these key levels.
Summary:
Watch for a breakout from the symmetrical triangle. A move above $0.000000886 with strong volume will likely result in a bullish continuation, while a breakdown below $0.000000807 signals bearish action. Keep an eye on the RSI and volume indicators to confirm momentum.

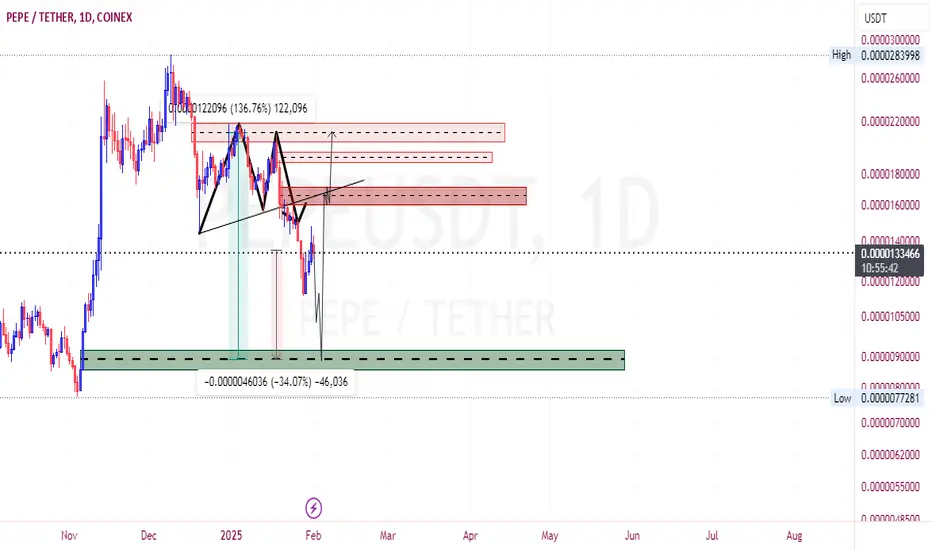
Do not miss the opportunity to buy PEPEAn internal pullback is underway from SW H to SW L.
The green area is strong support, we expect price rejection from this area upwards.
There is also a large liquidity pool under the candles that is expected to be swept soon.
Closing a daily candle below the invalidation level will violate the analysis.
For risk management, please don't forget stop loss and capital management
When we reach the first target, save some profit and then change the stop to entry
Comment if you have any questions
Thank You
