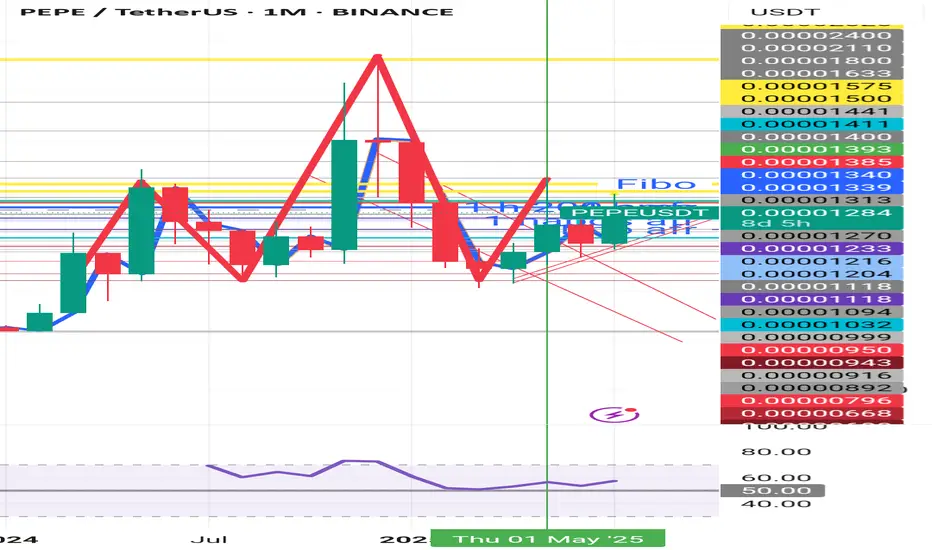
Is the alt season over at Pepe?PEPE
This is not a little suspicious to me. H&S is forming on a 1-month timeframe. I also discovered 4 divergences on a 4-hour timeframe looking back at the past few weeks, which may support my assumption that this is what the off-season was all about and a longer break may be in order.
PEPEUSDC
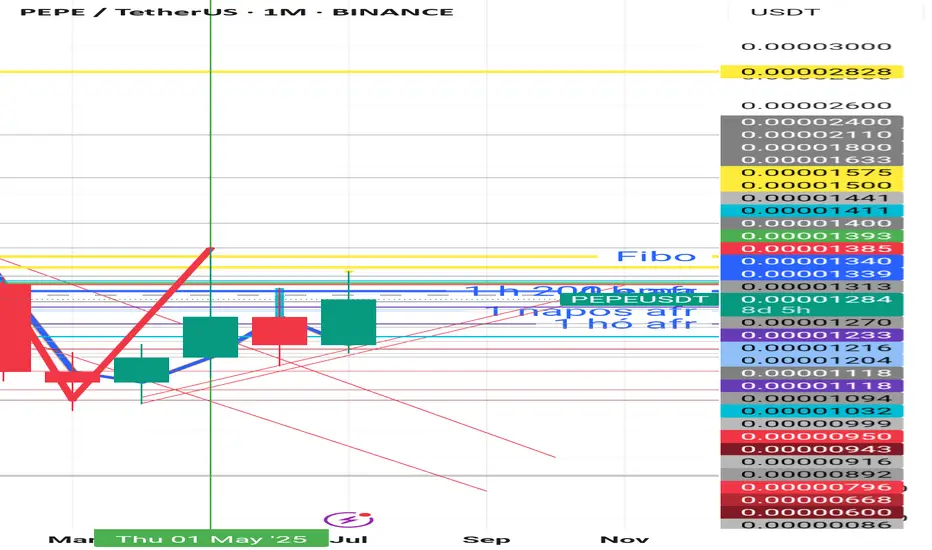
Was that all the offseason was for Pepe?PEPE
This is not a little suspicious to me. H&S is forming on a 1-month timeframe. I also discovered 4 divergences on a 4-hour timeframe looking back at the past few weeks, which may support my assumption that this is what the off-season was all about and a longer break may be in order.
PEPEUSD going to moon according to my analysis. {08/june/2025}Educational Analysis says that PEPEUSD may give trend Trading opportunities from this range, according to my technical analysis.
Broker - binance
So, my analysis is based on a top-down approach from weekly to trend range to internal trend range.
So my analysis comprises of two structures: 1) Break of structure on weekly range and 2) Trading Range to fill the remaining fair value gap
Let's see what this pair brings to the table for us in the future.
Please check the comment section to see how this turned out.
DISCLAIMER:-
This is not an entry signal. THIS IS FOR EDUCATIONAL PURPOSES ONLY.
I HAVE NO CONCERNS WITH YOUR PROFIT OR LOSS,
Happy Trading, Fx Dollars.

Pepe update hello friends✋️
Considering the drop we had, you can see that the price was well supported in the specified area and buyers came in. Now in the return of the price, we can buy step by step in the specified support areas and move with it until the specified goals, of course, with the management of shame and risk...
*Trade safely with us*

$PEPE follow up for June 2025Follow-up on my previous CRYPTOCAP:PEPE analysis — it played out exactly as expected.
CRYPTOCAP:PEPE remains my top meme coin, backed by some of the strongest tokenomics in the space. When altseason hits — if it hits — this one is primed to pump hard.
Like most altcoins right now, CRYPTOCAP:PEPE is in a short-term corrective pattern. That opens up another great opportunity to enter low and potentially ride a 2x or 3x move on the next leg up.
I’ve marked my usual buy zone. It may seem optimistic for now, but history shows how fast meme coins can dump… and then recover just as quickly. A drop into that green zone is entirely possible.
📲 Follow me for alerts — I’m monitoring CRYPTOCAP:PEPE daily. It’s one of my top picks.
DYOR.
Here was the previous analysis:
#PEPE #MemeCoin #Altseason #CryptoGems #BuyTheDip #Altcoins #CryptoTrading #Tokenomics #DYOR #CryptoAlerts
$PEPE looks ready to leap again!CRYPTOCAP:PEPE looks ready to leap again! 🐸
After its massive December 2024 rally, CRYPTOCAP:PEPE has undergone an equally strong correction — but signs suggest the bottom is in.
✅ Strong support at 0.0000700 and 0.0000650
✅ MACD stabilizing
✅ RSI showing a huge bullish divergence
Momentum is building — don’t lose sight of the frog! 🐸🚀
DYOR
#PEPE #Altcoins #CryptoTrading #BullishSetup #RSIDivergence #MemeCoinSeason #CryptoAlert #PEPEArmy
Don't miss today's signal.Hello friends
Given the good growth we had, the price has corrected and now we can buy in steps in the specified areas with capital and risk management and move with it to the set goals.
*Trade safely with us*

PEPE price analysisCRYPTOCAP:PEPE price has grown quite well over the past month.
Now the OKX:PEPEUSDT price, in our opinion, has reached a critical point from where it would be appropriate to correct a bit before continuing to grow:
1️⃣ correction to $0.0000100-0.0000105 can be considered “delicate”, which will only confirm the strength and serious further intentions of buyers.
2️⃣ correction to $0.0000084-0.0000085 can be considered “on the verge of a foul”, but the upward trend will continue and will not be broken.
3️⃣ or do you think there is no time for corrections, and we should continue to grow to ATH right now?
_____________________
Did you like our analysis? Leave a comment, like, and follow to get more

Is PEPE Ready for Its Next Leg Up? Key Support Levels to Watch! PEPE/USDT Analysis: Bullish Trend, Pullback, and Opportunity 🚀🐸
👋 Today, I’m taking a look at the PEPE/USDT chart. We’ve seen PEPE in a strong bullish trend lately, riding a strong momentum wave. Theres a shift at the moment when you look at the broader market—US dollar strength is still in play, and we’re seeing some pullbacks in Bitcoin and other major cryptos. 💵📉
PEPE is starting to pull back. This isn’t a bad thing—in fact, healthy pullbacks are what set up the next big moves. What I’m watching for is a retracement down into a key support zone. If price can hold there and we see a bullish break of structure, that’s my cue to look for a buy opportunity. 🛑➡️📈
The key here is patience. I want to see confirmation that buyers are stepping back in—i.e. strong bullish candles, a clear break of the recent lower high (BoS), or even a spike in volume. If we get that, I’ll be ready to ride the next leg up. Until then, I’m biding my time and letting the market come to me. 🕰️
Remember, no FOMO—let the setup come to you, and always manage your risk.🍀

PEPE 80% Profit🚀 BINANCE:PEPEUSDT just made a big move!
It surged from 0.00000820 to 0.00001244 and then corrected to 0.00000956 📉
Now it’s sitting on strong support — and if it holds, another rally could be on the way! 💥
🎯 Next resistance levels:
0.00001244 (recent high)
0.00001719 (next key level)
0.00002317 (major long-term target) 🏁
📌 Key support zones:
0.00000956 (current support)
0.00000820 (late May support)

#PEPE/USDT#PEPE
The price is moving within a descending channel on the 1-hour frame, adhering well to it, and is on its way to breaking it strongly upwards and retesting it.
We are seeing a bounce from the lower boundary of the descending channel. This support is at 0.00000570.
We have a downtrend on the RSI indicator that is about to break and retest, supporting the upward trend.
We are looking for stability above the 100 moving average.
Entry price: 0.00000700
First target: 0.00000751
Second target: 0.00000798
Third target: 0.00000871

PEPEUSDT - Now waiting for another 100% move.It already made a 100% move from the zone we mentioned earlier, breaking the downtrend line with a massive bullish candle on the 3-day timeframe.
It’s now on its way to forming a new all-time high (ATH).
Best regards Ceciliones 🎯

#PEPEUSDT: Ready to launch | Will price hit previous high? EPEUSDT’s price has accumulated and is currently in the distribution phase, where we can anticipate a bullish impulse pattern. There are three targets, but our long-term objective is for the price to surpass its previous record high. We anticipate the price to reach or even surpass the previous high.
Wishing you good luck and safe trading!
Thank you for your unwavering support! 😊
If you’d like to contribute, here are a few ways you can help us:
- Like our ideas
- Comment on our ideas
- Share our ideas
Team Setupsfx_
❤️🚀

PEPE : WHAT WE WANT?Hello friends
Given the good price growth, we see that we had a correction, which we found the support area using Fibonacci, and the price has returned from that area by buyers and is now in an ascending channel, which we expect to move to the specified targets.
Trade safely with us

PEPEUSDT - bottomed out!Pepe has dropped by more than 80% in the past period, making it one of the most heavily declining coins.
The coin is now sitting on a very strong key support level, so we expect a strong rebound in the coming days.

Market Update: Caution on $PEPEMarket Update: Caution on CRYPTOCAP:PEPE
There was hope. The consolidation looked exhausted, and a daily pump was forming.
Then Bybit got hacked , Bitcoin dumped, and now everything seems canceled.
⚠️ Warning: CRYPTOCAP:PEPE , despite being a solid and well-managed meme coin, is still a meme. Institutions appear to be selling off anything that looks like an animal in crypto.
What to Do Now?
✅ Wait for market stabilization— CRYPTOCAP:PEPE is at an attractive price, but it can drop much lower.
✅ Refill your bag at the bottom of the correction, not during dead cat bounces —unless you're a pro at trading bearish markets.
The Reversal Will Be EPIC! 🚀
This is temporary. Once the market bottoms out, the bounce could be massive. CRYPTOCAP:PEPE can do x2 or x3 in a month when sentiment improves!
🔍 DYOR

#PEPE/USDT#PEPE
The price is moving in a descending channel on the 1-hour frame and is adhering to it well and is heading to break it strongly upwards and retest it
We have a bounce from the lower limit of the descending channel, this support is at a price of 0.00000935
We have a downtrend on the RSI indicator that is about to break and retest, which supports the rise
We have a trend to stabilize above the moving average 100
Entry price 0.00000950
First target 0.000000960
Second target 0.00001000
Third target 0.00001047

#PEPE Bulls Ready for a Momentum Shift? Key Levels to Monitor Yello Paradisers! Is #PEPE about to break out of this falling wedge, or will the bears drag it lower? Here's why the next move could be game-changing for #PEPEUSD:
💎#PEPEUSDT has been trapped inside a falling wedge formation, steadily rejecting off its descending resistance. This pattern is historically bullish, but a breakout confirmation is still needed. Currently, PEPE is hovering near a key support zone between $0.0000060 and $0.000012, where buyers have previously stepped in.
💎A bullish divergence is forming on the histogram, signaling a potential shift in momentum. But for bulls to take control, PEPE must break above the descending resistance and reclaim $0.0000152 as support. If this level is cleared, we could see an explosive rally toward $0.000030, where strong selling pressure is expected.
💎However, if #PEPE fails to hold the $0.0000060 - $0.000012 support range, the bullish setup could get invalidated. A breakdown below this zone would expose lower levels and increase downside risk, potentially leading to a deeper sell-off.
The next few weeks will be crucial—will the bulls step up, or will PEPE break below and give the bears full control? Be patient and trade smart, Paradisers!
MyCryptoParadise
iFeel the success🌴

#PEPE/USDT#PEPE
The price is moving in a descending channel on the 1-hour frame and is adhering to it well and is heading to break it strongly upwards and retest it
We have a bounce from the lower limit of the descending channel, this support is at a price of 0.0.00000970
We have a downtrend on the RSI indicator that is about to break and retest, which supports the rise
We have a trend to stabilize above the moving average 100
Entry price 0.0.00000986
First target 0.000001013
Second target 0.00000103
Third target 0.000001068

PEPE price trading plan🐸 The OKX:PEPEUSDT price is moving quite nicely between the dynamic fib levels on the chart.
But given that in a few hours there will be an announcement of a “fresh” Fed rate (forecast of a decrease of -0.25%), the crypto market may be volatile!)
Therefore, we highlight the critical level of $0.0000184 for the CRYPTOCAP:PEPE price, from where:
🐳 if the price is kept above - growth according to the blue scenario, at least to $0.0000332
💔 in case of failure and breakdown, a protracted corrective red scenario will be activated, somewhere to around $0.0000106
What do you prefer?)

PEPEUSDT: Flash Crash? I’m Ready!PEPEUSDT isn’t looking too strong right now, big sell-offs, not great.
But here’s the deal: I’ve got my blue boxes lined up, and they’re solid. If a flash crash comes, those zones are where I want to meet the price.
This is a long-term play, folks. Smart levels, strong technicals, and a tight stop-loss just below—because we don’t take unnecessary risks. If the market gives us the opportunity, we’re ready to take it.
Patience is key here. Big moves, smart decisions that’s how you win. Let’s watch and see!
I keep my charts clean and simple because I believe clarity leads to better decisions.
My approach is built on years of experience and a solid track record. I don’t claim to know it all, but I’m confident in my ability to spot high-probability setups.
My Previous Analysis
🐶 DOGEUSDT.P: Next Move
🎨 RENDERUSDT.P: Opportunity of the Month
💎 ETHUSDT.P: Where to Retrace
🟢 BNBUSDT.P: Potential Surge
📊 BTC Dominance: Reaction Zone
🌊 WAVESUSDT.P: Demand Zone Potential
🟣 UNIUSDT.P: Long-Term Trade
🔵 XRPUSDT.P: Entry Zones
🔗 LINKUSDT.P: Follow The River
📈 BTCUSDT.P: Two Key Demand Zones
🟩 POLUSDT: Bullish Momentum
🌟 PENDLEUSDT.P: Where Opportunity Meets Precision
🔥 BTCUSDT.P: Liquidation of Highly Leveraged Longs
🌊 SOLUSDT.P: SOL's Dip - Your Opportunity
🐸 1000PEPEUSDT.P: Prime Bounce Zone Unlocked
🚀 ETHUSDT.P: Set to Explode - Don't Miss This Game Changer
🤖 IQUSDT: Smart Plan
⚡️ PONDUSDT: A Trade Not Taken Is Better Than a Losing One
💼 STMXUSDT: 2 Buying Areas
🐢 TURBOUSDT: Buy Zones and Buyer Presence
🌍 ICPUSDT.P: Massive Upside Potential | Check the Trade Update For Seeing Results
🟠 IDEXUSDT: Spot Buy Area | %26 Profit if You Trade with MSB
📌 USUALUSDT: Buyers Are Active

PEPEUSDT AnalysisWhen our latest PEPEUSDT.P analysis( 1000PEPEUSDT.P: Prime Bounce Zone Unlocked ) was very accurate I wanted to check the chart again and sharing my thoughts with you.
Demand Zone: The price action indicates a clean demand zone where buyers previously stepped in.
Range Analysis: Using the recent swing high and low, the 0.5 Fibonacci retracement level aligns closely with the demand zone, strengthening its importance as a possible buyer zone.
Key Levels to Watch:
Demand Zone: Blue Box
0.5 Fibonacci Level: (0.022)
A confluence of these levels could attract buyer interest if the price retraces into this area.
Trading Plan:
Bullish Scenario:
Wait for the price to retest the demand zone.
Confirm with bullish price action, such as pin bars or engulfing candles, for a long entry.
Bearish Scenario:
If the price breaks below the demand zone and the 0.5 Fibonacci level, consider this invalidated. Look for new structures below.
Additional Notes:
Keep an eye on the volume; increased volume near these levels could signify stronger buyer activity.
Place stop losses below the demand zone for protection.
I keep my charts clean and simple because I believe clarity leads to better decisions.
My approach is built on years of experience and a solid track record. I don’t claim to know it all, but I’m confident in my ability to spot high-probability setups.
My Previous Analysis
🐶 DOGEUSDT.P: Next Move
🎨 RENDERUSDT.P: Opportunity of the Month
💎 ETHUSDT.P: Where to Retrace
🟢 BNBUSDT.P: Potential Surge
📊 BTC Dominance: Reaction Zone
🌊 WAVESUSDT.P: Demand Zone Potential
🟣 UNIUSDT.P: Long-Term Trade
🔵 XRPUSDT.P: Entry Zones
🔗 LINKUSDT.P: Follow The River
📈 BTCUSDT.P: Two Key Demand Zones
🟩 POLUSDT: Bullish Momentum
🌟 PENDLEUSDT: Where Opportunity Meets Precision
🔥 BTCUSDT.P: Liquidation of Highly Leveraged Longs
🌊 SOLUSDT.P: SOL's Dip - Your Opportunity
🐸 1000PEPEUSDT.P: Prime Bounce Zone Unlocked
🚀 ETHUSDT.P: Set to Explode - Don't Miss This Game Changer
🤖 IQUSDT: Smart Plan
⚡️ PONDUSDT: A Trade Not Taken Is Better Than a Losing One
💼 STMXUSDT: 2 Buying Areas

PEPE Pump to 120%📊 PEPE/USDT Analysis 💹
🔎 After a long period of consolidation 🤝, PEPE broke out of a major resistance 💥, showing strong bullish momentum 🚀.
🎯 Current target: 120% Profit 💰
📈 Key Levels:
🟢 Support Zone: $0.00001756 – $0.00001900
🔴 Resistance Zone: $0.00002776 – $0.00003400
⚠️ If momentum continues, we could see new highs soon 🌟.
💡 PEPE holders, are you ready for this ride? 🎢🐸
