BOME vs PEPE - GMMA indicatorIn today’s update, I would like to discuss the comparison of GMMA indicator behavior on BOME in relation to what the GMMA indicator showed in the past on PEPE.
The comparative analysis revealed that on both PEPE and BOME:
We observe a local peak both in the price and on the GMMA indicator (the first blue drawn line on both GMMA indicators).
A local trough both in the price and on the GMMA indicator (the second blue drawn line on both GMMA indicators).
A local peak in the price and a peak on the GMMA indicator (the third blue drawn line on both GMMA indicators) – the peak on the indicator is lower than the previous peak marked in step one.
A local trough in the price and a trough on the GMMA indicator (the fourth blue drawn line on both GMMA indicators) – the trough on the indicator is higher than the previous peak marked in step one.
An upward move on the indicator to the orange average and a temporary shift to green, followed shortly by another significant drop below the orange average.
On PEPE, in step 6, we observe the final breakout above the orange average and the indicator turning green. This point was a high-quality moment to invest in PEPE.
On BOME, I anticipate a similar breakout above the orange average on the indicator and a color change from red to green.
From this point, dynamic increases should begin, reaching up to the 261.8 level measured from the global decline (from the March peak to the August trough).
The 261.8 level is around $0.068–$0.069.
Currently, BOME is consolidating around the maximum range of the corrective move driving the uptrend. It looks like an accumulation phase before a potential dynamic increase
PEPEUSDT

PEPE Analysis - What Shall we Expect !!!Pepe can go up to its previous price ceiling again and then drop.
Give me some energy !!
✨We spend hours finding potential opportunities and writing useful ideas, we would be happy if you support us.
Best regards CobraVanguard.💚
_ _ _ _ __ _ _ _ _ _ _ _ _ _ _ _ _ _ _ _ _ _ _ _ _ _ _ _ _ _ _ _
✅Thank you, and for more ideas, hit ❤️Like❤️ and 🌟Follow🌟!
⚠️Things can change...
The markets are always changing and even with all these signals, the market changes tend to be strong and fast!!


When can we buy PEPE?hello friends
Considering the strong upward trend experienced by this currency, we expected price correction from it.
Now that the price has been corrected, we have several buying opportunities:
1: In the same range, which is well supported by the price.
2: In case of further correction, the price of the lower ranges that we specified for you.
Be successful and profitable.

Pepe Coins: Predicting More Gain in Crypto’s Next WaveHello and greetings to all the crypto enthusiasts, ✌
In several of my previous analyses, I have accurately identified and hit all of the gain targets. In this analysis, I aim to provide you with a comprehensive overview of the future price potential for PEPE , 📚💡
This coin has become a top contender in the market, backed by a large, active community. Despite strong support and the overall bullish trend, it hasn't yet seen the same significant price increase as its competitors, which is unusual. 📚✨
The coin benefits from strong media attention, high trading volume, and a solid technical chart, all pointing to strong growth potential. These factors suggest a potential price increase of at least 54%. Considering the current market conditions, it presents a highly attractive investment opportunity. 📚🎇
🧨 Our team's main opinion is: 🧨
Backed by a strong community, high trading volume, and solid technical, this coin shows potential for a 54% price increase, making it a compelling investment.
Give me some energy !!
✨We invest countless hours researching opportunities and crafting valuable ideas. Your support means the world to us! If you have any questions, feel free to drop them in the comment box.
Cheers, Mad Whale. 🐋

PEPE Looks bullish (1H)PEPE appears to be completing an ABC pattern, where wave B has formed a triangle.
We are looking for buy/long positions around the green zone.
Closing a daily candle below the invalidation level will invalidate this analysis.
For risk management, please don't forget stop loss and capital management
Comment if you have any questions
Thank You

PEPE has broken out of its sideways channel PEPEUSDT has broken out of its sideways channel on the 1-hour chart with a strong volume candle, surpassing last week's high.
My first target is the identified area of interest. If you're not already in the trade, consider waiting for a pullback to the previous week's high before entering.
Always ensure you set a stop loss when entering a trade to manage your risk effectively.
REMARKS: DYOR
• This advice is NOT financial advice.
• We do not provide personal investment advice and we are not a qualified licensed investment advisor.
• All information found here, including any ideas, opinions, views, predictions, forecasts, commentaries, suggestions, or stock picks, expressed or implied herein, are for informational, entertainment or educational purposes only and should not be construed as personal investment advice.
• We will not and cannot be held liable for any actions you take as a result of anything you read here.
• We only provide this information to help you make a better decision.
• While the information provided is believed to be accurate, it may include errors or inaccuracies.
Good Luck and have fun,
The CryptoSignalScanner Team

PEPEUSDT %85 Daily Volume SpikeWe previously observed a 25% reaction from the blue box in PEPEUSDT, as mentioned in my earlier analysis. As you can see here:https://www.tradingview.com/chart/PEPEUSDT/VP77qwjf-PEPEUSDT-Flash-Crash-I-m-Ready/
If you utilized low-time frame market breakdowns, you could have caught some excellent risk-to-reward (RR) opportunities. From the latest blue box.
Currently, the price seems to be consolidating, and there is an 85% increase in trading volume today, which is significant. Despite my overall bullish outlook, I believe the price may seek lower levels before continuing its upward trajectory. This potential pullback could provide a new and favorable positioning opportunity.
How to create a position?
When price going down, sometimes CDV goes up, it means an opportunity if general outlook is bullish.
Sometimes we took a retest from volume profile "Point of Control" line and when we reach there we see huge buyers coming in Volume Footprint, it means you can look for an entry.
When trading the blue box, I will rely on indicators like:
Cumulative Delta Volume (CDV)
Liquidity Heatmap
Volume Profile
Volume Footprint
Additionally, I will look for upward market structure breaks in lower time frames for confirmation.
If you'd like to learn how to utilize CDV, liquidity heatmaps, volume profiles, and volume footprints effectively, feel free to visit my profile and contact me.
Best of luck and manage your risk wisely!
If you think this analysis helps you, please don't forget to boost and comment on this. These motivate me to share more insights with you!
I keep my charts clean and simple because I believe clarity leads to better decisions.
My approach is built on years of experience and a solid track record. I don’t claim to know it all, but I’m confident in my ability to spot high-probability setups.
If you would like to learn how to use the heatmap, cumulative volume delta and volume footprint techniques that I use below to determine very accurate demand regions, you can send me a private message. I help anyone who wants it completely free of charge.
My Previous Analysis (the list is long but I think it's kinda good : )
🎯 ZENUSDT.P: Patience & Profitability | %230 Reaction from the Sniper Entry
🐶 DOGEUSDT.P: Next Move
🎨 RENDERUSDT.P: Opportunity of the Month
💎 ETHUSDT.P: Where to Retrace
🟢 BNBUSDT.P: Potential Surge
📊 BTC Dominance: Reaction Zone
🌊 WAVESUSDT.P: Demand Zone Potential
🟣 UNIUSDT.P: Long-Term Trade
🔵 XRPUSDT.P: Entry Zones
🔗 LINKUSDT.P: Follow The River
📈 BTCUSDT.P: Two Key Demand Zones
🟩 POLUSDT: Bullish Momentum
🌟 PENDLEUSDT.P: Where Opportunity Meets Precision
🔥 BTCUSDT.P: Liquidation of Highly Leveraged Longs
🌊 SOLUSDT.P: SOL's Dip - Your Opportunity
🐸 1000PEPEUSDT.P: Prime Bounce Zone Unlocked
🚀 ETHUSDT.P: Set to Explode - Don't Miss This Game Changer
🤖 IQUSDT: Smart Plan
⚡️ PONDUSDT: A Trade Not Taken Is Better Than a Losing One
💼 STMXUSDT: 2 Buying Areas
🐢 TURBOUSDT: Buy Zones and Buyer Presence
🌍 ICPUSDT.P: Massive Upside Potential | Check the Trade Update For Seeing Results
🟠 IDEXUSDT: Spot Buy Area | %26 Profit if You Trade with MSB
📌 USUALUSDT: Buyers Are Active + %70 Profit in Total
🌟 FORTHUSDT: Sniper Entry +%26 Reaction
🐳 QKCUSDT: Sniper Entry +%57 Reaction
📊 BTC.D: Retest of Key Area Highly Likely
I stopped adding to the list because it's kinda tiring to add 5-10 charts in every move but you can check my profile and see that it goes on..


SHORT PEPE NOW! becauseAs in the chart attached to this article, the price of PEPE/USDT or 1000PEPE/USDT.P (for those trading the perpetual symbol, PEPE is currently on a downward movement on the daily, which is a clear sign of a downtrend. In this analysis, a perfect retracement of 79% on the FIB is at the place of interest, which has very high level of confluence which i can't go over in this article. But if you'd like to know how i got the accurate entry to this trade and more exactly like this, follow, and i'll interact with you. For now, enjoy this trade, and lets ride the wave together.
P.S: Don't forget to set your limit orders!
@realalvaritarfa

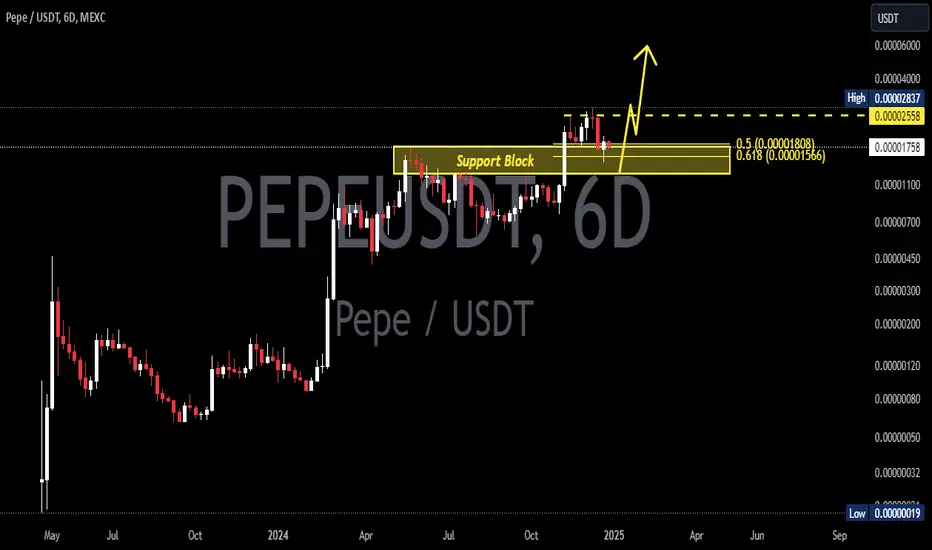
PEPEUSDT 6DPEPE Update ~ 6D
#PEPE So far it still maintains its bullish structure. Buy gradually within this support block,. it's only a matter of time these Memes will make new highs.
FLAVIA ready for fly , Similar to turboIt behaves exactly like turbo coin, the big holders accumulated a lot in the last two months, it seems that it can experience a significant growth.

Whether it can be supported and rise from BW(0) is the key
Hello, traders.
If you "Follow", you can always get new information quickly.
Please also click "Boost".
Have a nice day today.
-------------------------------------
(PEPEUSDT 1W chart)
The key is whether it can rise above the HA-High indicator point of 0.00001898.
To do so, the point to watch is whether it can be supported and rise near the M-Signal indicator on the 1W chart.
Accordingly, if it falls, you should check whether it can be supported near 0.00001463.
The strong support area is around 0.00000723.
-
(1D chart)
Since the BW(0) indicator was created at the 0.00001767 point, it is important whether it can be supported and rise around this area.
If it falls, it is important whether it can touch the M-Signal indicator on the 1W chart and rise.
In order to turn into a short-term uptrend, the MS-Signal (M-Signal on the 1D chart) indicator must rise above and maintain the price.
To do so, it must rise above 0.00001898 and be supported.
-
From this perspective, if it rises, the area around the M-Signal indicator on the 1D chart is likely to be the first resistance area, and the area around the M-Signal indicator on the 1W chart is likely to be the first support area.
------------------------------------------------
(1000PEPEUSDT.P 1D chart)
-
Thank you for reading to the end.
I hope you have a successful trade.
--------------------------------------------------
- Big picture
I used TradingView's INDEX chart to check the entire range of BTC.
(BTCUSD 12M chart)
Looking at the big picture, it seems to have been following a pattern since 2015 and has been rising.
In other words, it is a pattern that maintains a 3-year uptrend and faces a 1-year downtrend.
Accordingly, the uptrend is expected to continue until 2025.
-
(LOG chart)
Looking at the LOG chart, you can see that the uptrend is decreasing.
Accordingly, the 46K-48K range is expected to be a very important support and resistance range from a long-term perspective.
Therefore, it is expected that prices below 44K-48K will not be seen in the future.
-
The Fibonacci ratio on the left is the Fibonacci ratio of the uptrend that started in 2015.
In other words, it is the Fibonacci ratio of the first wave of the uptrend.
The Fibonacci ratio on the right is the Fibonacci ratio of the uptrend that started in 2019.
Therefore, it is expected that this Fibonacci ratio will be used until 2026.
-
No matter what anyone says, the chart has already been created and is already moving.
It is up to you how to view and respond to this.
If the ATH is renewed, there are no support and resistance points, so the Fibonacci ratio can be appropriately utilized.
However, although the Fibonacci ratio is useful for chart analysis, it is ambiguous to use it as support and resistance.
The reason is that the user must directly select the important selection points required to generate Fibonacci.
Therefore, since it is expressed differently depending on how the user specifies the selection points, it can be useful for chart analysis, but it can be seen as ambiguous to use it for trading strategies.
1st: 44234.54
2nd: 61383.23
3rd: 89126.41
101875.70-106275.10 (when overshooting)
4th: 134018.28
151166.97-157451.83 (when overshooting)
5th: 178910.15
-----------------

PEPE Analysis - What Shall we Expect !!!After breaking the ascending triangle, the price experienced significant growth. As you can see, the price has now dropped to the 0.618 Fibonacci line. Market volume indicates that the price may not be able to break above the 0.618 line, which means the price could drop to the 0.382 line before rising again.
Previous analysis
Give me some energy !!
✨We spend hours finding potential opportunities and writing useful ideas, we would be happy if you support us.
Best regards CobraVanguard.💚
_ _ _ _ __ _ _ _ _ _ _ _ _ _ _ _ _ _ _ _ _ _ _ _ _ _ _ _ _ _ _ _
✅Thank you, and for more ideas, hit ❤️Like❤️ and 🌟Follow🌟!
⚠️Things can change...
The markets are always changing and even with all these signals, the market changes tend to be strong and fast!!

PnutBINANCE:PNUTUSDT
📉 **PNUT Price Update**:
The current price of PNUT is at **0.6830**. If you're watching this coin closely, the **support levels** to keep an eye on are **0.65** and **0.60**. These are key levels where the price could bounce back if it dips. If the price manages to hold above these support levels, we could see the coin continue its upward movement. 🚀
📈 **Resistance Levels**:
If the price does hold at those support levels, the next resistance levels to watch out for are **0.75435** and **0.8453**. These are the price points where selling pressure could increase, potentially slowing or reversing the upward trend. 🔥
⚠️ **Not Financial Advice**:
Just a reminder, this isn't financial advice, so make sure to do your own research and trade wisely! 💡

PEPE - Hold box to go higherPEPE - Hold orange box to go higher. Which I think will happen if BTC behaves

Pepe/UsdtBINANCE:PEPEUSDT
### **Pepe Current Price: $0.00001630 💰 (Support Level)**
The current price of **Pepe (PEPE)** is at **$0.00001630**, which is a **key support level**. A **support level** is a price point where the coin is expected to find buying interest, preventing the price from dropping further. In simple terms, if the price stays above this level, it shows that buyers are willing to step in and prevent a decline.
If the price manages to hold **$0.00001630**, it suggests that there could be **potential for upward movement**, as long as it doesn't break below this level.
---
### **Resistance Levels and Trendline:**
- **Resistance at $0.00001764 🚀**:
The **first resistance level** is at **$0.00001764**. Resistance is the price level at which the coin may face selling pressure, as more traders might decide to sell, preventing the price from rising further. If the price reaches this point, it could face difficulty breaking above it, and it may consolidate or even drop back down.
- **Trendline Resistance Levels:**
- **$0.00001900 🔝**:
This is the first **trendline resistance**. If **Pepe** breaks through the previous resistance at **$0.00001764**, it might head towards the **$0.00001900** level. Trendlines act as visual indicators of where the price might struggle due to past price actions. If the price crosses this level, it might signal stronger bullish momentum.
- **$0.00002142 ✨**:
The next **trendline resistance** is at **$0.00002142**. If the price breaks through $0.00001900, the next barrier will be around this level. Here, the price might again face more selling pressure, and it could be a tough level to break if there is not enough buying interest.
- **$0.00002353 💥**:
The **final resistance** level is **$0.00002353**, which is the highest point in your analysis. If the price manages to surpass **$0.00002142**, it could then aim for this level. If it breaks this point, it may signal a major upward movement, as this could be the last major resistance preventing further gains.
---
**Note**: This is **not financial advice**. Always conduct your own research before making any trading decisions. 📊

1000PEPEUSDT.Phello friends
Due to the high growth of this coin, now that it has entered a correction, it has reached a very strong support area, from where we expect a higher ceiling.
Note that the price will increase if the support zone remains valid and does not break, so manage your investment and be careful...
This analysis is checked from a technical point of view.
Be successful and profitable.

PEPE/USDT 4-Hour Chart Analysis. PEPE is trading at 0.00001862, in a downtrend, moving away from the key Ichimoku Cloud resistance area.
Significant bearish momentum after breaking below 0.00002285 (key support turned resistance).
Immediate support at 0.00001732–0.00001700 (highlighted green area).
Strong demand area below at 0.00001641 (key level to watch for risk of further declines).
Nearest resistance: 0.00002285.
Key breakout levels for potential recovery: 0.00002360 and 0.00002690.
Stop loss: Located slightly below 0.00001641, protection against further declines.
Take profit zone: Above 0.00002831, targeting a significant correction towards the previous highs.
If PEPE sustains the 0.00001732–0.00001700 zone, expect a rebound towards:
Short-term target: 0.00002285.
Mid-term target: 0.00002690.
A breakdown below 0.00001641 could lead to further declines, testing lower unknown levels.
Maintaining caution below the Ichimoku Cloud zone is a must for longs.
Disclaimer: This analysis is for informational purposes only and does not constitute financial advice. Always conduct your own research and consult a financial advisor before making investment decisions.
For updates on other coins or personalized insights, feel free to reach out via DM.
@Peter_CSAdmin

Pepe drops 8%, further weakness expected: analysisPEPE’s price has dropped nearly 8% in the past 24 hours, days after reaching its all-time high on December 9. Momentum indicators, including the RSI at 33.3, show that PEPE is nearing oversold territory but has not yet hit the critical threshold of 30, leaving room for further correction.
Additionally, the 7D MVRV Ratio at -9.3% points to significant short-term holder losses, with historical data indicating a potential downside toward -12% to -15% before a rebound. Whether PEPE holds its key support at $0.0000188 or breaks lower will likely define its next major price movement.
PEPE RSI is currently at 25.87, reflecting a sharp decline since December 16. This indicates that the meme coin is approaching oversold territory, as its RSI nears the critical threshold of 30.
On the chart, the support at $0.0000188 is a critical level for PEPE price, as a breakdown below it could lead to further declines. If this support fails, PEPE may test $0.000017, with the potential to drop as low as $0.000011, representing a 47% correction from current levels.
This bearish outlook is reinforced by its EMA lines, which have formed a death cross as short-term EMAs cross below long-term EMAs, signaling continued downside momentum.
On the other hand, if PEPE price can regain positive momentum, it could challenge the resistance at $0.0000227.
A breakout above this level could open the door to further gains, with targets at $0.0000259 and potentially $0.000028 if the uptrend strengthens.

$PEPE update after this huge pump!We love CRYPTOCAP:PEPE —one of the coolest meme coins out there.
This pump was massive and unexpected. However, all indicators are now overheated. While forecasting a meme coin is always tricky (they can be influenced by exchanges or whales playing with the price), the chart is giving us signals.
I expect a correction as those who drove the pump may start selling to free up liquidity for other coins.
If indicators follow through, we’re looking at a correction down to 0.00001000-0.00001400 within the green box, making it a good entry point to capture the second part of altseason in Q1 2025.
With strong support at 0.00001000, it’s unlikely that CRYPTOCAP:PEPE will drop lower this cycle.
**DYOR**

Btc / UsdtBINANCE:BTCUSD
CRYPTOCAP:BTC is facing resistance at the upper trendline of the rising wedge pattern, indicating potential bearish pressure. A clear breakout or breakdown is required to determine the next direction.
Are you ready to explore altcoins?
Disclaimer : Not Financial advice

Pepe’s Path to ATH: Big Gains AheadHello and greetings to all the crypto enthusiasts, ✌
In several of my previous analyses, I have accurately identified and hit all of the gain targets. In this analysis, I aim to provide you with a comprehensive overview of the future price potential for PEPE , 📚💡
This coin has emerged as one of the most promising opportunities in the market, supported by a large and highly engaged community. Despite its strong backing and the overall bullish market trend, it has yet to experience the substantial price surge seen by many of its competitors, which stands out as a significant anomaly. 📚✨
Beyond media influence, which certainly contributes to its growing visibility, the coin benefits from high trading volume and a solid technical chart, both of which indicate a strong upward potential. These factors collectively suggest a clear path for a potential price increase of at least 32%. Given the current market dynamics, this makes the coin an exceptionally compelling investment opportunity. 📚🎇
🧨 Our team's main opinion is: 🧨
This coin stands out with a large, engaged community and strong market support, yet has not experienced the price surge of its competitors. With high trading volume, solid technical indicators, and a potential 32% price increase, it presents a compelling investment opportunity.
Give me some energy !!
✨We invest countless hours researching opportunities and crafting valuable ideas. Your support means the world to us! If you have any questions, feel free to drop them in the comment box.
Cheers, Mad Whale. 🐋
