Peipei in accumulation phase - Moon BoysPeipei in accumulation phase, soon take off, first target point - I don't know and you don't even. Sell when you take 1200% profit.
PEPEUSDT

Peipei broke out of accumulation zone - Time to load more PeiPeiPeipei broke put of accumulation zone. As you can see the 6 months accumulation has not broken out and PeiPei is going to start an ascending channel.

TradeCityPro | PEPE: Testing Resistance for a Potential Breakout👋 Welcome to TradeCityPro!
In this analysis, I’ll review PEPE, one of the most popular meme coins in the crypto space. This analysis focuses on the daily timeframe.
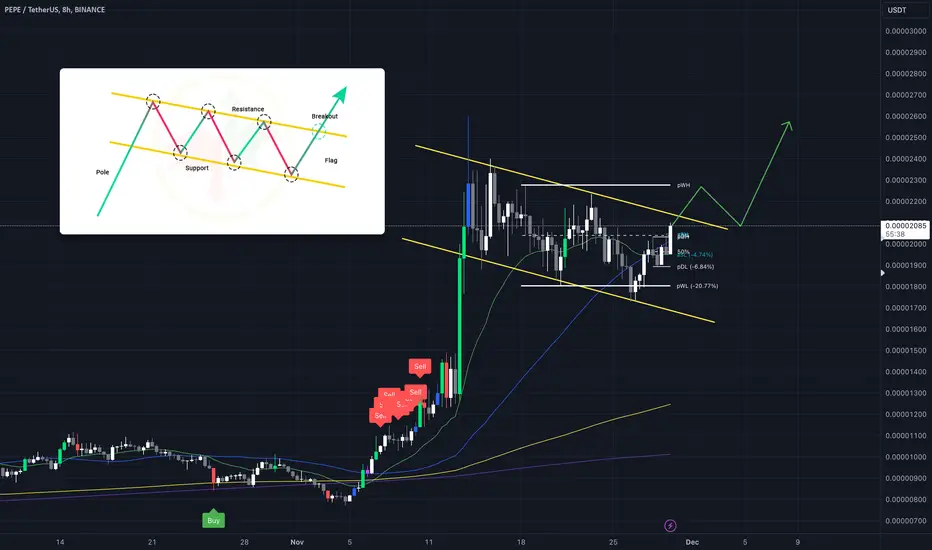
📅 Daily Timeframe: Consolidation and Breakout Potential
On the daily chart, the price has been consolidating within a long-standing range between 0.00000658 and 0.00001668. After breaking through the 0.00001292 resistance, significant volume and momentum entered the market, leading to a breakout above 0.00001668.
🧩 Currently, the price has formed a peak at 0.00002386, which it is now testing for the second time. A successful breakout above this level could spark a new bullish move.
✅ Based on monthly pivot points, the next targets for this upward movement would be 0.00002821 and 0.00003622. If the bullish momentum continues, the subsequent targets would be 0.00004647 and 0.00005448.
📈 If RSI stabilizes above the 70 level and buying volume resurges, the likelihood of breaking 0.00002386 increases.
📉 Support Levels in Case of a Pullback
🔽 The first key support is at 0.00001668, which has already been tested once during a correction.
🔴 If the price continues to decline, the next support level would be 0.00001292.
📝 Final Thoughts
This analysis reflects our opinions and is not financial advice.
Share your thoughts in the comments, and don’t forget to share this analysis with your friends! ❤️

PEPE/USDT: READY FOR A 100% RALLY!!🚀 Hey everyone! 👋
If this analysis excites you, hit that 👍 and follow for more high-value trade setups that deliver results! 💹
🔍 Technical Overview:
PEPE is primed for a major rally! Breaking out of a bull flag pattern on the 4-hour chart, it’s signaling an 80-100% upward move. The setup is strong, and the momentum looks unstoppable! 🔥
💸 Entry Range: CMP (Current Market Price) – Add more up to $0.022
🎯 Targets: 80-100% gains
📉 Stop Loss: $0.02
⚙️ Leverage: Use low leverage (max 5x)
💬 What’s your take on PEPE’s breakout potential? Are you seeing the same bullish momentum? Drop your thoughts, analysis, and predictions in the comments below, and let’s ride this wave together for massive profits! 🌊💰

Two Bullish Patterns Hint at Major Rally for PEPE !!!In the 4-hour time frame, as you can see, there are two bullish patterns. The first one is a triangle, and the second one is a H&S . If either of these patterns breaks, the price of PEPE can reach around 000026 .
Previous Analysis
Give me some energy !!
✨We spend hours finding potential opportunities and writing useful ideas, we would be happy if you support us.
Best regards CobraVanguard.💚
_ _ _ _ __ _ _ _ _ _ _ _ _ _ _ _ _ _ _ _ _ _ _ _ _ _ _ _ _ _ _ _
✅Thank you, and for more ideas, hit ❤️Like❤️ and 🌟Follow🌟!
⚠️Things can change...
The markets are always changing and even with all these signals, the market changes tend to be strong and fast!!

NEIRO USDTThis NEIRO trade aligns with multiple strong confluences:
1️⃣ Built on ETH, and with Ethereum breaking out, NEIRO should follow.
2️⃣ Daily trend holding firm as strong support.
3️⃣ Balanced price range below acts as a safety net.
4️⃣ Weekly support zone showing resilience.
5️⃣ Stop-loss placed just below BPR for added security.
How many more confluences do you need? 🚀 Let’s send it!

PEPE - Nice Bull FlagPEPEUSDT has formed a nice BULL flag.
If you are not in the trade yet wait for the breakout and retest.
!!! REMINDER !!!
Always pay attention to the signals when you're in a profitable trade. Secure your gains and consider re-entering on the next pullback.
Be Patient - Don't Panic - Trade Emotionless
Alikze »» DATA | Pullback to the descending channel is brokenIn the weekly time, with the failure of the sub-swing and the exit from the descending channel, if the pullback to the green box area or completes the main swing, it will have the ability to grow up to the specified supply area. Otherwise, this correction may continue until the sub-swing area
🟩Sup:0.048
⛳️Tp Red Box
»»»«««»»»«««»»»«««
Please support this idea with a LIKE and COMMENT if you find it useful and Click "Follow" on our profile if you'd like these trade ideas delivered straight to your email in the future.
Thanks for your continued support.
Sincerely.❤️

pepe buy!!!Hello friends, if the red line is fixed above, it can move until the specified targets.
Don't forget capital management.
good luck

PEPE / USDT : Primed for a breakout above resistance zonePEPE/USDT: Primed for a Breakout Above Resistance Zone
PEPE/USDT is showing signs of gearing up for a significant move 📈 as it approaches a key resistance level 📊. The price has been consolidating in a tight range, setting up an ideal scenario for a potential breakout 💥. If confirmed, this could ignite a strong bullish trend 🚀. Stay alert 👀 and watch for confirmation signals before making your move.
Key Insights:
1. Resistance zone: PEPE/USDT is nearing a crucial horizontal resistance level that has capped its upward movements previously. A breakout above this could open the door for substantial gains.
2. Volume surge: A noticeable increase in trading volume during the breakout will confirm buyer strength 🔥.
3. Bullish indicators: Technical tools like RSI and MACD are pointing towards bullish momentum ⚡, increasing the likelihood of a breakout.
Steps to Confirm the Breakout:
Wait for a solid 4H or daily candle closing above the resistance zone 📍.
Monitor for a spike in volume during the breakout, signaling robust buying activity 📊.
Look for a retest of the broken resistance as a new support zone to confirm the move ✅.
Be cautious of fake breakouts, such as sudden wicks above resistance followed by reversals ⚠️.
Risk Management Strategies:
Use stop-loss orders to protect your capital 🔒.
Position size carefully to align with your overall trading strategy 🎯.
This analysis is for educational purposes only and does not constitute financial advice. Always do your own research (DYOR) 🔍 before making any investment decisions.

Pepe: Long idea, potential 70%+ gainsPEPE presents a compelling long opportunity with the potential for substantial gains of 70% or more. It has recently shown strong recovery signs, indicating the possibility of a bullish continuation.

PEPEUSDT Long Tp 93% Sl - 18%PEPE Long Setup
Reason:
Breakout from trend line in HTF as well in LTF.
Took all possible Liquidity from down side.
Fundamentally created good hype, Technically and fundamentally looks super bullish.
All technical indicator suggesting a strong bullish wave up to at least 400% in spot.
Best Regards,
Crypto Panda
BINANCE:PEPEUSDT
BINANCE:1000PEPEUSDT.P
MEXC:PEPEUSDT.P

PEPE is about to breakout#pepe CRYPTOCAP:PEPE coin has broken the falling channel and retesting. A clear breakout will emerge a new pump session. Not financial advice.

PEPE new ATH is comingHello and greetings to all the crypto enthusiasts, ✌
In this analysis, I aim to provide you with a comprehensive overview of the future price potential for PEPE , 📚💣
Recent capital inflows into this stock have been both substantial and encouraging, reflecting a growing investor confidence and heightened market interest. This surge in investment activity signals a positive shift in sentiment regarding the stock’s future performance. Technically, the key layer Fibonacci support levels have remained intact, providing a solid foundation and reinforcing the strength of the current bullish trend. 📚🎇
Given the combination of strong investor backing and resilient technical support, the stock is poised for a potential breakout, with the prospect of surpassing historical highs and offering new opportunities for both short- and long-term investors, data shows at least 40% returns for investors, with potential for significant future growth. 📚💡
🧨 Our team's main opinion is:
Strong capital inflows and solid Fibonacci support levels signal growing investor confidence and a bullish outlook for the stock. With the potential for a significant upward move, the stock is well-positioned to reach new highs, offering opportunities for both short- and long-term investors.
Thank you for your attention. If you have any questions or comments, I’m here to respond to you. 🐋💡

PEPEUSD - Another Move UpPEPEUSD is in the process of its third strong move upwards
I'm not exactly sure of the % increase we will see but its happening.
Moves up are in the white rectangles
Meme coins are very volatile.
Daily chart

PEPE LONG TERM PATTERNPEPE has pulled back to a resistance level after a bullish trend with a classic pattern, the highest target could be the 0.618 Fibonacci level.

Building Momentum for a Potential Breakout!The meme coin sensation, PEPE, is showing signs of a powerful technical setup that could lead to significant upside in the near future. With the market sentiment improving and buyers stepping in at critical levels, PEPE is positioned to make a notable move. I will be looking for entries from blue box.
Key Factors to Watch:
🔑 Volume Surge: Keep an eye on a sudden spike in trading volume. This will signal that the bulls are gaining control.
📈 Bullish Price Action: Look for chart patterns like double bottoms, bullish pennants, or even a clean breakout above resistance levels.
🟢 Support Zones Holding: PEPE has shown resilience by bouncing off key support levels, indicating that buyers are defending these areas strongly.
With its strong community backing and improving technicals, PEPE is gearing up for a potential rally. If you're looking for high-risk, high-reward plays, this could be your chance to ride the wave.
👉 Stay tuned for real-time updates and actionable insights as PEPE sets the stage for its next big move!
I don’t clutter my charts with a mess of indicators that look like a toddler went wild with crayons. Clean, simple, and effective—that’s my style. Don’t believe me? Check out my hits below. 🎯
When it comes to trading, I’m all about confidence backed by experience. I’m not claiming to be the best (yet), but my results do most of the talking. Keep an eye on these levels—sometimes the charts quietly suggest what the markets will shout later. Let’s see how this ride unfolds together! 🚀
My Previous Hits
🐶 DOGEUSDT.P | 4 Reward for 1 Risk (or more if you’re bold).
DOGEUSDT.P: Next Move
🎨 RENDERUSDT.P | HTF Sniper Precision
RENDERUSDT.P: Opportunity of the Month
💎 ETHUSDT.P | Buyer Zone So Accurate You’ll Double Check
ETHUSDT.P: Where to Retrace
🟢 BNBUSDT.P | Buyer Zone Mastery (CZ vibes).
BNBUSDT.P: Potential Surge
📊 Bitcoin Dominance | Called it Like a Pro
BTC Dominance: Reaction Zone
Now sit back, relax, and watch the market do its thing. Or don’t, FOMO is real. 😉

PEPE ready to PUMP
PEPE Whale Activity Analysis: Insights from Whale Metrics and CUMULATIVE NET FLOW
Over the last few days, whale activity in PEPE has shown significant changes, as tracked by cumulative net flows and whale count data. Here’s a breakdown of the recent trends and their implications:
Cumulative Net Flow (25th-28th November)
25th November: -10.35 trillion PEPE
Modest outflows suggest minor accumulation or redistribution by whales.
26th November: -10.25 trillion PEPE
Outflows persist but remain within a controlled range.
27th November: -41.3 trillion PEPE
A massive jump in outflows suggests significant accumulation, potentially setting the stage for a bullish move.
Whale Count Changes
Whale count increased by 13 to 14 whales over this period.
This rise in whale count aligns with large-scale accumulation observed in the net flow data.
A growing number of whales often reflects confidence in the asset, as whales prepare for potential price movements.
Implications: Pump or Dump?
Bullish Case (Pump):
Accumulation Dominance:
The increasing negative net flow (cumulative outflows) indicates that whales are actively accumulating PEPE.
The rise in whale count further supports a bullish narrative, as whales typically accumulate before driving prices higher.
Prediction Based on Indicator Logic:
The indicator's Accumulation Signal highlights that this activity is likely to precede a price increase.
Key levels near the last retail liquidation zone could present optimal buying opportunities for retail traders.
Bearish Case (Dump):
No significant distribution signals have been detected, meaning the likelihood of a bearish dump is low for now.
If whale inflows spike and cumulative net flow turns positive, it would signal distribution, potentially leading to a price drop.
Key Observations
Accumulation Activity Surging:
The cumulative net flow dropping to -41.3 trillion on 28th November reflects aggressive accumulation, a strong indicator of bullish intent.
Whale Confidence Increasing:
The rise in whale count to 14 suggests that more significant players are entering the market, likely expecting upward price action.
Retail Liquidations as Entry Zones:
Retail liquidation zones are crucial for identifying levels where whales may push prices before continuing their accumulation or distribution cycles.
Strategy Recommendations
Monitor Accumulation Levels:
Look for buying opportunities near key retail liquidation levels.
Watch for Distribution Signals:
Stay cautious if cumulative net flows shift positive, indicating whales are offloading their holdings.
Conclusion
The significant accumulation activity over the past few days, combined with an increase in whale count, strongly supports a bullish outlook. However, traders should remain vigilant for any sudden shifts in whale behavior or retail liquidation signals to capitalize on market opportunities effectively.
🚀 Prepare for potential upward price momentum, with key support levels near recent retail liquidations!

PEPE - Chart looks cleanPEPE chart looks clean. It has retested and is now looking for a leg up. PEPE/USDT


PEPEMy plan for this trade is simple.
Take the previous lows, reclaim the support and we are off towards previous highs

Pepe: Pump or Dump ? Watch the Whales
Pepe coin, often the poster child for volatile meme coins, is showing signs of another major rally. Recent on-chain data, analyzed through our PEPE Whale Activity Indicator, highlights intriguing patterns of whale accumulation and distribution that may signal a bullish breakout is on the horizon.
Between November 10 and November 14, 2024: We saw a massive pump from PEPE, quite characteristically. On the 10th we saw an increase to 13 whale wallets followed by a 3 day drop off of 3 major whale wallets signaling a large selloff and price rally.
This Pump resulted in a final day of 1.1 trillion in PEPE being sold off.
Interestingly enough the following day we see a huge reinvestment of 4.7 Trillion PEPE back into cold wallets of large whales and an increase in our whale wallet count back up to 12 wallets.
On the 18th we see a whale increase to 13 whales as seen before the initial pump.
The Turning Point:
Fast forward 8 days, and the data reveals more bullish momentum:
The cumulative net flow has reached a -9.12 trillion PEPE, indicating that whales have been steadily withdrawing tokens from exchange wallets and transferring them into cold storage.
What This Means for Pepe
The current pattern is strikingly similar to earlier accumulation-distribution cycles that preceded significant price rallies:
Accumulation Phase:
The 4.7 trillion PEPE accumulation on November 14, coupled with increased whale numbers during the following minor price dips, suggests that whales are preparing for another potential pump.
Key Metrics to Watch
As Pepe enters this critical phase, traders should monitor these metrics closely:
Cumulative Net Flow: Continued negative net flow signals sustained accumulation and a potential price floor.
Whale Count Trend: A further decline in whale numbers could indicate the beginning of distribution, setting the stage for a pump.
Price-Volume Correlation: Watch for volume spikes, as they often confirm the onset of price momentum.
Conclusion: A Pump in the Making?
Pepe's current on-chain data suggests the market is entering a whale-driven accumulation-distribution cycle. The 4.7 trillion PEPE accumulation day on November 14, combined with the -9.12 trillion PEPE cumulative net flow.
For savvy traders, this could be a pivotal moment. Pepe is volatile, but with patterns aligning for another pump, now may be the time to prepare for the next big move. Will Pepe break out, or will the whales play another trick? Keep an eye on the charts—opportunity awaits.

#PEPE - Long Setup FormationBINANCE:PEPEUSDT looks like it forms some juicy lows for market makers to sweep
and fuel the next leg up
Will it use the closest demand zone for it, or will it need more liquidity below to have enough?
I expect sometime tomorrow to see the pivot for the next leg up so keep an eye on #PEPE to make sure you don't miss this long!
