1000PEPEUSDT: Crafting a Possible Head and Shoulders Symphony"PEPEUSDT is delicately composing what appears to be a head and shoulders pattern, a classic chart formation that often signals a significant shift in market sentiment. This potential pattern is capturing the attention of traders and analysts alike, hinting at an impending reversal in the current trend. As each part of the pattern comes into clearer focus, the anticipation builds, with market participants poised to respond to the unfolding narrative. This development in PEPEUSDT's chart could orchestrate a dramatic turn in its price trajectory, offering a compelling story for those attuned to the rhythms of the crypto market."
PEPEUSDT

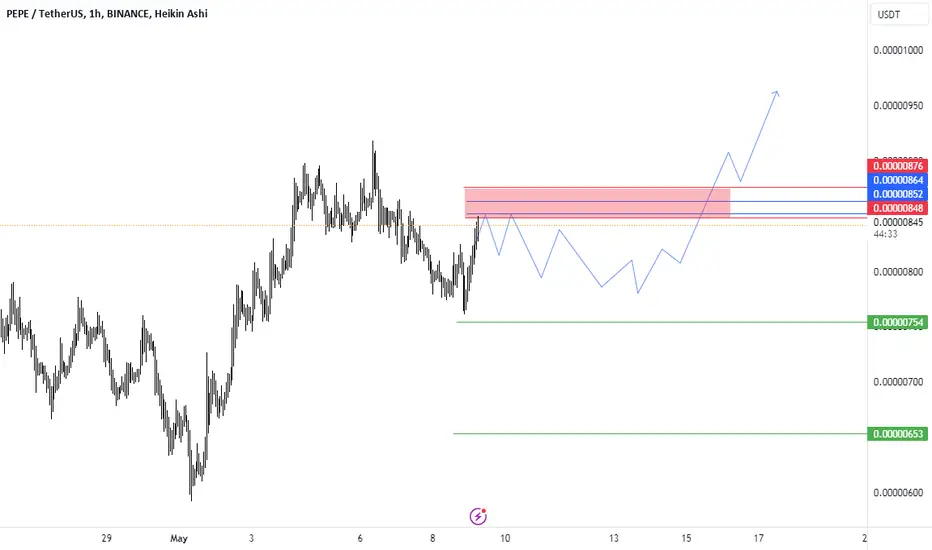
pepe → another rising wedge patternhello guys...
as I published before the green area worked great for this coin, you can check it here:
this coin made a rising wedge before and broke it down! now is forming another one if the blue area will break down (I mentioned it on the chart) you can get a long position!
otherwise, you can count on a bullish trend for this coin!
___________________________
✓✓✓ always do your research.
❒❒❒ If you have any questions, you can write them in the comments below, and I will answer them.
❤︎ ❤︎ ❤︎And please don't forget to support this idea with your likes and comment

PEPEUSDT.1DEvaluating the daily chart of PEPE/USDT, I can identify several important technical elements and trends that are key to formulating an investment or trading strategy.
Key Resistance and Support Levels:
Resistance 1 (R1): $0.0000946 - This is a significant level where the price recently peaked, indicating potential selling pressure at this price point.
Support 1 (S1): $0.0000580 - This level is acting as the immediate support where the price could potentially find a floor if it retraces.
Support 2 (S2): $0.0000387 - A lower support level that could come into play if there is a substantial breakdown below S1.
Support 3 (S3): Lower still, it acts as a further fallback should a significant selloff occur.
Technical Indicators:
Relative Strength Index (RSI): Currently at 56.99, the RSI suggests a slightly bullish momentum but still under the overbought threshold of 70, providing room for potential upward movement without immediate risk of reversal due to overbuying.
Moving Average Convergence Divergence (MACD): The MACD line is above the signal line but very close to it, indicating mild bullish momentum. However, the proximity to the signal line suggests that this could easily swing if market sentiments change.
Trend Analysis:
The chart shows a rising trend line, indicating an ascending support level that the price has been following. This pattern suggests that as long as the price remains above this trend line, the bullish outlook remains valid. However, the proximity of the price to this trend line also means that any break below could signal a change to a bearish trend.
Conclusion:
Based on the analysis of the PEPE/USDT chart, the market is currently showing signs of consolidation within a bullish trend, as indicated by the rising trend line and the RSI's position. A prudent strategy would involve monitoring the price action around the immediate support level at $0.0000850. If the price holds above this level, it could be an opportunity to buy with a target of R1 at $0.0000946, setting a stop loss slightly below the trend line to mitigate risk.
Should the price break below the trend line, it would be wise to reassess the bullish stance, as it could indicate a shift to a bearish trend, potentially targeting lower supports at S2 and S3. As always, monitoring volume and market news will be crucial in confirming these signals and adjusting strategy accordingly.

PEPE going to 0.0000075934I think a crash for the pepe cryptocurrency is underway, with the first TP (Take Profit) being 0.0000075934. The method of calculation is based on Gap, which is very accurate. The ascending gap must occur, followed by a descending gap, indicating that the ascending gap has occurred and the price drop is ready to happen.

🐸📈 PEPE Trading Analysis 🚀💡Market Observation:
Amidst the ongoing meme coin frenzy, PEPE appears to be consolidating for a potential upward movement. With a recent higher high and temporary shift in structure away from the downside, there's anticipation for a higher low formation.
Trade Setup:
Entry: Consider entering the trade between $0.00000650 - $0.00000725, aiming for a favorable risk-reward ratio.
Take Profit: Set profit targets at $0.000011 and $0.000013 to capture potential upside movement.
Stop Loss: Place the stop loss at $0.000006 to manage risk effectively.
📊🚀 Monitor PEPE's price action closely for trade execution! #PEPETrading #CryptoAnalysis 🌐💰

Nothing!!Observation: Broken from below of downtrend, currently forming a downtrend, expecting things to continue going downwards until we reach the price of 0.00000750 on PEPE.

BRETT/USDT PEPE’S best friend on BASEBYBIT:BRETTUSDT.P
This idea has a long-term profit target.
All targets are indicated on the graph.
- Risk 1-3% on deposit
- R/R min 1/2
[ b]P.S (This is not an investment recommendation, this is my personal opinion.)

Pepe's Bullish Scenario. This run is not over yet. #PEPEThis run is not over yet. Pepe has been consolidating for some time in what is looking like a massive bull flag. The upside from, if this LTF IHS as well as the HTF flag plays out, is very very large. I am VERY BULLISH PEPE. THIS IS NOT FINANCIAL ADVICE.

PEPE Out of the flagMy previous setup for PEPE was correct, but i got stopped out due to an early entry. Pepe actually broke up from a bull flag after a break of major trendline, and i think we could see a continuation of the pump after a retest of the support zone at $0,..73. First target the resistance level at $0,..83

PEPEUSDT#pepe CRYPTOCAP:PEPE token chart update: It has formed a wedge pattern. Breaking the resistance of the downward trend, it has confirmed the upward momentum. We may see a nice pump and rise upwards.

PEPE: sel if beark support📊Analysis by AhmadArz:
🔍Entry: 6707
🛑Stop Loss: 6987
🎯Take Profit: 6501 - 6253 - 5884
🔗"Uncover new opportunities in the world of cryptocurrencies with AhmadArz.
💡Join us on TradingView and expand your investment knowledge with our five years of experience in financial markets."
🚀Please boost and💬 comment to share your thoughts with us!

PEPE ANALYSIS (4H)A supply limit has been reached.
The PEPE structure is bearish (due to bearish CH and lower H and L on the chart).
But it has cleared important resistances. This point makes us look for buy/long positions on important supports.
If it reaches the red range, you can look for sell/short setups.
The targets are clear on the chart.
Closing a daily candle above the invalidation level will violate the analysis.
For risk management, please don't forget stop loss and capital management
When we reach the first target, save some profit and then change the stop to entry
Comment if you have any questions
Thank You

PEPE - DOWNTREND, another DUMP coming 📢📢 PEPE-USDT📢
PEPE has seen an amazing bull cycle, increasing 800% parabolically over a few week. It's safe to say that just from this fact, a bear market is up next and we can already see the sins of an early bear market starting.
Our highly accurate technical indicator is showing that the bullish phase is long over, flashing a "SELL" signal a few candles back:
When we start to trade UNDER the green trendline, the price turns bearish and the trendline will now become red. For now, at least, it seems as though altseason may be over.
_______________________
📢Follow us here on TradingView for daily updates📢
👍Hit like & Follow 👍
CryptoCheck
BINANCE:PEPEUSDT

BONK - FAKE TRIANGLE PATTERN ! Be aware HAMSTERS 🐹!!!BONK is currently trading within a symmetrical triangle pattern on the 1-hour timeframe. This pattern is characterized by converging trendlines connecting a series of price highs and lows, creating a triangle shape. Symmetrical triangles are often considered continuation patterns, suggesting that the price is likely to break out in the direction of the prevailing trend.
Downward Breakout and Imbalance:
BONK has recently experienced a downward breakout from the symmetrical triangle pattern. This breakout suggests a potential shift in momentum towards the bearish side. However, it is important to note that false breakouts can occur, and further price action is needed to confirm the breakout's validity.
Unfilled Imbalance:
Within the symmetrical triangle pattern, there is an unfilled imbalance zone between $0.55 and $0.60. This imbalance represents a price area where there is a higher concentration of sell orders compared to buy orders. Imbalances can act as magnets, pulling the price towards them to fill the excess orders.
Potential Retest and Bullish Breakout:
Given the downward breakout and unfilled imbalance, two scenarios could unfold:
1. Retest of 0.5 Imbalance Level:
The price could retest the 0.5 Fibonacci retracement level of the imbalance, around $0.575. This retest could serve to shake out weak hands and accumulate liquidity before a potential reversal.
2. Breakout of Symmetrical Triangle:
If the price can hold above the 0.5 imbalance level and reclaim the symmetrical triangle pattern, it could signal a resumption of the uptrend. A potential target for the breakout would be the $0.70 resistance level.
Significance of False Breakouts:
False breakouts of symmetrical triangles are often considered bullish continuation patterns. This is because they can shake out weak hands and trap liquidity on the wrong side of the market, potentially fueling a subsequent breakout in the opposite direction.
Overall Outlook:
BONK's price action suggests a potential breakout from the symmetrical triangle pattern, with the possibility of a retest of the 0.5 imbalance level before a potential bullish continuation. While a downward breakout has occurred, false breakouts are common in this pattern, and further price action is needed for confirmation.

PEPE Following the setupI shared this setup for PEPE some days ago. Actually it's following pretty well and it's trying to bounce from mid term support zone. If this support hold, i think we will see a pump and a reclaim of the resistance area at 0,..8. R:R is pretty good to enter now

PEPE Elliott Wave TakeIf you find this information inspiring/helpful, please consider a boost and follow!
#PEPE
Not sure what this company does.
If it prints an impulse, I'm interested.

PEPEUSDT.1DOn the daily chart for PEPE (PEPE/USDT), we can observe that the price action is confined within a descending channel pattern, highlighting a downtrend with lower highs forming along the resistance line. The current price is near $0.0000745.
The chart shows resistance (R1) at approximately $0.0000946. If the price were to break above this level, it could signal a potential shift in market sentiment, possibly leading to a trend reversal. Support (S1) is set around $0.0000387, suggesting a critical level where the price has previously found buyers.
The RSI is near neutral at 56.23, indicating that the market isn't in an overbought or oversold condition. The ADL (Advance Decline Line) indicator shows a slight incline, which could be interpreted as accumulation despite the price decline, but this requires further confirmation.
Traders may consider looking for buy signals if the price approaches S1 and shows signs of a bounce, potentially targeting R1 as an initial take-profit level. Conversely, a break below S1 could suggest further declines and might be taken as a bearish signal. As always, confirmatory indicators and volume should be taken into account to validate any potential trading signals.

Trending Up or Correcting Down?"PEPE is in an interesting position on the 1-hour chart. It's in a slow uptrend and has recently pushed past a key resistance level that had been keeping the price down. This move up is backed by high trading volume, which signals strong interest from traders.
The technical indicators, when taken together, show a market that’s cautiously optimistic. The Bollinger Bands suggest some volatility with room for the price to move within the current range, and PEPE is managing to stay above a key moving average, a typical sign of bullish behavior. The MACD indicates a neutral momentum, meaning there's no strong push in either direction right now, so the price could swing either way.
However, the Stochastic Oscillator hints at the possibility that the recent price rise might cool off a bit, as it's not signaling a clear continuation of the uptrend. Similarly, the RSI is neutral but leaning toward bullish, suggesting the uptrend could go on but maybe not with much force.
Putting all this together, PEPE looks like it's trying to establish a new, higher price range. Traders might be expecting the coin to stabilize above the level it’s just passed, but the mixed signals from the indicators suggest it’s a delicate balance. A further price increase could happen if the market gets more bullish news or sentiment to drive it, but there's also a chance of a slight pullback to test the new support level before any significant move up.
Enjoyed the analysis? Don’t forget to hit like, drop a comment with your thoughts, and share it with your friends.

PEPE: Wait-and-seeThere’s a clear pattern of the price touching these points and reacting to them. Recently, the price dipped below what we thought was a solid floor, or support level, but then it made a comeback, rising above it again.
The extra tools we use to predict where the price might go next are giving mixed signals:
The MACD, which helps us see the momentum, is almost flat, meaning there's no strong push in either direction right now.
The volume, which shows how much PEPE is being traded, is pretty steady – nothing unusual there.
The price is currently below the simple moving average (SMA), hinting that the trend might be more down than up.
The Bollinger Bands, which help us understand if the price is moving a lot or a little, are not squeezing or expanding too much. That means we’re not expecting any sudden jumps or drops.
The Stochastic and RSI are like thermometers for buying and selling pressure. Right now, they’re in the middle, not showing any extreme heat (buying) or cold (selling).
So, what’s the bottom line? The market isn’t showing a clear direction for PEPE at this moment. It’s more in a wait-and-see phase. It could swing either way, and we’ll need more clues from the market to see a solid trend.

CRYPTOHOPPER WEBHOOK PEPEUSDT 45MIN RSI WITH CONDITIONS STRATEGYRSI Strategy with EMA and VWMA Conditions
Objective
This trading strategy leverages the Relative Strength Index (RSI) in combination with the Exponential Moving Average (EMA) and the Volume Weighted Moving Average (VWMA) to identify potential buy and sell signals for trading cryptocurrencies on the Cryptohopper platform.
How it works:
Buy Signal: A buy signal is generated when the RSI crosses above the user-defined lower threshold and the EMA (9) is above the VWMA (20).
Sell Signal: A sell signal is generated when the RSI crosses below the user-defined upper threshold.
Indicators Used:
RSI: A momentum oscillator that measures the speed and change of price movements.
EMA (9 period): A moving average that places a greater weight and significance on the most recent data points.
VWMA (20 period): An average that also accounts for volume, giving more weight to periods with higher volume.
How to Set Up Alerts for Webhooks:
To create alerts that can be sent as webhooks to Cryptohopper, follow these steps:
Apply the script to your TradingView chart.
Click on the 'Alerts' icon on the right-hand side toolbar.
Choose the script from the dropdown in the 'Condition' field.
You will see two options: "Buy Alert for Webhooks" and "Sell Alert for Webhooks".
Select the desired alert condition.
In the 'Options' section, set the alert action to 'Webhook URL'.
Enter your Cryptohopper webhook URL into the 'Webhook URL' field.
Configure the alert message according to the format required by Cryptohopper.
Save the alert.
How Alerts Are Generated:
The script will continuously monitor the chart based on the conditions you've set.
When a condition for either a buy or sell signal is met, TradingView will trigger the alert.
If set up for a webhook, TradingView will send an HTTP request to the specified webhook URL with the message payload.
Disclaimer:
This script is for educational purposes and should not be taken as financial advice. Trading cryptocurrencies carries a high level of risk, and you should do your own research or consult a financial advisor before making any investment decisions.

PEPE ANALYSIS🔮 PEPE Analysis - Breakout Trading 💰💰
🌟🚀 #PEPE was trading in a Bullish Flag Pattern in daily time frame and breakout the pattern. We can expect a long rally as a retest has been done already #PEPE.💲💲
🔖 Current Price: $0.00000785
⏳ Target Price: $0.00001081
⁉️ What to do?
- We have marked crucial levels in the chart . We can trade according to the chart and make some profits. 🚀💸
#PEPE #Cryptocurrency #Breakout #DYOR

long PEPEPEPE bounced off the support level and broke through the descending trendline. Bullish movement to previous high is expected to happen.
