pepeSupport and press the rocket to cheer me up
Observe the ten percent loss limit
Stay away from Bitcoins
Feel free to buy and sell and post your comments
PEPEUSDT

PEPE: Resistance WatchOur technical analysis of PEPE on Binance showcases the emergence of bullish momentum as evidenced by the recent positive crossover in the MACD and an RSI climbing above the midpoint, signaling increasing buying pressure. The trading volume appears robust, adding credibility to the recent price movements.
However, price action indicates that PEPE is encountering a strong resistance zone, hinting at a consolidation phase before any potential breakout. Traders should keep an eye on this level as a sustained push above could validate the bullish scenario.
It's also important to monitor Bitcoin’s market movements, as a downturn in the leading cryptocurrency may adversely affect the altcoin markets, including PEPE, potentially reversing recent gains.
The market presents a cautious optimism for PEPE, with key technical indicators tilting towards the bulls, yet the looming resistance and external market influences call for a measured approach.
Enjoyed the analysis? Don’t forget to hit like, drop a comment with your thoughts, and share it with your friends.

#PEPE movement plan for the dayHere's my plan for the next 2 trades on the 1H for #PEPE
Trade 1:
Entry: 0.0074945
TP: 0.0066636
SL: 0.0076908
Trade 2:
Entry: 0.0066676
TP: 0.0082334
SL: 0.0063920


PEPE Pullback!Let's try making some money with PEPE going down, That way we can load up more for the actual bullrun!
I'm not a financial advisor!
But if you follow my charts I suggest you put a tight SL on everything
I'll make it simple
White line is resistance, you can take profit here and I normally do because it just bounces down and I add more on the way down
All green lines are closing targets, the closer they are the higher chance they have of hitting, do this at your discretion, but I'd advise 50% first target and split the rest with the other two line, however there is a risk that it won't go any higher

PEPE Bounces off Support, Sign of Recovery or a Bullish Fakeout?Over the past 48 hours, BINANCE:PEPEUSDT has shown significant volatility on the 4-hour chart, catching the attention of cryptocurrency traders and analysts.
The technical indicators present a nuanced picture of PEPE’s future movements. The 9 Exponential Moving Average (EMA) trended downwards, while the 20 EMA also decreased, suggesting a bearish sentiment in the market. The Moving Average Convergence Divergence (MACD) values, with the histogram showing slight decreases over the period, reinforce this bearish outlook. The MACD line has been below the signal line, indicating potential selling pressure.
The Relative Strength Index (RSI) hovered around the 30 to 36 range, suggesting that PEPE was nearing oversold territory but had not fully entered it. This could indicate a potential reversal or bounce in the near term if buyers regain interest.
Considering the current technical setup and market sentiment, traders might observe the following levels for potential entry and exit points. For bullish traders, a potential entry point could be around the support levels of $0.00000552, with more aggressive buying near $0.00000395 or even $0.00000271 if the price were to dip further, aiming for a bounce back towards resistance level at $0.00000806. Conversely, bearish traders might consider short positions near these resistance levels, targeting exits around the aforementioned support levels, especially if the price fails to break through the resistance.
In summary, the Pepe price’s current technical analysis suggests a bearish outlook in the short term, with potential for reversal if key support levels hold. Traders should closely monitor volume, MACD, and RSI indicators for signs of a shift in market sentiment. As always, it's crucial for traders to set appropriate stop-loss orders to manage risks.

PEPEUSDT.4HThis 4-hour chart of PEPE/USDT illustrates several technical analysis components:
Ichimoku Cloud: The price is below the Ichimoku Cloud, suggesting a bearish trend. If the price remains below the cloud, this trend is likely to continue.
Support (S1): The chart identifies a support level at 0.00000631 USDT, which could be where buyers may step in if the price declines further.
Resistance (R1, R2, R3): There are three resistance levels plotted, with R1 at 0.00000949 USDT being the closest to the current price. Breaking above R1 could signal a potential reversal or bullish trend.
Zig Zag Indicator: This is likely used to identify price trends and reversals by filtering out minor price changes.
RSI: The Relative Strength Index is around 40, which is neither oversold nor overbought. This suggests that the price has room to move either way without immediate pressure from RSI levels.
MACD: The Moving Average Convergence Divergence is showing the signal line above the MACD line, indicating bearish momentum. However, the histogram is small, suggesting that the momentum is not strong.
Conclusion:
The overall trend seems bearish due to the price's position below the Ichimoku Cloud. If considering entering a trade, one might wait for bullish signals, such as a crossover in the MACD or an RSI heading towards overbought levels, indicating increased buying pressure. Given the identified support and resistance levels, a trader might set a buy order near the support level with a stop loss placed just below it to minimize potential losses. Conversely, if looking to sell, setting a target around the resistance level R1 could be prudent, with an eye on the price action for any breakout above this level that could invalidate the bearish outlook. Always consider combining technical analysis with market news and sentiment when making trading decisions.

Analyzing the Ascending ChannelPEPE presents an intriguing landscape as we delve into the 4-hour chart on Binance. Currently trading at 0.00000860, PEPE appears to be in a classic ascending channel, showcasing a bullish trend that started at the beginning of March.
Current Resistance: The channel's upper boundary remains undefined, as PEPE hasn't met a dynamic resistance that has been tested multiple times. This implies that while we have our eyes set on the last known resistance level, the market is yet to determine a solid ceiling for PEPE's rally.
Trend Analysis: The blue ascending line has been a consistent ally to buyers, offering a strong trend line that has supported the price from the beginning of March. This line serves as a dynamic support, which could be a reliable touchpoint for future price actions.
Bollinger Bands: The price oscillating between the bands, with recent activity closer to the middle, suggests a stabilization period following some volatility.
Volume: At 5.896T, the volume shows there's significant interest in PEPE, which sustains the validity of price movements.
SMA: PEPE is trading close to the SMA, indicating that the price is currently at equilibrium in terms of the average market sentiment over the recent period.
MACD: The MACD line is slightly above the signal line but with the histogram trending downward, signaling that bullish momentum may be waning.
RSI: The RSI at 53.12 suggests that the asset is neither overbought nor oversold, providing no immediate indications of a trend reversal.
In the practical sense, the key things to watch are the reactions to the ascending trend line for continued support and any formation of a clear resistance level. Breaks below or above these could signify a shift in market dynamics.
It is also crucial for traders to keep an eye on volume as a confirmation of trend strength. A continued high volume could indicate sustained interest, while a drop-off might suggest a potential decrease in momentum.
In conclusion, while PEPE's path seems clear in its upward trajectory, the absence of a defined resistance zone invites cautious optimism.
Enjoyed the analysis? Don’t forget to hit like, drop a comment with your thoughts, and share it with your friends.

PEPE Drops Cools Down, but Its Decline May Not Be Over YetIn the latest trading sessions on the 4-hour chart, BINANCE:PEPEUSDT has exhibited significant price movements, with closing prices oscillating between $0.00000699 and $0.00000769. The pair's recent dynamics suggest a battleground between bulls and bears, as evidenced by the variable closings around crucial technical levels.
The trends of the 9 Exponential Moving Average (EMA) values have decreased along with the 20 EMA, resulting in a bearish crossover. Such movements often indicate a potential shift in market sentiment from bullish to bearish.
MACD (Moving Average Convergence Divergence) indicators further confirm the bearish outlook. The MACD values have progressively decreased, highlighting an increased bearish momentum, as seen by the widening gap between the MACD line and the signal line across the past 48 hours. This is underscored by negative histogram values, which suggest a strengthening of bearish momentum.
The Relative Strength Index (RSI), hovering between 31.74 and 39.18, signals that PEPE is nearing oversold conditions. This could potentially attract buying interest if the asset dips further, though it remains essential to monitor for any shifts in RSI levels that may suggest a reversal or continuation of the current trend.
The Pepe price faces immediate resistance at $0.00000782, followed by more significant levels at $0.00000806 and $0.00000897. A break above these levels could signal a shift towards a bullish market sentiment. Conversely, support levels at $0.0000067, $0.00000552, and $0.00000395 are crucial for bulls to defend to prevent further downside risks.
Given the current bearish indicators, cautious traders might consider potential short entries, aiming for exits near the mentioned support levels. Conversely, should the asset demonstrate strength and break above its immediate resistance, this could offer a favorable long entry point, with targets set at subsequent resistance levels.

Example of An Inverted H&S Turning BullishLarge inverted H&S pattern printed right before a huge jump
This an example of a bullish pattern
I think the run for PEPE will continue as the run for BTC continues.
if you ever see an inverted H&S just remember it can turn like this!
4Hr chart

Are MEME Coins getting oversold ?The recent rally has come to an end as you all can see but is this a buying opportunity or a sign of things to come?
Key points:
]MEME coins are experiencing a pullback. This could last days or even weeks. Coming price action will tell.
Fibonacci levels (100%, 127.2% , 161.8%) could be potential entry points. These levels represent historical support areas where the price might bounce if we are in fact in a 3 wave Flat correction.
The long-term trend might still be bullish. This pullback could be a healthy correction within a larger uptrend.
I'm waiting for a LOW RISK buy point. This means waiting for the price to reach these key Fibonacci levels before even considering entry.
Be cautious! The high volatility in MEME coins is extremely risky and could wipe out your account in minutes . Don't jump in blindly, wait for a good low risk entry point !!
What do you think? Is this a buying opportunity for MEME coins or a sign of a larger correction? Let me know your thoughts!

PEPE Long to Lose a 0PEPE has reached my lower target at the 0.786 Fibonacci level, signaling a prime opportunity to initiate a long position with a carefully placed stop loss. We're now poised for an ascent towards the 1.618 Fibonacci level. How to take profits
1.618 Level: Consider selling between 50% to 70% of your position. This is a significant target, marking a potential turn or pause in momentum.
2.0 Level: Take profit on another 15% of your holdings. This level represents a further stretch in price, warranting partial profit-taking.
2.618 Level: Aim to sell an additional 15%. Should the climb not extend to this lofty target, look to offload this portion anywhere in between the 2.0 and 2.618 levels.
Disclaimer: I’m not a financial advisor, and this should not be considered financial advice. These insights are shared from my personal perspective and are intended for educational purposes only. Always conduct your own research and consult with a professional before making investment decisions.

Pepe/Usdt Breakout Loading Pepe/Usdt
I am expecting price to breakout this trendline resistance on 4h Time-frame
Incase of succesful breakout 20-40% bullish move is expected for short term
It's not financial advice

PepeUSDT Market Analysis: Awaited Correction?The cryptocurrency market is often characterized by volatile movements and correction phases. PepeUSDT, a trading pair involving PepeCoin cryptocurrency and the Tether (USDT) stablecoin, is no exception to this reality. As investors closely watch charts and trends, the question arises: are we poised to see a correction in this pair?
Current Trend:
Over the past few weeks, PepeUSDT has displayed a significant upward trend. Prices have steadily climbed, with periodic spikes, attracting attention from traders and investors alike. This bullish trend seems to have been fueled by various factors, including growing interest in PepeCoin and the overall momentum of the cryptocurrency market.
Potential Reasons for Correction:
However, despite this bullish trend, it's important to remain cautious. Several factors could trigger a correction in the PepeUSDT pair:
Overbought Conditions: The Relative Strength Index (RSI) indicator shows overbought levels, suggesting that the PepeUSDT pair could be overvalued in the short term. Investors may begin to take profits, leading to a price correction.
Trading Volumes: Trading volumes could start to decrease, indicating waning investor interest. A drop in trading activity could trigger a price correction as demand decreases.
Unfavorable News: Unfavorable news regarding PepeCoin or the cryptocurrency market as a whole could also trigger a correction. Events such as government regulations or security breaches can have a significant impact on prices.
Strategies to Consider:
For investors and traders, it's crucial to implement strategies tailored to different market situations. In the case of PepeUSDT, here are some strategies to consider:
Taking Profits: If you've made significant profits from the bullish trend, it may be wise to take some of your gains to protect your investment in case of a correction.
Monitoring Support Levels: Keep an eye on key support levels. If the PepeUSDT pair starts to break below these levels, it could signal the beginning of a more significant correction.
Diversification: Consider diversifying your portfolio to reduce exposure to a single asset. This can help mitigate potential losses in the event of a market correction.
Conclusion:
In conclusion, while PepeUSDT has displayed a remarkable bullish trend, a correction could be imminent. It's essential for investors to remain vigilant and implement appropriate strategies to navigate the fluctuations of the cryptocurrency market.

700% after a deep correction Hello
As you see in the chart PEPE broke a tough resistant zone and needs a pullback so considering SL/TP wait for the yellow zone and take a long position.
Spot trade.
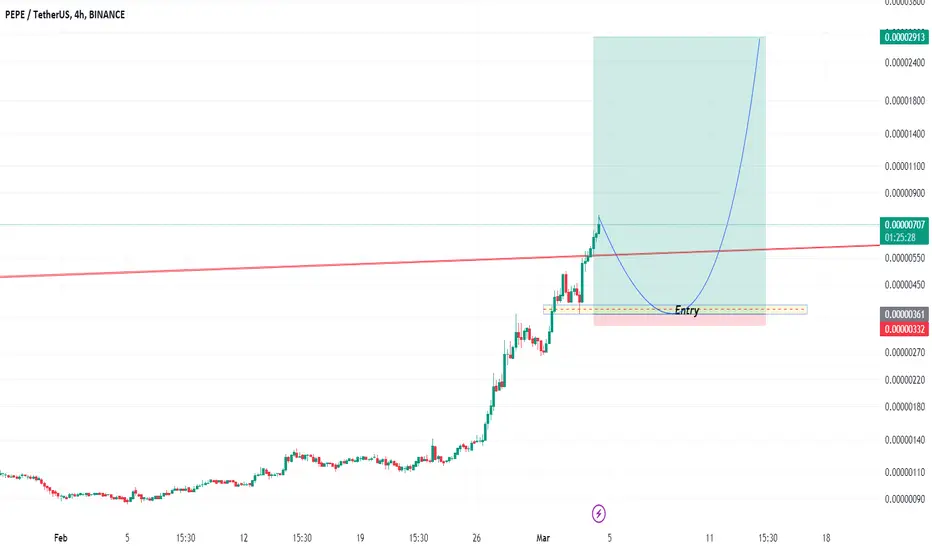
200%Hello
As my entry didn't match and rebounded earlier, I put another chart about PEPE.
Hold it to 200%.
Target is 0.00002400.

PEPE Manipulation ShakeoutShakeout: PEPE recently made a sharp decline, breaking through the lowest level on the chart.
This movement was probably artificially created to force out weak hands and leveraged traders.
Double bottom: After the shakeout, PEPE formed a double bottom pattern. This pattern often indicates a trend reversal and a possible price increase.
Liquidity manipulation: A sharp decline and the subsequent formation of a double bottom pattern can be a manipulation to force traders out of the market and capture their liquidity.
This article will delve deeper into identifying various chart patterns indicative of market manipulation, providing you with the knowledge to protect yourself and make informed trading decisions.
1. Pump and Dump Schemes:
Pump: A coordinated effort to artificially inflate a coin's price, often through social media hype and fake news.
Indicators:
Rapid price increase: Unusually sharp and sustained price increase without significant news or market events.
Low trading volume: Price rise accompanied by low trading volume suggests artificial inflation.
Social media frenzy: Coordinated social media posts and endorsements promoting the coin.
Dump: Once the price reaches a desired level, the manipulators sell their holdings, causing the price to plummet.
2. Wash Trading:
Fake trading: Creating the illusion of high trading volume by buying and selling between controlled accounts.
Indicators:
High volume with low price volatility: Large trading volume without a corresponding change in price suggests wash trading.
Spikes in trading volume: Sudden and unexplained spikes in trading volume may indicate wash trading.
Order book imbalance: Uneven distribution of buy and sell orders, with a significant imbalance favoring one side.
3. Fake Breakouts:
Manipulation: Creating a false impression of a breakout to trap traders into buying or selling at manipulated prices.
Indicators:
Low volume breakouts: Breakouts accompanied by low trading volume are often false.
Retracement after breakout: A sharp retracement following a breakout suggests a false signal.
Failed retests: Inability to sustain a breakout level after a retest indicates a weak breakout.
4. Stop Loss Hunting:
Manipulation: Driving the price towards stop-loss orders to trigger a cascade of sell-offs and further drive down the price.
Indicators:
Price movement towards support/resistance: Price approaching significant support or resistance levels where stop-loss orders are likely placed.
Sudden price spikes: Sharp and unexpected price movements may be attempts to trigger stop-loss orders.
Increased trading volume: Spikes in trading volume coinciding with price movements towards stop-loss levels.

PEPEUSDT.4HThe PEPE coin is currently trading at a high price of $882 against USDT. The Relative Strength Index (RSI) for 4 hours, 1 day, and 7 days are 80.89, 86.15, and 90.60 respectively, which indicates that the coin is being heavily bought. The RSI values are above 70, indicating that the coin is currently overbought. This could mean that a price correction might be due soon.
The Moving Average Convergence Divergence (MACD) for 4 hours, 1 day, and 7 days are 49.0, 19.0, and 87.0 respectively. The MACD is a trend-following momentum indicator that shows the relationship between two moving averages of a security’s price. The MACD values indicate that the coin is in a bullish trend across all three time frames.
The Bollinger Bands (Bb) for 4 hours, 1 day, and 7 days are all at 100.0. This could suggest that the coin's price has been extremely volatile and is currently at a high level.
The support levels for 4 hours are at $826, $710, and $64, while the resistance levels are at $98, $16, and $13. This suggests that there is a significant gap between the support and resistance levels, indicating a possible volatile market.
For the 1-day timeframe, the support levels are at $64, $42, and $41, while the resistance levels are at $10, $13, and $16. This again suggests a volatile market with a wide gap between support and resistance levels.
For the 7-day timeframe, the support levels are at $206, $78, and $49, while the resistance levels are at $1158, $13, and $21. This trend is similar to the 4-hour and 1-day timeframes, suggesting a volatile market.
In conclusion, the PEPE coin is currently in a bullish trend with high volatility. Its overbought condition might lead to a price correction in the near future. Therefore, if you are considering investing in this coin, you should prepare for potential price fluctuations and consider setting stop-loss orders to protect your investment.

PEPEUSDT: Break-out Potential BINANCE:PEPEUSDT : Potential Break-out After Strong Week for Meme Coins
Following a fantastic week for Meme coins enthusiasts PEPEUSDT is showing signs of a potential breaking out.
The current price movement could be a setup for a down trend and, neutral trend after downward, as depicted in this image (which is just one of many possibilities).
Why to Watch For:
Will PEPEUSDT continue its upward momentum?
Or will it settle into a Down-trend and neutral trend, as suggested by the image?
Remember: Technical analysis can provide insights, but it's not a guarantee of future performance. Do your own research before making any trading decisions.

PEPE/USDTSecond scenario, both supporting the same vision "long position" wait until the (wave 4) retrace then add some PEPE to your wallet to hit the target at 0.0000023


PEPE Loading the next GOD Candle. Long opportunity!My analysis on the 4-hour chart indicates a sustained bullish trend with the price maintaining a robust position above key moving averages heading towards the end of our Ascending Triangle. This alignment suggests a healthy uptrend with room for potential appreciation. The consolidation phase near recent highs could signal strength and a platform for the massive breakout that could appear in the next few hours. With the RSI indicating neither overbought nor oversold conditions, there’s an attractive window for considering a long entry. Such an entry must, however, be tempered with objective risk assessment, especially given the unpredictable nature of PEPE, where market sentiment can shift swiftly. This trade embodies a calculated balance between potential reward and the intrinsic volatility of the market.
Now let's dive into the arguments speaking for entering a long position here:
Ascending Triangle: being respected in the last few days, and as you can see that i entered the trade already within the previous testing of the horizontal resistance which led to a rejection. Now there is a second entry chance as well since we are trading exactly around the resistance zone of the Ascending triangle.
Trend: There's a visible uptrend, with the price making higher highs and higher lows, indicative of bullish market sentiment. This trend is further supported by the rising moving averages.
Price Action: The price action shows consolidation after a significant run-up, which could indicate accumulation before a further move upwards. The consolidation is above the previous resistance level, which could now be acting as support.
Price Above EMAs: Signals that the trend is still in favor of the bulls.
The overall Market Sentiment: As we all see in the last uptrend of PEPE, MEME coins are dong a massive rally which is still cointinuing at the moment. This speaks as well for a quick swing for this trade that can be potentially won as well.
All in all, we must not greed as well and set a take profit at only 200% and set our SL slighty belove the 50 EMA since the price action was holding this EMA as a good support recently.
It is important to note that trading meme tokens can be highly speculative and comes with increased risk. Traders should use risk management strategies, including setting a stop-loss and not allocating more capital than they can afford to lose. Fundamental factors surrounding meme tokens are also less predictable, so traders should be prepared for unexpected price swings.
Peace Out

FLOKI Is In A BULL MARKET MartyBoots here. I have been trading for 17 years and I am here to share my ideas with you to help the Crypto space. The Bull market is here
FLOKI has had a very strong breakout , These breakouts can often continue longer than people think. FLOKI could 10x
Please watch the video for more information
