Don't miss today's signal.Hello friends
Given the good growth we had, the price has corrected and now we can buy in steps in the specified areas with capital and risk management and move with it to the set goals.
*Trade safely with us*
PEPEUSDT

"PEPE 1H Analysis - Breakout Incoming? 📊 *PEPE/USDT – 1H Technical Analysis*
An ascending triangle pattern is developing on the 1-hour timeframe, which often indicates potential bullish momentum.
🟢 Price is approaching a key resistance near *0.00001516*.
🟡 A clean breakout above this level with strong volume may open the door for further upside.
🔴 Watch for *confirmation* before considering any move.
🔍 This chart is purely for educational and analytical purposes.
No financial advice. Do your own research before making any trading decisions.
#PEPE #PEPEUSDT #Crypto #TechnicalAnalysis #TradingView #Altcoins

NEARUSDT UPDATE
Pattern: Descending Triangle Breakout
Current Price: \$2.937
Target Price: \$3.60
Target % Gain: 22.69%
Technical Analysis: NEAR has broken out of a descending triangle on the 8H chart. Price is closing above resistance with decent momentum, indicating a potential move toward \$3.60.
Time Frame: 8H

Pepe 5X Lev. Full PREMIUM Trade-Numbers (PP: 1670%)The market always offers a second chance. The full trade-numbers below have targets up to 0.00003381 for a maximum profits potential for 1670%. The chart goes higher and reaches 2235% (0.00004264) and 3715% at 0.00006575.
How far up it goes and how fast is for the market to decide.
These trade setups are good if we can catch the bullish breakout, once the breakout is in, the rest is an easy wait.
I know some people that are happy to secure their trades after 200-300%, some even at 100%. Others wait long-term because these are awesome chart setups and can reach much higher. In past cycles we've done trades with more than 10X easily. This is one of those.
The question is, will it hit or will it fall?
The market always offers a second chance and a second chance is upon us, now.
Full trade-numbers below:
_____
LONG PEPEUSDT
Leverage: 5X
Entry levels:
1) 0.00000810
2) 0.00000715
3) 0.00000690
4) 0.00000630
Targets:
3) 0.00000867
4) 0.00001071
5) 0.00001222
6) 0.00001408
7) 0.00001681
8) 0.00001953
9) 0.00002342
10) 0.00002836
11) 0.00003381
Stop-loss:
Close weekly below 0.00000625
Potential profits: 1670%
Capital allocation: 5%
_____
Why Pepe and not some other Altcoin?
I shared trade-numbers for you for pairs as varied as Bitcoin and Ethereum, Notcoin and Dogs, Solana and Filecoin, Pepe, EOS, XRP, Cardano and Compound, to name a few. The truth is that I pick what in the moment looks good.
Market conditions can always change, but at the time of writing the chart looks great.
Notice that the action is 100% full red, that's the time to buy as I always remind and say; Buy when prices are low or trading near support; buy when the market is red.
The market is red now and that's the time to buy before a reversal happens. You will see, our time to sell comes when the market turns green.
Many average players will do it in reverse, right now they are selling and they will buy at the top of the bullish wave. I know, it is tempting, it is the market impulse but we have to learn to control our emotions if want success in this game.
There is risk involved. Leveraged trading is for experts only.
Thanks a lot for your continued support.
Namaste.

PEPE/USDT Potential UpsidesHey Traders, in today's trading session we are monitoring PEPE/USDT for a buying opportunity around 0.00001360 zone, PEPE/USDT is trading in an uptrend and currently is in a correction phase in which it is approaching the trend at 0.00001360 support and resistance area.
Trade safe, Joe.

Phemex Analysis #84: Pro Tips for Trading PEPEIn the vibrant and ever-changing landscape of cryptocurrency trading, PEPE ( PHEMEX:1000PEPEUSDT.P ) has recently captured significant attention from investors. Over the past 30 days, PEPE surged an impressive 130%, showcasing strong bullish momentum after a prolonged downtrend. This recent rally has rekindled investor interest, suggesting that a potential bullish reversal may be underway.
Yet, with volatility remaining high, traders should remain cautious.
Let’s explore several possible price scenarios and strategies to capitalize effectively on PEPE’s movements.
Possible Scenarios
1. Accumulation Followed by Breakout Rise
Currently, PEPE is showing signs of accumulation in the $0.015 to $0.012 range. This sideways consolidation typically indicates that market participants are gathering positions before a potentially significant upward move. If PEPE breaks decisively above the critical resistance at $0.0163, especially accompanied by a notable spike in trading volume, it would be a strong confirmation of bullish sentiment.
Pro Tips:
Entry Strategy: Consider accumulating positions within the consolidation range ($0.015 - $0.012). Wait for confirmation of a breakout above $0.0163 to scale up your positions confidently.
Risk Management: Place stop-loss orders below $0.012 to mitigate downside risk should the breakout fail to materialize.
2. Retesting the $0.007 Support Area
A pullback scenario could also unfold, bringing PEPE’s price down to retest the critical support zone around $0.007. If this retest occurs with relatively low trading volume and the RSI remains higher compared to previous lows—signaling a Double Bottom formation with RSI divergence—this could provide an excellent accumulation opportunity.
Pro Tips:
Accumulation Signals: Monitor trading volume and RSI closely. A successful retest at $0.007 with bullish divergence could indicate strong buying pressure.
Entry Confirmation: Conservative traders may prefer waiting for a confirmed breakout upward from the $0.007 support area before entering positions.
3. Bearish Drop Scenario
Despite the recent bullish signs, a bearish scenario remains possible. If PEPE declines towards the support level at $0.012 with increasing trading volume, and subsequently drops to $0.007 with even higher volume, it could indicate strong bearish momentum and weak market sentiment. Under these conditions, caution is highly recommended.
Pro Tips:
Market Caution: If price action unfolds this way, it’s advisable to refrain from entering positions immediately.
Wait and Observe: Allow price to stabilize before reconsidering any potential entry points, ensuring clear evidence of support.
Conclusion
PEPE’s recent 130% surge represents promising signs of a bullish reversal, yet navigating such volatility demands careful planning and strategic execution. By closely monitoring the outlined scenarios—recognizing accumulation signals, bullish divergences, and maintaining disciplined risk management—traders can maximize their potential returns while minimizing risk exposure. Always stay alert, responsive to market signals, and ready to adapt to changing conditions to trade PEPE confidently and profitably.
Tips:
Trade Smarter, Not Harder with Phemex. Benefit from cutting-edge features like multiple watchlists, basket orders, and real-time strategy adjustments. Our unique scaled order system and iceberg order functionality give you a competitive edge.
Disclaimer: This is NOT financial or investment advice. Please conduct your own research (DYOR). Phemex is not responsible, directly or indirectly, for any damage or loss incurred or claimed to be caused by or in association with the use of or reliance on any content, goods, or services mentioned in this article.


PEPEUSDT heading towards weekly supportThis is something I shared last year for PEPEUSDT. The price had hit monthly resistance MS1 and bounced from there towards weekly resistance WR1.
The current price action says it is in pullback mode of the current move up that we experienced for a few weeks.
I think the price will continue this pullback towards weekly support WS1 where the price will bounce. However, we have be watchful if the price attempts again at WR1 and succeeds before reaching to WR1.
If the price, hits WR1, a long is a very high probability trade and I will share a long setup there.

PEPE RIGHT TIME TO BUY PEPE coin is currently gaining momentum as market sentiment turns bullish across meme coins. With increased community engagement, rising trading volume, and attention from crypto influencers, PEPE appears poised for its next leg up. If current support holds and broader market conditions remain favorable, PEPE could break out from its current consolidation and target the next resistance level, potentially setting a new short-term high.

Impulse or Illusion? Key Level to Watch If you find this information inspiring/helpful, please consider a boost and follow! Any questions or comments, please leave a comment!
Recap
Since the price surge off the March 11 low, structure appears to be developing into a potential 5-wave impulse. However, with only three legs printed so far, it remains premature to confirm the full impulse structure.
Structure Assessment
The move resembles a possible ABC zigzag, but the center leg (possible wave 3) is showing strong impulsive characteristics — momentum, follow-through, and vertical lift. That raises the probability of it being an unfolding wave 3, rather than just a C wave.
What’s missing? A clear wave 4.
Until a fourth wave correction is established, and followed by a decisive wave 5, the bullish impulsive count remains tentative.
Outlook
📌 Key level: 0.00001087
The hold of this level will make the look of the structure ideal.
A break below 0.00001087 would dip into unacceptable territory for a developing wave 4 and opens the door to a bearish reassessment — and if the PA enters the price territory of the wave 1 cause a conclusive invalidation of the potential impulse.
✅ If price holds the level and a shallow wave 4 consolidates, we can then watch for signs of wave 5 to confirm the impulse and unlock bullish continuation potential.
Watch this level. Structure will confirm or collapse soon. More updates to follow.
Trade safe, trade smart, trade clarity.

ADA/USDT: Bullish Move Ahead ? (READ THE CAPTION)By examining the #Cardano chart on the 3-day timeframe, we can see that the price is currently trading around $0.80. If it holds above $0.71, we can expect more upside. The expected return for Cardano is around 30% in the short term, 47% in the medium term, and 85% in the long term.
Please support me with your likes and comments to motivate me to share more analysis with you and share your opinion about the possible trend of this chart with me !
Best Regards , Arman Shaban

PEPE 1D Harmonic Pattern Setting Up for a Bullish Breakout!Hey traders!
I'm spotting a potential bullish setup on #PEPEUSDT — and it’s one worth watching closely.
🔍 Technical Overview:
On the 1D time frame, #PEPE is forming a textbook harmonic pattern — still confirming.
No bearish divergence or reversal signs spotted so far — momentum remains intact.
Key level to watch: B point of the harmonic pattern, acting as strong horizontal resistance.
🎯 Trade Idea:
Plan: Wait for a clean breakout above the B-level, followed by a successful retest.
If the retest holds as support, I’ll be entering a long position with tight risk management.
TP-1: 0.00001292
TP-2: 0.00001647
SL: 0.00000549
⚠️ Why patience matters: Jumping in too early can expose you to fakeouts. Confirmation = confidence!
💬 What do YOU think? Is #PEPE about to explode or will the resistance hold? Drop your thoughts below! 👇
📈 If you find this helpful, don’t forget to: 👍 Like
💬 Comment
🔁 Share
📌 Follow me for more high-probability setups!
Let’s trade smart, not emotional. 💡
#PEPE #CryptoTrading #HarmonicPattern #BreakoutSetup #TechnicalAnalysis #TradingView #CryptoCommunity #Altcoins

Pepe Hits New Daily High, What Now?Pepe just hit a new high today, and the highest price since late January 2025. A full correction recovery is now in place but the action is never flat on this pair. We can see down-waves and up-waves. It alternates.
This new high is good. It is not so strong but still, slow and steady growth which is bullish. Trading volume is still low which at this point we take as a continuation signal, which means that there is plenty of room left available for additional growth.
Imagine this pair keeps rising and rising, still low volume. When huge volume comes in, that's when the strong advance will happen and we see 200-300% in a matter of days. While the rest of the time, months and months of growth, the pair is always growing but slowly. That is why patience is key.
See this, PEPEUSDT has grown by almost 200% since its March/April low, wow. And it will continue growing.
Thanks a lot for your continued support.
You can see the related publications for the full trade-numbers with leverage for this pair.
Thank you for reading.
Namaste.


PEPE Technical Analysis – Daily TimeframePEPE Technical Analysis – Daily Timeframe
PEPE is currently forming two strong bullish technical patterns, both suggesting significant upside potential if a key resistance level is broken with confirmation.
📌 Scenario 1 : Bullish Flag Pattern
If the price breaks and holds above the $0.00001500 resistance on the daily timeframe, the bullish flag pattern may become active.
This pattern projects a potential move toward the $0.00003000 level, which aligns with the previous all-time high (ATH).
📈 Estimated upside: +90% from the current price.
📌 Scenario 2 : Cup Formation
In the broader structure, PEPE appears to be forming a cup pattern.
A confirmed breakout above $0.00001500 could open the door to a new all-time high around the $0.00004000 level.
📈 Estimated upside: +170%, assuming full pattern completion.
✅ In both scenarios, a strong breakout above $0.00001500 with volume is the key condition for bullish continuation.
Until then, short-term volatility or consolidation remains possible.
📌 This analysis is for educational and informational purposes only and does not constitute financial advice.
This cryptocurrency has two key support levels.
As long as the price remains above these supports, there is still hope for a potential reversal and continuation of the uptrend.
The first support is at $0.00001200
The second support is at $0.00001050
📝 Follow me for updates and more crypto analyses.

PEPE AGAIN!!!Hello friends
Considering the good growth we had, you can see that the price has made a correction and entered a range after reaching its ceiling.
Now, with the price correction, there is a good opportunity to buy in a pipeline and with capital management and move with it to the specified goals.
*Trade safely with us*

Pepe/Usdt Long % 150 A major breakout in Pepe/USDT is expected to start soon. There is a formation similar to the previous bull run. The bull mode is about to be activated, everyone get ready. We are starting.

PEPE key levelsBINANCE:PEPEUSDT
The chart shows partial zones for buying this asset.
Further on there will be a good profit to risk ratio.

High R/R Swing Setup on PEPE – Eyes on 100%+ MoveThe 1D chart for PEPEUSDT is showing a clean bullish structure, supported by repeated rejections from a key support level and a recent breakout above short-term resistance. This setup offers a simple yet potentially high-reward trade opportunity for swing traders.
📊 Trade Setup
Entry: 0.00001269 USDT
Price has confirmed a bullish reversal and is currently hovering above a minor consolidation range, presenting a strong opportunity for a long position.
Stop Loss: 0.00001079 USDT
Placed just below the previous local lows to invalidate the setup in case of a breakdown.
Take Profit 1 (TP1): 0.00002135 USDT
This level represents a previous high and a clear horizontal resistance zone.
Take Profit 2 (TP2): 0.00002844 USDT
A higher resistance level, also aligning with historical price action, offering a potential 103% gain from entry.
📈 Technical Justification
Key Support Holding: Price has shown multiple rejections near the 0.00000565 USDT level, forming a strong support base. Each rejection has resulted in a higher low, indicating increasing bullish momentum.
Trendline Confirmation: The ascending trendline shows sustained bullish pressure and confirms the strength of the ongoing trend.
Breakout Setup: Current price action indicates a breakout from consolidation, supported by volume. The bullish structure remains intact as long as the price holds above the 0.00001079 SL region.
Risk-to-Reward: The setup offers an attractive 4.5 R/R ratio, making it highly favorable for swing trading.
📌 Summary
This is a clean, trend-continuation trade with defined risk and strong technical backing. Traders looking for a mid-term opportunity should keep an eye on volume and price action around TP1 for potential partial exits or trailing stop adjustments.

PEPE/USDT is Nearing an Important ResistanceHey Traders, in today's trading session we are monitoring PEPE/USDT for a selling opportunity around 0.00001330 zone, PEPE/USDT is trading in a downtrend and currently is in a correction phase in which it is approaching the trend at 0.00001330 support and resistance area.
Trade safe, Joe.

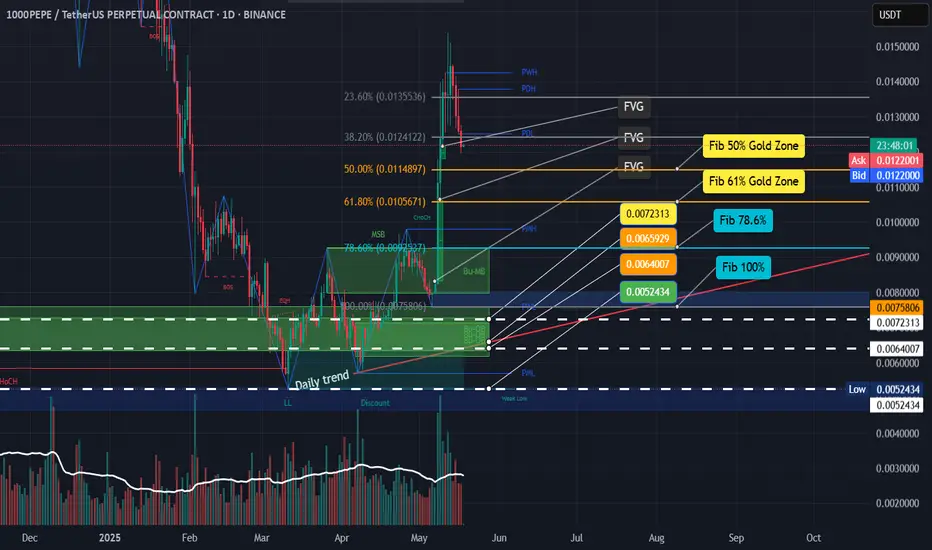
$1000PEPE | Smart Money Retracement Levels - Watch FVG + Fib ConAfter a strong breakout and Change of Character (ChoCH), $1000PEPE is now pulling back into a potential premium-to-discount retracement. I'm watching the following key areas:
FVGs + Fib Gold Zones (50% & 61.8%) = high-probability bounce regions
Bu-MB & Bu-B zones = smart money interest area
Daily MSB confirms shift in structure
Key retracement levels:
🔸 Fib 61.8% at 0.0105671
🔸 Fib 78.6% at 0.0091527
🔸 Fib 100% at 0.0052434
Targets: Reclaiming PDH / PWH could suggest continuation.
Invalidation: Break below 0.0052 weak low area (LL) cancels bullish bias.
PEPE price analysisCRYPTOCAP:PEPE price has grown quite well over the past month.
Now the OKX:PEPEUSDT price, in our opinion, has reached a critical point from where it would be appropriate to correct a bit before continuing to grow:
1️⃣ correction to $0.0000100-0.0000105 can be considered “delicate”, which will only confirm the strength and serious further intentions of buyers.
2️⃣ correction to $0.0000084-0.0000085 can be considered “on the verge of a foul”, but the upward trend will continue and will not be broken.
3️⃣ or do you think there is no time for corrections, and we should continue to grow to ATH right now?
_____________________
Did you like our analysis? Leave a comment, like, and follow to get more

PEPE – 2x Move Looks ImminentOne of the strongest alt structures right now.
Given how well it’s held previous swing lows—and the recent deviation and retest—it’s pretty clear where this is headed.
This is a longer-term play. It might take weeks to reach the yearly open, where I’ll look to offload, or slightly earlier depending on how it reacts to the weekly block.
Also worth noting: PEPE is one of the few alts still maintaining an active weekly uptrend.
BINANCE:PEPEUSDT CRYPTOCAP:PEPE
