PEPEUSDT – Downtrend Breakout & Golden Zone Retest in Play!📊 Chart Analysis:
On this daily timeframe chart of PEPEUSDT, price has successfully broken above the descending trendline that had capped the price since late 2024. This breakout is a strong early signal that bearish momentum is weakening and a potential trend reversal may be underway.
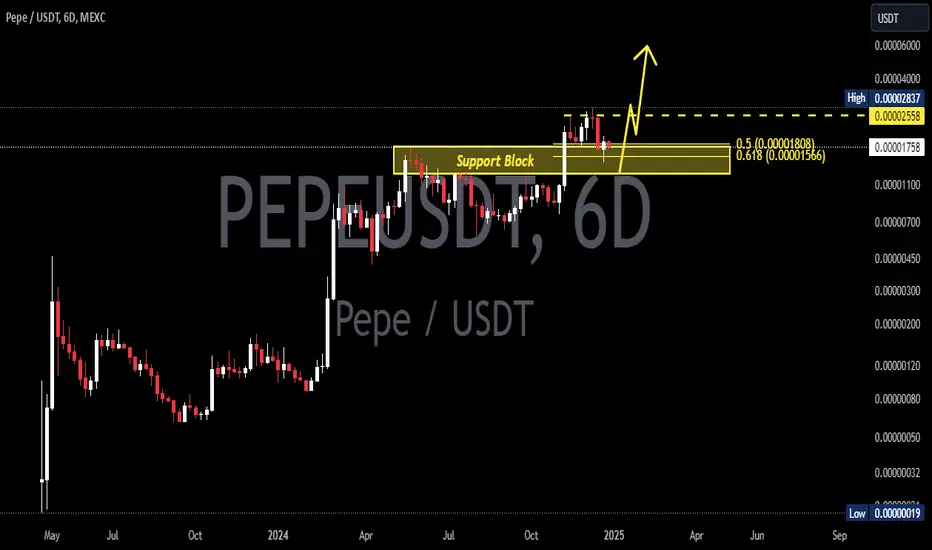
After the breakout, the price is now performing a retest at a key confluence support zone, including:
Fibonacci Retracement levels 0.5 (0.000011580) and 0.618 (0.000010835) — the Golden Zone
Previous horizontal demand zone (highlighted in yellow)
Retest of the broken descending trendline
This retest area will be crucial for determining the next directional move.
---
🐂 Bullish Scenario:
If price holds above the Fibonacci Golden Zone and forms a bullish confirmation candle, we could see a continuation of the uptrend toward:
0.000014191
0.000015000
0.000016836
0.000021533 (medium-term target)
Possibly retesting the High at 0.000028364
This would confirm the start of a major trend reversal and renewed bullish momentum.
---
🐻 Bearish Scenario:
If price fails to hold above the 0.000010835 level and breaks down below the Golden Zone:
Expect a drop toward psychological support around 0.000010000
And potentially further down to the strong support near 0.000007000
Such a move would invalidate the breakout and put PEPE back into a consolidation or extended downtrend phase.
---
🧠 Chart Pattern Notes:
Descending Trendline Breakout
Golden Zone Retest (Fibonacci 0.5 & 0.618)
Potential formation of an Inverted Head & Shoulders pattern (in early stages)
---
🎯 Conclusion:
PEPEUSDT is at a critical turning point after breaking out of a long-term downtrend. If the support at the Golden Zone holds, there is strong potential for a sustained bullish rally. However, traders should remain cautious and apply proper risk management in case of a breakdown below key levels.
#PEPEUSDT #CryptoBreakout #GoldenZoneRetest #TechnicalAnalysis #FibonacciLevels #PEPECoin #AltcoinAnalysis #TrendReversal #BullishSetup #BearishRisk
Pepeusdtlong

PEPE/USD Market Heist: Thief Entry Plan for Big Gains🔥🚨 Thieves of Wall Street: PEPE/USD Crypto Robbery Blueprint 🚨🔥
The Ultimate “Thief Style” Trade Setup That Even Wall Street Would Envy
— A High-Risk, High-Reward Playbook for Market Outlaws —
🌍 Hello Global Money Grabbers!
Hola | Ola | Bonjour | Hallo | Marhaba | Namaste 💰🌐
Welcome to the Thief Trading Zone — where smart rebels don’t chase price, they trap it, rob it, and run off with the profits. 🏴☠️
💸 Mission: PEPE/USD Market Infiltration
🎯 Objective:
Infiltrate the PEPE/USD crypto zone where the big bears sleep — and strike long in the danger zone where most traders panic and exit. That’s where we thrive.
🔍 Trade Setup: The Heist Blueprint
Market: PEPE/USD
Play: Long Entry (Thief-Style Reversal Tactic)
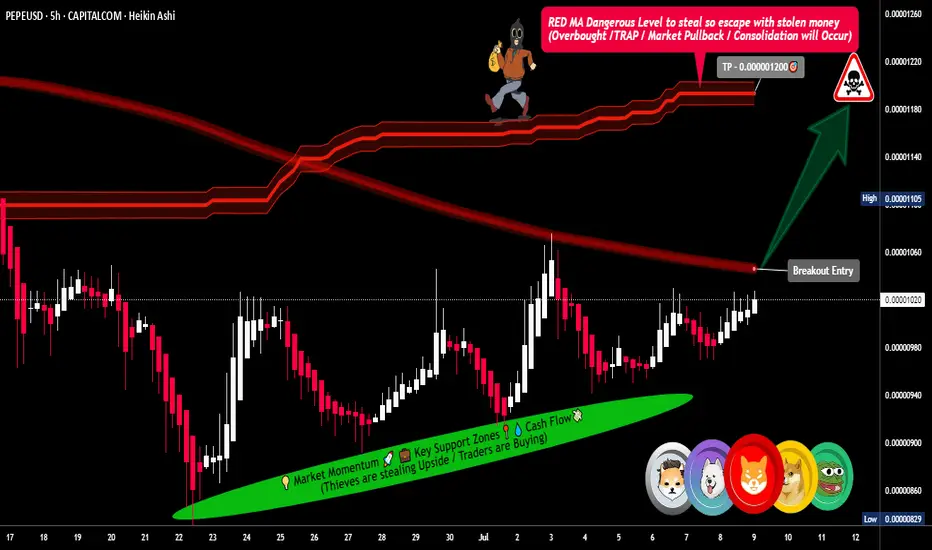
Zone: Red-Hot Resistance Turned Reversal (aka the Profit Trap Zone)
🧨 Entry Strategy:
Wait for the breakout through the Red Moving Average wall at 0.00001060 — that’s your signal the vault is open.
🔑 Execution Plan:
Place Buy Stop Orders just above the breakout level.
Deploy Buy Limit Orders at 15-min/30-min swing lows or consolidation traps.
Use DCA/Layering Entry Style — like a true thief, you never go all in at once.
⚙️ Set Alerts on breakout zones — thieves never sleep on opportunity!
🛑 Stop Loss Tactics (Stealth Exit):
Primary SL: Set just below recent swing low on 5H chart (around 0.00000960).
Wait for the breakout before dropping that SL — don’t get caught too early.
Risk management is your getaway vehicle. Don’t crash it.
🎯 Targets:
Primary Exit: 0.00001200
Optional Early Exit: If the heat’s on, take the bag and disappear. 🏃♂️💨
Always trail your SL to protect your loot.
💡 Scalping & Swing Heist Tips:
Scalpers: Only ride the long waves.
Swing Thieves: Set your traps and be patient — big moves take time.
Big Wallets: Dive in.
Small Wallets: Ride with protection and precision.
🔎 Market Insight (Thief Intel Drop):
PEPE/USD is flashing bullish signals across:
On-chain analytics
COT positioning
Sentiment reversal indicators
Macro economic setups
Intermarket synergy
Get your confirmations before acting — we rob smart, not blind.
⚠️ News & Heat Map Alert:
High-impact news = flashing red lights 🚨
Avoid new positions during major announcements.
Already in the game? Use trailing SL to secure your profits while chaos brews.
🚀 Boost the Robbery!
Smash that Boost Button to join the elite crew of thief traders flipping charts for fun & profit every day. 💎📈
Stay sneaky, stay smart — this ain’t gambling, it’s organized market crimee (the smart kind).
🎭💰 Next Heist Coming Soon — Follow for More Robbery Blueprints! 💣💼
PEPEUSDT Critical Decision Zone – Massive Move Incoming?🧠 Macro Technical Analysis
PEPEUSDT is currently hovering within a critical demand zone (0.00000095 – 0.00000110), an area that has historically acted as a strong accumulation base and a launchpad for previous rallies. The chart structure shows multiple interactions with this zone, highlighting its significance as a key inflection level.
This zone is not just a support — it’s a make-or-break battlefield between bulls and bears. Price is consolidating within this zone, setting the stage for a potential explosive breakout or a dangerous breakdown.
🔍 Pattern Breakdown & Key Technical Levels
Accumulation Zone (Yellow Box):
Seen from April 2024 to now, price has bounced several times from this region. The multiple touches and long wicks confirm strong buying interest here.
Sideways Channel / Range-Bound Structure:
Price action between 0.00000110 and 0.00000283 has formed a clear horizontal range, and the current price is once again testing the lower boundary of this range.
Implied Move Projection (Yellow Arrow):
A potential breakout from this range could trigger a measured move to the upside, aiming for the previous high at 0.00000283 — representing a +150% upside potential from current levels.
📈 Bullish Scenario:
1. Price holds above 0.00000100, maintaining structure above demand.
2. Break and daily close above:
0.00000127 (minor resistance)
Then 0.00000140, which could trigger acceleration.
3. Target levels to watch:
🟡 0.00000162 – Intermediate resistance
🟡 0.00000180 – Confluence zone
🟡 0.00000211 – Mid-range mark
🟡 0.00000240 – Major breakout checkpoint
🟡 0.00000283 – Range high and final bullish target
Break above 0.00000283 could open a parabolic rally.
📉 Bearish Scenario:
1. Breakdown below 0.00000095, followed by rejection from the bottom of the demand zone.
2. This could signal:
Weak market structure
Failed accumulation
Invalidation of the bullish setup
Key downside levels:
🔻 0.00000080 – Local support
🔻 0.00000065 – Historical low defense
🔻 0.00000038 – Macro capitulation zone
⚠️ Breakdown from current levels will turn this accumulation into distribution.
🧭 Strategic Takeaway:
PEPE is trading at a decisive zone. A bounce from this level could signal the start of a new bullish phase, while a breakdown could usher in a deeper bearish trend. Traders should closely monitor volume spikes, breakout candles, and confirmations above 0.00000127 to validate bullish momentum.
This is a low-risk, high-reward setup for disciplined traders with proper risk management.
#PEPEUSDT #PEPE #CryptoTechnicalAnalysis #AltcoinBreakout #MemeCoinSeason #CryptoTrading #AccumulationZone #BreakoutAlert #BullishCrypto #BearishScenario

#PEPEUSDT: Major Swing Upcoming! Get Ready! PEPEUSDT is currently in phase two of accumulation and will distribute the price soon. We expect the price to move in a bullish impulse pattern as we anticipate volatility in the coming days. However, we advise having a secondary bias while investing or trading on cryptocurrency, as it is highly risky and lacks the same volume as forex or gold.
Good luck and trade safely!
Team Setupsfx_


Is PEPE About to Explode? Critical Breakout Level Incoming!Yello, Paradisers! Are you ready for what could be the breakout #PEPE bulls have been waiting for since February?
💎After a long, painful downside grind, PEPE is finally shaping up for a potential bullish reversal. The price action has entered an ascending triangle, often a reliable pattern that hints at an incoming breakout. This setup is now flashing signals that momentum is shifting but it all hinges on one critical zone.
💎#PEPEUSDT is currently eyeing the $0.0000088 – $0.0000090 region, a heavy resistance that’s proven itself multiple times since February 24th. Bulls have failed to conquer this level on several occasions, and now, the 12-hour EMA-200 is also sitting in this area, a dynamic resistance reinforcing this as a crucial inflection point.
💎If the bulls can finally break through $0.0000090 with clear volume confirmation, PEPE could open up upside potential towards $0.00001135. This level is likely to attract some short-term profit-taking, but if momentum holds, we could see a push towards the much stronger $0.00001400 – $0.00001490 zone. This region lines up with a multi-point confluence, including a significant horizontal resistance and the 38.20% Fibonacci retracement level — both strong technical barriers that may define the next major move.
💎Support is also well-defined for now. The 12-hour EMA-50 is acting as dynamic support and currently sits around the $0.00000720 level. PEPE has been respecting this level well, and any temporary pullbacks may bounce from here. Below this, the $0.00000650 – $0.00000570 range remains the key support zone. This zone held firm during the last dips and is likely to absorb any upcoming selling pressure if the breakout fails short-term.
Paradisers, strive for consistency, not quick profits. Treat the market as a businessman, not as a gambler.
MyCryptoParadise
iFeel the success🌴

PEPEUSDT 2DPEPE ~ 2D Analysis
#PEPE Buy after successfully penetrating this resistant line with a short -term target of at least 15%+ from here.

PEPEUSDT Eyes the Sky!BINANCE:PEPEUSDT has shown a strong bounce from a key support level, signaling potential for a continued bullish move. The overall market sentiment is positive, which could act as a catalyst for further upside. With the price structure leaning bullish and momentum picking up, there’s a good chance we’ll see higher highs in the coming sessions. Traders should keep an eye on the next resistance zone as a possible target while maintaining disciplined risk management. Always trade with a clear plan—and most importantly, don’t forget your stop loss!
$1000PEPEUSDT Currently trading at $0.00735
Buy level : Above $0.0071
Stop loss : Below $0.0056
Target : $0.0145
Max leverage 3x
Always keep Stop loss
Follow Our Tradingview Account for More Technical Analysis Updates, | Like, Share and Comment Your thoughts

PEPEUSDT 2DPEPE ~ 2D Analysis
#PEPE Buy gradually after re -testing this support with a short -term target of at least 15%+.

PEPEUSDT 2DPEPE ~ 2D Analysis
#PEPE If you still have a Conviction on this coin, maybe this support you can consider to start buying back with a short -term target of at least 15%+.

PEPEUSDT 4DPEPE ~ 4D Analysis
#PEPE This is a support that was previously an area of accumulation. Buy from here with a minimum target of 20%+

PEPEUSDT: Anticipating a Correction Before the UptrendGreetings, fellow traders!
The recent surge in Bitcoin's price, sustained over the past 72 hours, has injected a bullish sentiment into the broader market. For those considering a long position on PEPEUSDT, I anticipate a potential price correction before the primary uptrend commences.
I foresee a possible retracement to the $0.000014150 level, followed by a renewed upward trajectory with two price targets: $0.000017500 and $0.000020000. My recommendation is to consider entering a long position after the anticipated correction, above the $0.000015300 threshold.
Best of luck and profitable trades to all!
BINANCE:PEPEUSDT

#PEPE is About to Breakout!#PEPE is About to Breakout ✅
Get ready for the upcoming move!
Stay tuned for more
DYOR, NFA
#Crypto #Altseason2025

PEPEUSDT %85 Daily Volume SpikeWe previously observed a 25% reaction from the blue box in PEPEUSDT, as mentioned in my earlier analysis. As you can see here:https://www.tradingview.com/chart/PEPEUSDT/VP77qwjf-PEPEUSDT-Flash-Crash-I-m-Ready/
If you utilized low-time frame market breakdowns, you could have caught some excellent risk-to-reward (RR) opportunities. From the latest blue box.
Currently, the price seems to be consolidating, and there is an 85% increase in trading volume today, which is significant. Despite my overall bullish outlook, I believe the price may seek lower levels before continuing its upward trajectory. This potential pullback could provide a new and favorable positioning opportunity.
How to create a position?
When price going down, sometimes CDV goes up, it means an opportunity if general outlook is bullish.
Sometimes we took a retest from volume profile "Point of Control" line and when we reach there we see huge buyers coming in Volume Footprint, it means you can look for an entry.
When trading the blue box, I will rely on indicators like:
Cumulative Delta Volume (CDV)
Liquidity Heatmap
Volume Profile
Volume Footprint
Additionally, I will look for upward market structure breaks in lower time frames for confirmation.
If you'd like to learn how to utilize CDV, liquidity heatmaps, volume profiles, and volume footprints effectively, feel free to visit my profile and contact me.
Best of luck and manage your risk wisely!
If you think this analysis helps you, please don't forget to boost and comment on this. These motivate me to share more insights with you!
I keep my charts clean and simple because I believe clarity leads to better decisions.
My approach is built on years of experience and a solid track record. I don’t claim to know it all, but I’m confident in my ability to spot high-probability setups.
If you would like to learn how to use the heatmap, cumulative volume delta and volume footprint techniques that I use below to determine very accurate demand regions, you can send me a private message. I help anyone who wants it completely free of charge.
My Previous Analysis (the list is long but I think it's kinda good : )
🎯 ZENUSDT.P: Patience & Profitability | %230 Reaction from the Sniper Entry
🐶 DOGEUSDT.P: Next Move
🎨 RENDERUSDT.P: Opportunity of the Month
💎 ETHUSDT.P: Where to Retrace
🟢 BNBUSDT.P: Potential Surge
📊 BTC Dominance: Reaction Zone
🌊 WAVESUSDT.P: Demand Zone Potential
🟣 UNIUSDT.P: Long-Term Trade
🔵 XRPUSDT.P: Entry Zones
🔗 LINKUSDT.P: Follow The River
📈 BTCUSDT.P: Two Key Demand Zones
🟩 POLUSDT: Bullish Momentum
🌟 PENDLEUSDT.P: Where Opportunity Meets Precision
🔥 BTCUSDT.P: Liquidation of Highly Leveraged Longs
🌊 SOLUSDT.P: SOL's Dip - Your Opportunity
🐸 1000PEPEUSDT.P: Prime Bounce Zone Unlocked
🚀 ETHUSDT.P: Set to Explode - Don't Miss This Game Changer
🤖 IQUSDT: Smart Plan
⚡️ PONDUSDT: A Trade Not Taken Is Better Than a Losing One
💼 STMXUSDT: 2 Buying Areas
🐢 TURBOUSDT: Buy Zones and Buyer Presence
🌍 ICPUSDT.P: Massive Upside Potential | Check the Trade Update For Seeing Results
🟠 IDEXUSDT: Spot Buy Area | %26 Profit if You Trade with MSB
📌 USUALUSDT: Buyers Are Active + %70 Profit in Total
🌟 FORTHUSDT: Sniper Entry +%26 Reaction
🐳 QKCUSDT: Sniper Entry +%57 Reaction
📊 BTC.D: Retest of Key Area Highly Likely
I stopped adding to the list because it's kinda tiring to add 5-10 charts in every move but you can check my profile and see that it goes on..

PEPEUSDT 6DPEPE Update ~ 6D
#PEPE So far it still maintains its bullish structure. Buy gradually within this support block,. it's only a matter of time these Memes will make new highs.
PEPE USDT Spot trade 20% potentialPEPE/USDT shows a promising 20% upside potential in the spot market, with increasing volume and positive price action. A breakout above key resistance levels could confirm the bullish momentum, making it an attractive short-term trade opportunity.

PEPE / USDT : Primed for a breakout above resistance zonePEPE/USDT: Primed for a Breakout Above Resistance Zone
PEPE/USDT is showing signs of gearing up for a significant move 📈 as it approaches a key resistance level 📊. The price has been consolidating in a tight range, setting up an ideal scenario for a potential breakout 💥. If confirmed, this could ignite a strong bullish trend 🚀. Stay alert 👀 and watch for confirmation signals before making your move.
Key Insights:
1. Resistance zone: PEPE/USDT is nearing a crucial horizontal resistance level that has capped its upward movements previously. A breakout above this could open the door for substantial gains.
2. Volume surge: A noticeable increase in trading volume during the breakout will confirm buyer strength 🔥.
3. Bullish indicators: Technical tools like RSI and MACD are pointing towards bullish momentum ⚡, increasing the likelihood of a breakout.
Steps to Confirm the Breakout:
Wait for a solid 4H or daily candle closing above the resistance zone 📍.
Monitor for a spike in volume during the breakout, signaling robust buying activity 📊.
Look for a retest of the broken resistance as a new support zone to confirm the move ✅.
Be cautious of fake breakouts, such as sudden wicks above resistance followed by reversals ⚠️.
Risk Management Strategies:
Use stop-loss orders to protect your capital 🔒.
Position size carefully to align with your overall trading strategy 🎯.
This analysis is for educational purposes only and does not constitute financial advice. Always do your own research (DYOR) 🔍 before making any investment decisions.

Pepe (PEPE) may be poised for a new ATH. Here's why:Following the channel breakout rally in PEPE price creating an ATH in November, the meme coin shows a post-retest rally. As the bull run restarts in PEPE, bulls anticipate the rally to create a new ATH next week.
In the daily chart of PEPE, the meme coin shows a bullish recovery, regaining momentum. The ongoing recovery trend started near the $0.000075 with a Morning Star pattern.
This rally peaked at nearly 200%, nearly $0.000025. However, the falling channel breakout rally took a quick retest of the previous all-time high near the $0.000017223.
The 10% surge last night, creating a bullish engulfing candle, ended the five-day consecutive red-candle streak. It also marked the post-retest bounce back for the meme coin.
Currently, the bull run is extended with an intraday gain of 2.79% as the PEPE price trades at $0.00002126.
Using the trend-based Fibonacci levels, the uptrend is approaching the 23.60% Fibonacci level at $0.00002303. Considering that the recovery run of the broader market will be prolonged, the PEPE price bull run is likely to reach $0.00002989 by the end of November.
Hence, the PEPE price will explode with a massive upside of 40% in the next week. On the flip side, the $0.00001879 will likely provide bullish support.

PEPEUSDT Symmetric Triangle BreakoutBINANCE:PEPEUSDT Technical analysis update
PEPEUSDT has been forming a triangle pattern for the past 240 days and is now breaking the triangle resistance on the daily chart. The price is trading above the 100 and 200 EMAs, suggesting that a strong bullish move can be expected from the current level.
Buy zone : Below 0.0111
Stop loss : $0.00888
Take Profit 1: $0.0130
Take Profit 2: $0.0170
Take Profit 3: $0.0250
Regards
Hexa

PEPEUSDT Pennant Breakout: Ready for Lift-Off? BINANCE:PEPEUSDT has just broken out of a bullish pennant formation, hinting at a potential strong upmove. Recently, it formed an inverse head and shoulders pattern that led to impressive gains, and now, with this breakout, we could see a similar rally. This setup mirrors BINANCE:DOGEUSDT ’s previous path, suggesting a possible bullish follow-through.
As always, trade with caution. Set your stop loss to manage risk and make the most of this opportunity safely. Trade smart, and let’s see where BINANCE:PEPEUSDT takes us!
OKX:PEPEUSDT.P trading at $0.000011
Buy level: Above $0.00001
Stop loss: Below $0.0000077
TP1: $0.000013
TP2: $0.000017
TP3: $0.000025
TP4: $0.00005
Max Leverage 2x
Follow Our Tradingview Account for More Technical Analysis Updates, | Like, Share and Comment Your thoughts

$PEPEUSDT Set to Soar After Strong Retest!BINANCE:1000PEPEUSDT.P is demonstrating solid strength following a trend breakout and subsequent retracement. With positive momentum building, it looks poised for a significant move, likely following in the footsteps of DOGE. Traders should keep an eye on key levels as BINANCE:PEPEUSDT prepares for potential big upswings, similar to what we've seen with $DOGEUSDT.
As always, remember to use a stop loss and invest only a small portion of your capital to manage risk effectively.
$1000PEPEUSDT Currently trading at $0.0096
Buy level: Above $0.0093
Stop loss: Below $0.0077
TP1: $0.01
TP2: $0.012
TP3: $0.013
TP4: $0.017
Max Leverage 3x
Follow Our Tradingview Account for More Technical Analysis Updates, | Like, Share and Comment Your thoughts

Looks Like We Have Long Scenario on PEPEBINANCE:PEPEUSDT
CRYPTO:PEPEUSD
SL1 ---> Low-risk status: 3x-4x Leverage
SL2 ---> Mid-risk status: 5x-8x Leverage
👾The setup is active but expect the uncertain phase as well.
➡️Entry Area:
Yellow box
⚡️TP:
0.00000803
0.00000816
0.00000833
0.00000850
🔴SL:
0.00000768
0.00000753
🧐The Alternate scenario:
If the price stabilizes below the trigger zone, the setup will be cancelled.

