PEPEUSDT – Downtrend Breakout & Golden Zone Retest in Play!📊 Chart Analysis:
On this daily timeframe chart of PEPEUSDT, price has successfully broken above the descending trendline that had capped the price since late 2024. This breakout is a strong early signal that bearish momentum is weakening and a potential trend reversal may be underway.
After the breakout, the price is now performing a retest at a key confluence support zone, including:
Fibonacci Retracement levels 0.5 (0.000011580) and 0.618 (0.000010835) — the Golden Zone
Previous horizontal demand zone (highlighted in yellow)
Retest of the broken descending trendline
This retest area will be crucial for determining the next directional move.
---
🐂 Bullish Scenario:
If price holds above the Fibonacci Golden Zone and forms a bullish confirmation candle, we could see a continuation of the uptrend toward:
0.000014191
0.000015000
0.000016836
0.000021533 (medium-term target)
Possibly retesting the High at 0.000028364
This would confirm the start of a major trend reversal and renewed bullish momentum.
---
🐻 Bearish Scenario:
If price fails to hold above the 0.000010835 level and breaks down below the Golden Zone:
Expect a drop toward psychological support around 0.000010000
And potentially further down to the strong support near 0.000007000
Such a move would invalidate the breakout and put PEPE back into a consolidation or extended downtrend phase.
---
🧠 Chart Pattern Notes:
Descending Trendline Breakout
Golden Zone Retest (Fibonacci 0.5 & 0.618)
Potential formation of an Inverted Head & Shoulders pattern (in early stages)
---
🎯 Conclusion:
PEPEUSDT is at a critical turning point after breaking out of a long-term downtrend. If the support at the Golden Zone holds, there is strong potential for a sustained bullish rally. However, traders should remain cautious and apply proper risk management in case of a breakdown below key levels.
#PEPEUSDT #CryptoBreakout #GoldenZoneRetest #TechnicalAnalysis #FibonacciLevels #PEPECoin #AltcoinAnalysis #TrendReversal #BullishSetup #BearishRisk
Pepeusdtperp

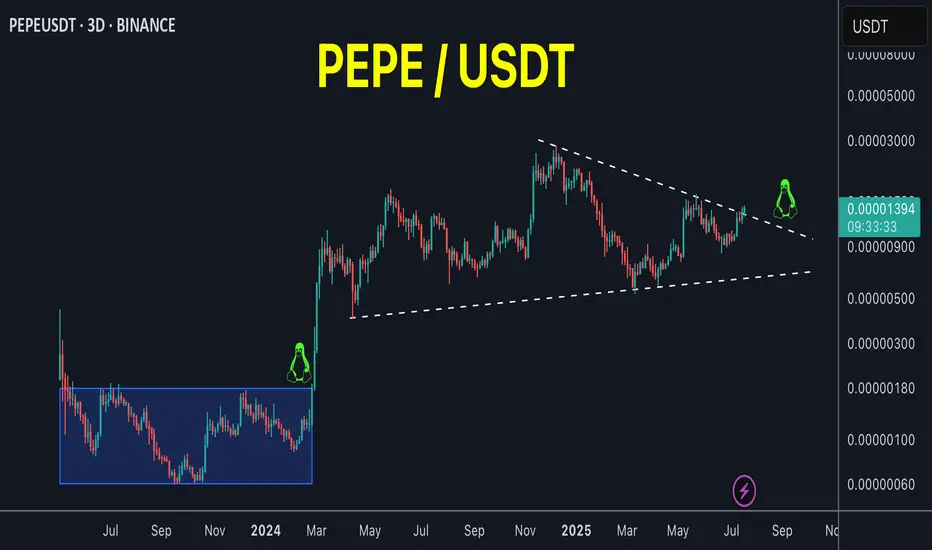
$PEPEUSDT Breakout: 180% Ahead?CRYPTOCAP:PEPE just broke out of a long-term triangle.
If the move holds, it could pump up to 0.00002313, that’s a potential 180% gain.
Watch for a retest before making a decision.
DYOR, NFA

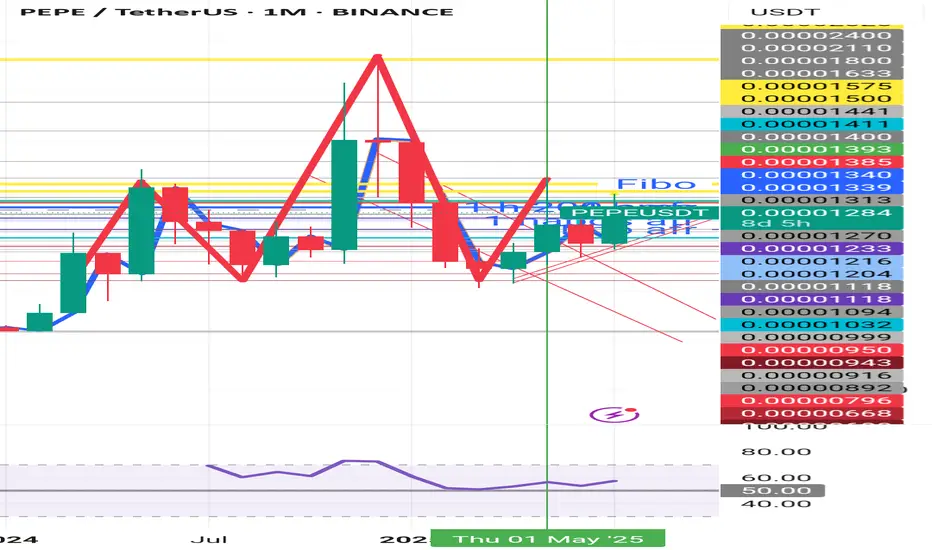
Is the alt season over at Pepe?PEPE
This is not a little suspicious to me. H&S is forming on a 1-month timeframe. I also discovered 4 divergences on a 4-hour timeframe looking back at the past few weeks, which may support my assumption that this is what the off-season was all about and a longer break may be in order.
Was that all the offseason was for Pepe?PEPE
This is not a little suspicious to me. H&S is forming on a 1-month timeframe. I also discovered 4 divergences on a 4-hour timeframe looking back at the past few weeks, which may support my assumption that this is what the off-season was all about and a longer break may be in order.
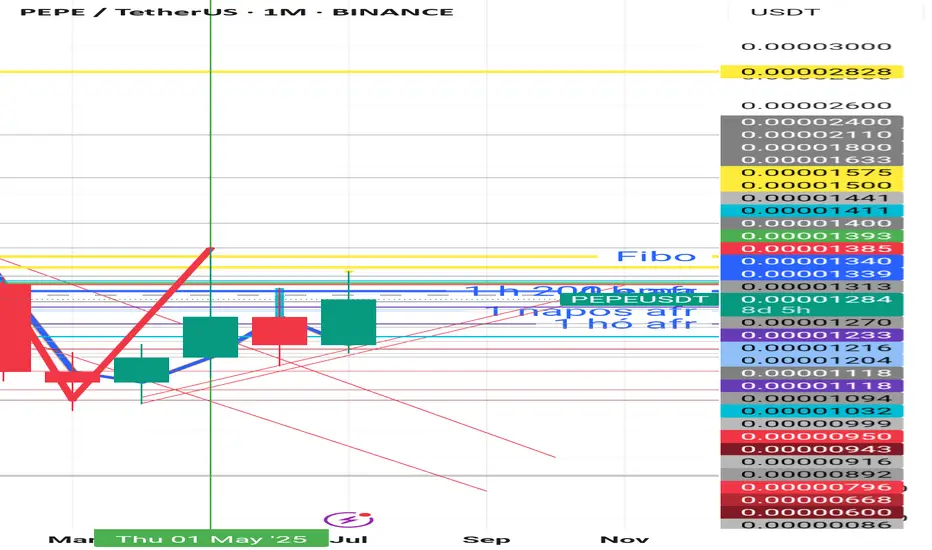
PEPE on the verge of breakout!PEPE / USDT
Price is trying to breakout massive downtrend line since 7 months
Incase of breakout we will see strong bullish momentum
Keep an eye on it
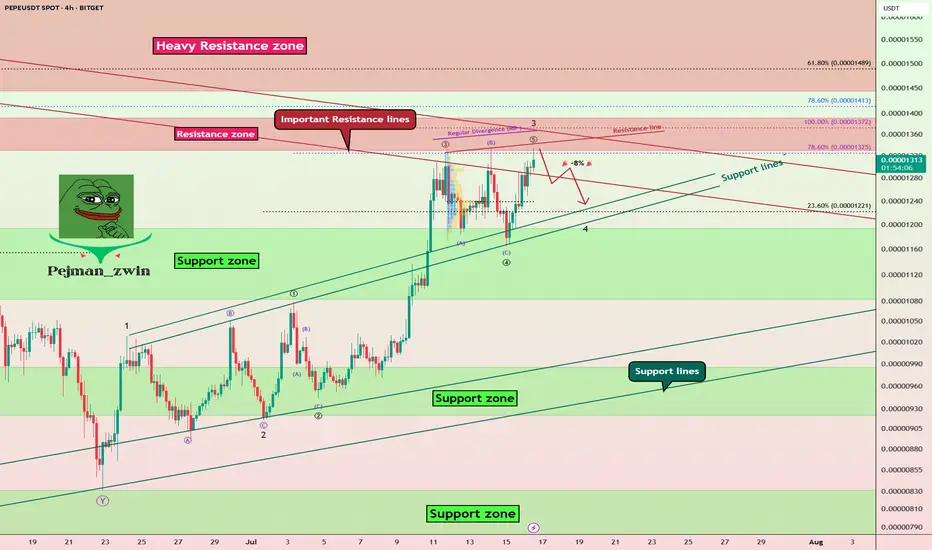
PEPE Faces Key Resistances – Is a -8% Pullback Coming?The PEPE memecoin ( BINANCE:PEPEUSDT ) is currently near the Resistance zone($0.00001392-$0.00001330) and Important Resistance lines . This is the third time that PEPE has attacked the Important Resistance lines .
In terms of Elliott wave theory , it seems that PEPE is completing the microwave 5 of the main wave 3 , so that the main wave 3 is of the extended type .
Also, we can see the Regular Divergence(RD-) between Consecutive Peaks.
I expect a -8% drop for PEPE in the coming hours.
First Target: $0.00001251
Second Target: $0.00001212
Note: Stop Loss(SL)= $0.00001400
Please respect each other's ideas and express them politely if you agree or disagree.
PEPE Analyze (PEPEUSDT), 4-hour time frame.
Be sure to follow the updated ideas.
Do not forget to put a Stop loss for your positions (For every position you want to open).
Please follow your strategy and updates; this is just my Idea, and I will gladly see your ideas in this post.
Please do not forget the ✅' like '✅ button 🙏😊 & Share it with your friends; thanks, and Trade safe.
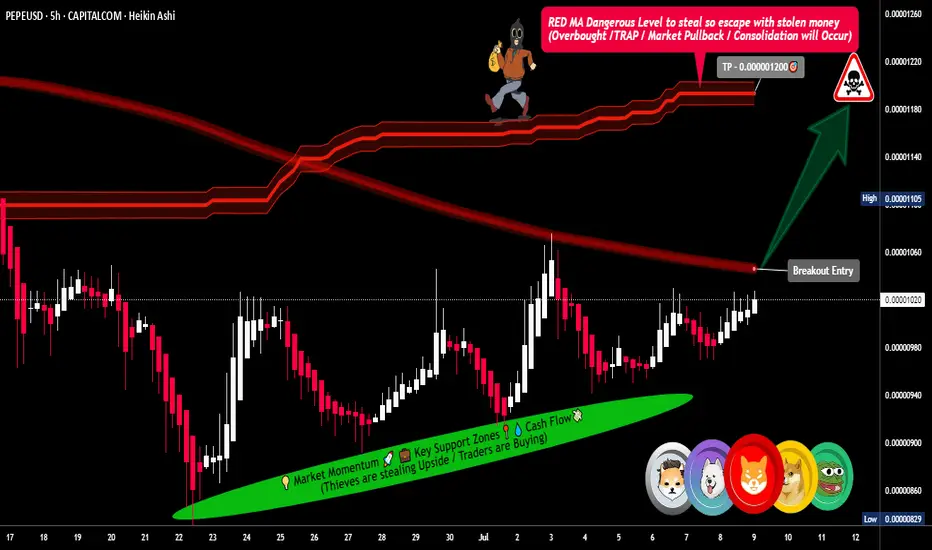
PEPE/USD Market Heist: Thief Entry Plan for Big Gains🔥🚨 Thieves of Wall Street: PEPE/USD Crypto Robbery Blueprint 🚨🔥
The Ultimate “Thief Style” Trade Setup That Even Wall Street Would Envy
— A High-Risk, High-Reward Playbook for Market Outlaws —
🌍 Hello Global Money Grabbers!
Hola | Ola | Bonjour | Hallo | Marhaba | Namaste 💰🌐
Welcome to the Thief Trading Zone — where smart rebels don’t chase price, they trap it, rob it, and run off with the profits. 🏴☠️
💸 Mission: PEPE/USD Market Infiltration
🎯 Objective:
Infiltrate the PEPE/USD crypto zone where the big bears sleep — and strike long in the danger zone where most traders panic and exit. That’s where we thrive.
🔍 Trade Setup: The Heist Blueprint
Market: PEPE/USD
Play: Long Entry (Thief-Style Reversal Tactic)
Zone: Red-Hot Resistance Turned Reversal (aka the Profit Trap Zone)
🧨 Entry Strategy:
Wait for the breakout through the Red Moving Average wall at 0.00001060 — that’s your signal the vault is open.
🔑 Execution Plan:
Place Buy Stop Orders just above the breakout level.
Deploy Buy Limit Orders at 15-min/30-min swing lows or consolidation traps.
Use DCA/Layering Entry Style — like a true thief, you never go all in at once.
⚙️ Set Alerts on breakout zones — thieves never sleep on opportunity!
🛑 Stop Loss Tactics (Stealth Exit):
Primary SL: Set just below recent swing low on 5H chart (around 0.00000960).
Wait for the breakout before dropping that SL — don’t get caught too early.
Risk management is your getaway vehicle. Don’t crash it.
🎯 Targets:
Primary Exit: 0.00001200
Optional Early Exit: If the heat’s on, take the bag and disappear. 🏃♂️💨
Always trail your SL to protect your loot.
💡 Scalping & Swing Heist Tips:
Scalpers: Only ride the long waves.
Swing Thieves: Set your traps and be patient — big moves take time.
Big Wallets: Dive in.
Small Wallets: Ride with protection and precision.
🔎 Market Insight (Thief Intel Drop):
PEPE/USD is flashing bullish signals across:
On-chain analytics
COT positioning
Sentiment reversal indicators
Macro economic setups
Intermarket synergy
Get your confirmations before acting — we rob smart, not blind.
⚠️ News & Heat Map Alert:
High-impact news = flashing red lights 🚨
Avoid new positions during major announcements.
Already in the game? Use trailing SL to secure your profits while chaos brews.
🚀 Boost the Robbery!
Smash that Boost Button to join the elite crew of thief traders flipping charts for fun & profit every day. 💎📈
Stay sneaky, stay smart — this ain’t gambling, it’s organized market crimee (the smart kind).
🎭💰 Next Heist Coming Soon — Follow for More Robbery Blueprints! 💣💼
PEPEUSD going to moon according to my analysis. {08/june/2025}Educational Analysis says that PEPEUSD may give trend Trading opportunities from this range, according to my technical analysis.
Broker - binance
So, my analysis is based on a top-down approach from weekly to trend range to internal trend range.
So my analysis comprises of two structures: 1) Break of structure on weekly range and 2) Trading Range to fill the remaining fair value gap
Let's see what this pair brings to the table for us in the future.
Please check the comment section to see how this turned out.
DISCLAIMER:-
This is not an entry signal. THIS IS FOR EDUCATIONAL PURPOSES ONLY.
I HAVE NO CONCERNS WITH YOUR PROFIT OR LOSS,
Happy Trading, Fx Dollars.

PEPEUSDT Critical Decision Zone – Massive Move Incoming?🧠 Macro Technical Analysis
PEPEUSDT is currently hovering within a critical demand zone (0.00000095 – 0.00000110), an area that has historically acted as a strong accumulation base and a launchpad for previous rallies. The chart structure shows multiple interactions with this zone, highlighting its significance as a key inflection level.
This zone is not just a support — it’s a make-or-break battlefield between bulls and bears. Price is consolidating within this zone, setting the stage for a potential explosive breakout or a dangerous breakdown.
🔍 Pattern Breakdown & Key Technical Levels
Accumulation Zone (Yellow Box):
Seen from April 2024 to now, price has bounced several times from this region. The multiple touches and long wicks confirm strong buying interest here.
Sideways Channel / Range-Bound Structure:
Price action between 0.00000110 and 0.00000283 has formed a clear horizontal range, and the current price is once again testing the lower boundary of this range.
Implied Move Projection (Yellow Arrow):
A potential breakout from this range could trigger a measured move to the upside, aiming for the previous high at 0.00000283 — representing a +150% upside potential from current levels.
📈 Bullish Scenario:
1. Price holds above 0.00000100, maintaining structure above demand.
2. Break and daily close above:
0.00000127 (minor resistance)
Then 0.00000140, which could trigger acceleration.
3. Target levels to watch:
🟡 0.00000162 – Intermediate resistance
🟡 0.00000180 – Confluence zone
🟡 0.00000211 – Mid-range mark
🟡 0.00000240 – Major breakout checkpoint
🟡 0.00000283 – Range high and final bullish target
Break above 0.00000283 could open a parabolic rally.
📉 Bearish Scenario:
1. Breakdown below 0.00000095, followed by rejection from the bottom of the demand zone.
2. This could signal:
Weak market structure
Failed accumulation
Invalidation of the bullish setup
Key downside levels:
🔻 0.00000080 – Local support
🔻 0.00000065 – Historical low defense
🔻 0.00000038 – Macro capitulation zone
⚠️ Breakdown from current levels will turn this accumulation into distribution.
🧭 Strategic Takeaway:
PEPE is trading at a decisive zone. A bounce from this level could signal the start of a new bullish phase, while a breakdown could usher in a deeper bearish trend. Traders should closely monitor volume spikes, breakout candles, and confirmations above 0.00000127 to validate bullish momentum.
This is a low-risk, high-reward setup for disciplined traders with proper risk management.
#PEPEUSDT #PEPE #CryptoTechnicalAnalysis #AltcoinBreakout #MemeCoinSeason #CryptoTrading #AccumulationZone #BreakoutAlert #BullishCrypto #BearishScenario

Pepe update hello friends✋️
Considering the drop we had, you can see that the price was well supported in the specified area and buyers came in. Now in the return of the price, we can buy step by step in the specified support areas and move with it until the specified goals, of course, with the management of shame and risk...
*Trade safely with us*

pepe updateentry price 0.00001425
stop loss update 0.00001425
take profit
0.00001172
0.00001022
0.0000086
result full target

#PEPEUSDT: Major Swing Upcoming! Get Ready! PEPEUSDT is currently in phase two of accumulation and will distribute the price soon. We expect the price to move in a bullish impulse pattern as we anticipate volatility in the coming days. However, we advise having a secondary bias while investing or trading on cryptocurrency, as it is highly risky and lacks the same volume as forex or gold.
Good luck and trade safely!
Team Setupsfx_

PEPE at Key Reversal Zone — Support Test Coming Soon?Today I want to look at the PEPE token ( BINANCE:PEPEUSDT ), which is part of the memecoin category, and provide you with a short-term analysis on the 1-hour timeframe .
PEPE token is trading in Potential Reversal Zone(PRZ) .
In terms of Elliott wave theory , the PEPE token appears to be completing the microwave 5 of the main wave C . The structure is a Zigzag Correction(ABC/5-3-5) .
Also, we can see the Regular Divergence(RD-) between Consecutive Peaks .
I expect the PEPE token to attack the Support zone($0.0000120-$0.0000108) after completing the main wave C .
Note: Stop Loss = $0.0000362
Please respect each other's ideas and express them politely if you agree or disagree.
Pepe Analyze (PEPEUSDT), 1-hour time frame.
Be sure to follow the updated ideas.
Do not forget to put a Stop loss for your positions (For every position you want to open).
Please follow your strategy and updates; this is just my Idea, and I will gladly see your ideas in this post.
Please do not forget the ✅' like '✅ button 🙏😊 & Share it with your friends; thanks, and Trade safe.

They saw weakness. I saw PEPE return to the source.Every time price dropped today, people called it a breakdown.
But Smart Money doesn’t break price — they rebalance it.
PEPE just swept the prior low into 0.00001145 — the 0.786 retracement — and bounced. No hesitation. That wick? That was engineered. The goal wasn’t to fall — it was to fill.
Now we sit below the 15m OB at 0.00001167–0.00001175. That’s the gate. If price reclaims and consolidates above this zone, the next draw becomes obvious: 0.00001204 — clean inefficiency, clean liquidity.
If it rejects? Watch for one more final liquidity raid into 0.00001129 before the macro expansion.
Execution breakdown:
🔑 Entry: 0.00001145 (0.786)
🎯 TP 1: 0.00001175 (OB mitigation)
🎯 TP 2: 0.00001204 (full inefficiency reclaim)
❌ Invalidation: sustained close below 0.00001129
The chart didn’t break down.
It paused — to let the untrained exit early.

Don't miss today's signal.Hello friends
Given the good growth we had, the price has corrected and now we can buy in steps in the specified areas with capital and risk management and move with it to the set goals.
*Trade safely with us*

Pepe/Usdt Long % 150 A major breakout in Pepe/USDT is expected to start soon. There is a formation similar to the previous bull run. The bull mode is about to be activated, everyone get ready. We are starting.

High R/R Swing Setup on PEPE – Eyes on 100%+ MoveThe 1D chart for PEPEUSDT is showing a clean bullish structure, supported by repeated rejections from a key support level and a recent breakout above short-term resistance. This setup offers a simple yet potentially high-reward trade opportunity for swing traders.
📊 Trade Setup
Entry: 0.00001269 USDT
Price has confirmed a bullish reversal and is currently hovering above a minor consolidation range, presenting a strong opportunity for a long position.
Stop Loss: 0.00001079 USDT
Placed just below the previous local lows to invalidate the setup in case of a breakdown.
Take Profit 1 (TP1): 0.00002135 USDT
This level represents a previous high and a clear horizontal resistance zone.
Take Profit 2 (TP2): 0.00002844 USDT
A higher resistance level, also aligning with historical price action, offering a potential 103% gain from entry.
📈 Technical Justification
Key Support Holding: Price has shown multiple rejections near the 0.00000565 USDT level, forming a strong support base. Each rejection has resulted in a higher low, indicating increasing bullish momentum.
Trendline Confirmation: The ascending trendline shows sustained bullish pressure and confirms the strength of the ongoing trend.
Breakout Setup: Current price action indicates a breakout from consolidation, supported by volume. The bullish structure remains intact as long as the price holds above the 0.00001079 SL region.
Risk-to-Reward: The setup offers an attractive 4.5 R/R ratio, making it highly favorable for swing trading.
📌 Summary
This is a clean, trend-continuation trade with defined risk and strong technical backing. Traders looking for a mid-term opportunity should keep an eye on volume and price action around TP1 for potential partial exits or trailing stop adjustments.

Is PEPE About to Explode? Critical Breakout Level Incoming!Yello, Paradisers! Are you ready for what could be the breakout #PEPE bulls have been waiting for since February?
💎After a long, painful downside grind, PEPE is finally shaping up for a potential bullish reversal. The price action has entered an ascending triangle, often a reliable pattern that hints at an incoming breakout. This setup is now flashing signals that momentum is shifting but it all hinges on one critical zone.
💎#PEPEUSDT is currently eyeing the $0.0000088 – $0.0000090 region, a heavy resistance that’s proven itself multiple times since February 24th. Bulls have failed to conquer this level on several occasions, and now, the 12-hour EMA-200 is also sitting in this area, a dynamic resistance reinforcing this as a crucial inflection point.
💎If the bulls can finally break through $0.0000090 with clear volume confirmation, PEPE could open up upside potential towards $0.00001135. This level is likely to attract some short-term profit-taking, but if momentum holds, we could see a push towards the much stronger $0.00001400 – $0.00001490 zone. This region lines up with a multi-point confluence, including a significant horizontal resistance and the 38.20% Fibonacci retracement level — both strong technical barriers that may define the next major move.
💎Support is also well-defined for now. The 12-hour EMA-50 is acting as dynamic support and currently sits around the $0.00000720 level. PEPE has been respecting this level well, and any temporary pullbacks may bounce from here. Below this, the $0.00000650 – $0.00000570 range remains the key support zone. This zone held firm during the last dips and is likely to absorb any upcoming selling pressure if the breakout fails short-term.
Paradisers, strive for consistency, not quick profits. Treat the market as a businessman, not as a gambler.
MyCryptoParadise
iFeel the success🌴

PEPE 80% Profit🚀 BINANCE:PEPEUSDT just made a big move!
It surged from 0.00000820 to 0.00001244 and then corrected to 0.00000956 📉
Now it’s sitting on strong support — and if it holds, another rally could be on the way! 💥
🎯 Next resistance levels:
0.00001244 (recent high)
0.00001719 (next key level)
0.00002317 (major long-term target) 🏁
📌 Key support zones:
0.00000956 (current support)
0.00000820 (late May support)

#PEPE/USDT#PEPE
The price is moving within a descending channel on the 1-hour frame, adhering well to it, and is on its way to breaking it strongly upwards and retesting it.
We are seeing a bounce from the lower boundary of the descending channel. This support is at 0.00000570.
We have a downtrend on the RSI indicator that is about to break and retest, supporting the upward trend.
We are looking for stability above the 100 moving average.
Entry price: 0.00000700
First target: 0.00000751
Second target: 0.00000798
Third target: 0.00000871

PEPEUSDT - Now waiting for another 100% move.It already made a 100% move from the zone we mentioned earlier, breaking the downtrend line with a massive bullish candle on the 3-day timeframe.
It’s now on its way to forming a new all-time high (ATH).
Best regards Ceciliones 🎯

PEPE Building Momentum – Eyes on 100 EMA BreakoutCRYPTOCAP:PEPE is respecting a rising trendline beautifully, with multiple successful touches (highlighted in yellow), showing strong underlying support.
The price recently bounced again from this trendline, right above a key horizontal support zone. Additionally, the MACD indicator is turning positive, suggesting growing bullish momentum.
Currently, PEPE is approaching the 100 EMA resistance. A clean breakout above the 100 EMA could open the path toward the key resistance zone above.
DYOR, NFA

#PEPEUSDT: Ready to launch | Will price hit previous high? EPEUSDT’s price has accumulated and is currently in the distribution phase, where we can anticipate a bullish impulse pattern. There are three targets, but our long-term objective is for the price to surpass its previous record high. We anticipate the price to reach or even surpass the previous high.
Wishing you good luck and safe trading!
Thank you for your unwavering support! 😊
If you’d like to contribute, here are a few ways you can help us:
- Like our ideas
- Comment on our ideas
- Share our ideas
Team Setupsfx_
❤️🚀
