PEPE/USD Market Heist: Thief Entry Plan for Big Gains🔥🚨 Thieves of Wall Street: PEPE/USD Crypto Robbery Blueprint 🚨🔥
The Ultimate “Thief Style” Trade Setup That Even Wall Street Would Envy
— A High-Risk, High-Reward Playbook for Market Outlaws —
🌍 Hello Global Money Grabbers!
Hola | Ola | Bonjour | Hallo | Marhaba | Namaste 💰🌐
Welcome to the Thief Trading Zone — where smart rebels don’t chase price, they trap it, rob it, and run off with the profits. 🏴☠️
💸 Mission: PEPE/USD Market Infiltration
🎯 Objective:
Infiltrate the PEPE/USD crypto zone where the big bears sleep — and strike long in the danger zone where most traders panic and exit. That’s where we thrive.
🔍 Trade Setup: The Heist Blueprint
Market: PEPE/USD
Play: Long Entry (Thief-Style Reversal Tactic)
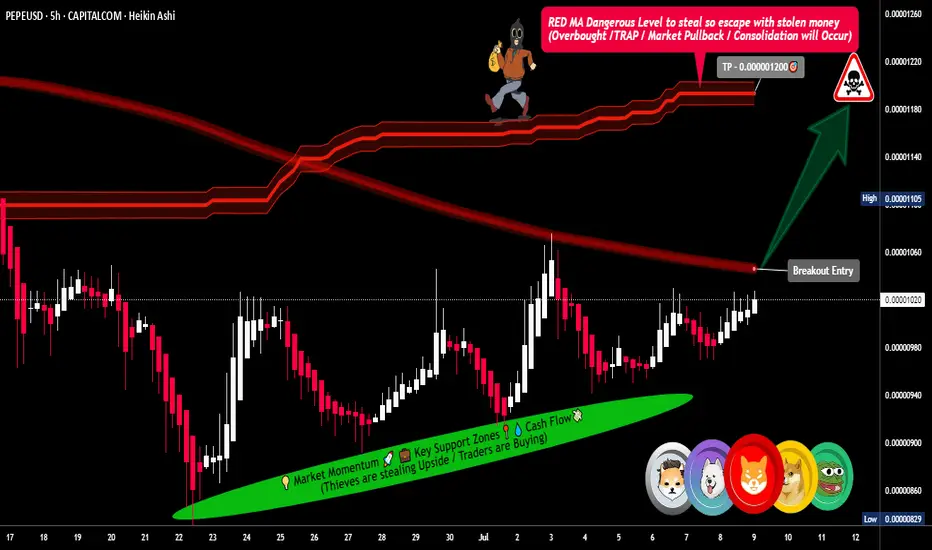
Zone: Red-Hot Resistance Turned Reversal (aka the Profit Trap Zone)
🧨 Entry Strategy:
Wait for the breakout through the Red Moving Average wall at 0.00001060 — that’s your signal the vault is open.
🔑 Execution Plan:
Place Buy Stop Orders just above the breakout level.
Deploy Buy Limit Orders at 15-min/30-min swing lows or consolidation traps.
Use DCA/Layering Entry Style — like a true thief, you never go all in at once.
⚙️ Set Alerts on breakout zones — thieves never sleep on opportunity!
🛑 Stop Loss Tactics (Stealth Exit):
Primary SL: Set just below recent swing low on 5H chart (around 0.00000960).
Wait for the breakout before dropping that SL — don’t get caught too early.
Risk management is your getaway vehicle. Don’t crash it.
🎯 Targets:
Primary Exit: 0.00001200
Optional Early Exit: If the heat’s on, take the bag and disappear. 🏃♂️💨
Always trail your SL to protect your loot.
💡 Scalping & Swing Heist Tips:
Scalpers: Only ride the long waves.
Swing Thieves: Set your traps and be patient — big moves take time.
Big Wallets: Dive in.
Small Wallets: Ride with protection and precision.
🔎 Market Insight (Thief Intel Drop):
PEPE/USD is flashing bullish signals across:
On-chain analytics
COT positioning
Sentiment reversal indicators
Macro economic setups
Intermarket synergy
Get your confirmations before acting — we rob smart, not blind.
⚠️ News & Heat Map Alert:
High-impact news = flashing red lights 🚨
Avoid new positions during major announcements.
Already in the game? Use trailing SL to secure your profits while chaos brews.
🚀 Boost the Robbery!
Smash that Boost Button to join the elite crew of thief traders flipping charts for fun & profit every day. 💎📈
Stay sneaky, stay smart — this ain’t gambling, it’s organized market crimee (the smart kind).
🎭💰 Next Heist Coming Soon — Follow for More Robbery Blueprints! 💣💼
Pepeusdtsignal
PEPEUSDT Critical Decision Zone – Massive Move Incoming?🧠 Macro Technical Analysis
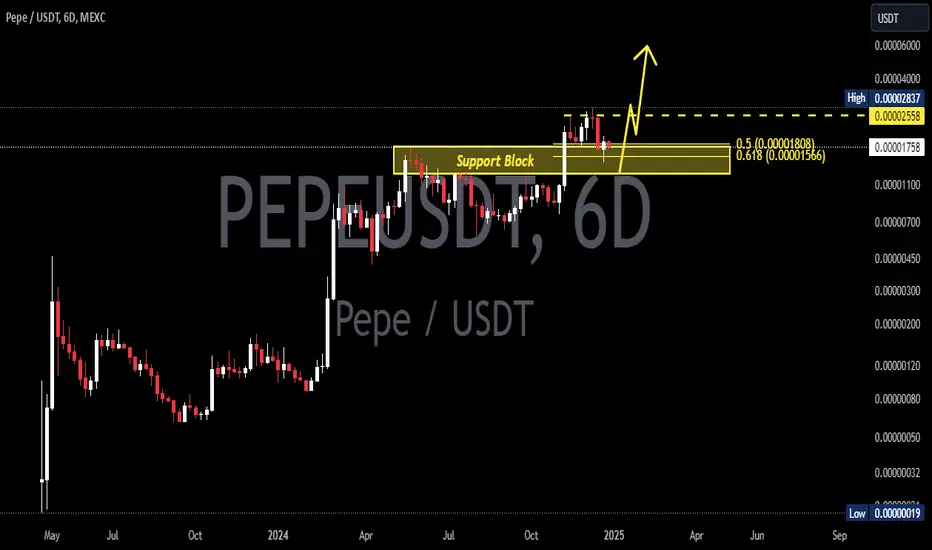
PEPEUSDT is currently hovering within a critical demand zone (0.00000095 – 0.00000110), an area that has historically acted as a strong accumulation base and a launchpad for previous rallies. The chart structure shows multiple interactions with this zone, highlighting its significance as a key inflection level.
This zone is not just a support — it’s a make-or-break battlefield between bulls and bears. Price is consolidating within this zone, setting the stage for a potential explosive breakout or a dangerous breakdown.
🔍 Pattern Breakdown & Key Technical Levels
Accumulation Zone (Yellow Box):
Seen from April 2024 to now, price has bounced several times from this region. The multiple touches and long wicks confirm strong buying interest here.
Sideways Channel / Range-Bound Structure:
Price action between 0.00000110 and 0.00000283 has formed a clear horizontal range, and the current price is once again testing the lower boundary of this range.
Implied Move Projection (Yellow Arrow):
A potential breakout from this range could trigger a measured move to the upside, aiming for the previous high at 0.00000283 — representing a +150% upside potential from current levels.
📈 Bullish Scenario:
1. Price holds above 0.00000100, maintaining structure above demand.
2. Break and daily close above:
0.00000127 (minor resistance)
Then 0.00000140, which could trigger acceleration.
3. Target levels to watch:
🟡 0.00000162 – Intermediate resistance
🟡 0.00000180 – Confluence zone
🟡 0.00000211 – Mid-range mark
🟡 0.00000240 – Major breakout checkpoint
🟡 0.00000283 – Range high and final bullish target
Break above 0.00000283 could open a parabolic rally.
📉 Bearish Scenario:
1. Breakdown below 0.00000095, followed by rejection from the bottom of the demand zone.
2. This could signal:
Weak market structure
Failed accumulation
Invalidation of the bullish setup
Key downside levels:
🔻 0.00000080 – Local support
🔻 0.00000065 – Historical low defense
🔻 0.00000038 – Macro capitulation zone
⚠️ Breakdown from current levels will turn this accumulation into distribution.
🧭 Strategic Takeaway:
PEPE is trading at a decisive zone. A bounce from this level could signal the start of a new bullish phase, while a breakdown could usher in a deeper bearish trend. Traders should closely monitor volume spikes, breakout candles, and confirmations above 0.00000127 to validate bullish momentum.
This is a low-risk, high-reward setup for disciplined traders with proper risk management.
#PEPEUSDT #PEPE #CryptoTechnicalAnalysis #AltcoinBreakout #MemeCoinSeason #CryptoTrading #AccumulationZone #BreakoutAlert #BullishCrypto #BearishScenario

#PEPEUSDT: Major Swing Upcoming! Get Ready! PEPEUSDT is currently in phase two of accumulation and will distribute the price soon. We expect the price to move in a bullish impulse pattern as we anticipate volatility in the coming days. However, we advise having a secondary bias while investing or trading on cryptocurrency, as it is highly risky and lacks the same volume as forex or gold.
Good luck and trade safely!
Team Setupsfx_

pepe Updateentry price 0.00001425
stop loss update 0.00001425
take profit
0.00001172
0.00001022
0.0000086
result 1 target and risk free

Is PEPE Ready for Its Next Leg Up? Key Support Levels to Watch! PEPE/USDT Analysis: Bullish Trend, Pullback, and Opportunity 🚀🐸
👋 Today, I’m taking a look at the PEPE/USDT chart. We’ve seen PEPE in a strong bullish trend lately, riding a strong momentum wave. Theres a shift at the moment when you look at the broader market—US dollar strength is still in play, and we’re seeing some pullbacks in Bitcoin and other major cryptos. 💵📉
PEPE is starting to pull back. This isn’t a bad thing—in fact, healthy pullbacks are what set up the next big moves. What I’m watching for is a retracement down into a key support zone. If price can hold there and we see a bullish break of structure, that’s my cue to look for a buy opportunity. 🛑➡️📈
The key here is patience. I want to see confirmation that buyers are stepping back in—i.e. strong bullish candles, a clear break of the recent lower high (BoS), or even a spike in volume. If we get that, I’ll be ready to ride the next leg up. Until then, I’m biding my time and letting the market come to me. 🕰️
Remember, no FOMO—let the setup come to you, and always manage your risk.🍀

PEPEUSDT 2DPEPE ~ 2D Analysis
#PEPE Buy after successfully penetrating this resistant line with a short -term target of at least 15%+ from here.

PEPEUSDT Eyes the Sky!BINANCE:PEPEUSDT has shown a strong bounce from a key support level, signaling potential for a continued bullish move. The overall market sentiment is positive, which could act as a catalyst for further upside. With the price structure leaning bullish and momentum picking up, there’s a good chance we’ll see higher highs in the coming sessions. Traders should keep an eye on the next resistance zone as a possible target while maintaining disciplined risk management. Always trade with a clear plan—and most importantly, don’t forget your stop loss!
$1000PEPEUSDT Currently trading at $0.00735
Buy level : Above $0.0071
Stop loss : Below $0.0056
Target : $0.0145
Max leverage 3x
Always keep Stop loss
Follow Our Tradingview Account for More Technical Analysis Updates, | Like, Share and Comment Your thoughts

PEPEUSDT 2DPEPE ~ 2D Analysis
#PEPE Buy gradually after re -testing this support with a short -term target of at least 15%+.

PEPEUSDT 2DPEPE ~ 2D Analysis
#PEPE If you still have a Conviction on this coin, maybe this support you can consider to start buying back with a short -term target of at least 15%+.

PEPEUSDT 4DPEPE ~ 4D Analysis
#PEPE This is a support that was previously an area of accumulation. Buy from here with a minimum target of 20%+

PEPEUSDT %85 Daily Volume SpikeWe previously observed a 25% reaction from the blue box in PEPEUSDT, as mentioned in my earlier analysis. As you can see here:https://www.tradingview.com/chart/PEPEUSDT/VP77qwjf-PEPEUSDT-Flash-Crash-I-m-Ready/
If you utilized low-time frame market breakdowns, you could have caught some excellent risk-to-reward (RR) opportunities. From the latest blue box.
Currently, the price seems to be consolidating, and there is an 85% increase in trading volume today, which is significant. Despite my overall bullish outlook, I believe the price may seek lower levels before continuing its upward trajectory. This potential pullback could provide a new and favorable positioning opportunity.
How to create a position?
When price going down, sometimes CDV goes up, it means an opportunity if general outlook is bullish.
Sometimes we took a retest from volume profile "Point of Control" line and when we reach there we see huge buyers coming in Volume Footprint, it means you can look for an entry.
When trading the blue box, I will rely on indicators like:
Cumulative Delta Volume (CDV)
Liquidity Heatmap
Volume Profile
Volume Footprint
Additionally, I will look for upward market structure breaks in lower time frames for confirmation.
If you'd like to learn how to utilize CDV, liquidity heatmaps, volume profiles, and volume footprints effectively, feel free to visit my profile and contact me.
Best of luck and manage your risk wisely!
If you think this analysis helps you, please don't forget to boost and comment on this. These motivate me to share more insights with you!
I keep my charts clean and simple because I believe clarity leads to better decisions.
My approach is built on years of experience and a solid track record. I don’t claim to know it all, but I’m confident in my ability to spot high-probability setups.
If you would like to learn how to use the heatmap, cumulative volume delta and volume footprint techniques that I use below to determine very accurate demand regions, you can send me a private message. I help anyone who wants it completely free of charge.
My Previous Analysis (the list is long but I think it's kinda good : )
🎯 ZENUSDT.P: Patience & Profitability | %230 Reaction from the Sniper Entry
🐶 DOGEUSDT.P: Next Move
🎨 RENDERUSDT.P: Opportunity of the Month
💎 ETHUSDT.P: Where to Retrace
🟢 BNBUSDT.P: Potential Surge
📊 BTC Dominance: Reaction Zone
🌊 WAVESUSDT.P: Demand Zone Potential
🟣 UNIUSDT.P: Long-Term Trade
🔵 XRPUSDT.P: Entry Zones
🔗 LINKUSDT.P: Follow The River
📈 BTCUSDT.P: Two Key Demand Zones
🟩 POLUSDT: Bullish Momentum
🌟 PENDLEUSDT.P: Where Opportunity Meets Precision
🔥 BTCUSDT.P: Liquidation of Highly Leveraged Longs
🌊 SOLUSDT.P: SOL's Dip - Your Opportunity
🐸 1000PEPEUSDT.P: Prime Bounce Zone Unlocked
🚀 ETHUSDT.P: Set to Explode - Don't Miss This Game Changer
🤖 IQUSDT: Smart Plan
⚡️ PONDUSDT: A Trade Not Taken Is Better Than a Losing One
💼 STMXUSDT: 2 Buying Areas
🐢 TURBOUSDT: Buy Zones and Buyer Presence
🌍 ICPUSDT.P: Massive Upside Potential | Check the Trade Update For Seeing Results
🟠 IDEXUSDT: Spot Buy Area | %26 Profit if You Trade with MSB
📌 USUALUSDT: Buyers Are Active + %70 Profit in Total
🌟 FORTHUSDT: Sniper Entry +%26 Reaction
🐳 QKCUSDT: Sniper Entry +%57 Reaction
📊 BTC.D: Retest of Key Area Highly Likely
I stopped adding to the list because it's kinda tiring to add 5-10 charts in every move but you can check my profile and see that it goes on..

PEPEUSDT 6DPEPE Update ~ 6D
#PEPE So far it still maintains its bullish structure. Buy gradually within this support block,. it's only a matter of time these Memes will make new highs.

PEPEUSDTPEPE ~ 1D ✅
#PEPE Make purchases gradually on this support block, short term target of at least 10%+ 🟡

PEPEUSDT 4HPEPE ~ 4H
#PEPE For the short term, This is a Bullish pattern. Purchase after breaking through the Resistance line of this pattern.

PEPEUSDT Elliott Waves AnalysisHello friends.
Please support my work by clicking the LIKE button👍(If you liked). Also i will appreciate for ur activity. Thank you!
Everything on the chart.
Entry: Market and lower
Targets: 0.0000009 - 0.000012 - 0.000014 - 0.000017
after first target reached move ur stop to breakeven
Stop: (depending of ur risk).
ALWAYS follow ur RM
risk is justified
Good luck everyone!
Follow me on TRADINGView, if you don't want to miss my next analysis or signals.
It's not financial advice.
DYOR!
