PERPUSDT – Right Setup, Right PlaceThe target is clear, the green line.
But how you get there matters more than if you get there.
🧊 Inclusion Plan
The blue boxes are where I’d consider entry.
They’re not just price zones — they’re areas of alignment:
Historical consolidation - Volume profile acceptance
Footprint showing seller weakness
Yes, you could enter earlier,
but that wouldn’t be optimal.
✅ Smart Execution
Wait for price to revisit the box with control.
Watch CDV for demand confirmation,
and structure reclaim on LTFs before committing.
“You don’t win by being early. You win by being precise.”
No chasing. No guessing.
Just smart inclusion where the math makes sense.
📌I keep my charts clean and simple because I believe clarity leads to better decisions.
📌My approach is built on years of experience and a solid track record. I don’t claim to know it all but I’m confident in my ability to spot high-probability setups.
📌If you would like to learn how to use the heatmap, cumulative volume delta and volume footprint techniques that I use below to determine very accurate demand regions, you can send me a private message. I help anyone who wants it completely free of charge.
🔑I have a long list of my proven technique below:
🎯 ZENUSDT.P: Patience & Profitability | %230 Reaction from the Sniper Entry
🐶 DOGEUSDT.P: Next Move
🎨 RENDERUSDT.P: Opportunity of the Month
💎 ETHUSDT.P: Where to Retrace
🟢 BNBUSDT.P: Potential Surge
📊 BTC Dominance: Reaction Zone
🌊 WAVESUSDT.P: Demand Zone Potential
🟣 UNIUSDT.P: Long-Term Trade
🔵 XRPUSDT.P: Entry Zones
🔗 LINKUSDT.P: Follow The River
📈 BTCUSDT.P: Two Key Demand Zones
🟩 POLUSDT: Bullish Momentum
🌟 PENDLEUSDT.P: Where Opportunity Meets Precision
🔥 BTCUSDT.P: Liquidation of Highly Leveraged Longs
🌊 SOLUSDT.P: SOL's Dip - Your Opportunity
🐸 1000PEPEUSDT.P: Prime Bounce Zone Unlocked
🚀 ETHUSDT.P: Set to Explode - Don't Miss This Game Changer
🤖 IQUSDT: Smart Plan
⚡️ PONDUSDT: A Trade Not Taken Is Better Than a Losing One
💼 STMXUSDT: 2 Buying Areas
🐢 TURBOUSDT: Buy Zones and Buyer Presence
🌍 ICPUSDT.P: Massive Upside Potential | Check the Trade Update For Seeing Results
🟠 IDEXUSDT: Spot Buy Area | %26 Profit if You Trade with MSB
📌 USUALUSDT: Buyers Are Active + %70 Profit in Total
🌟 FORTHUSDT: Sniper Entry +%26 Reaction
🐳 QKCUSDT: Sniper Entry +%57 Reaction
📊 BTC.D: Retest of Key Area Highly Likely
📊 XNOUSDT %80 Reaction with a Simple Blue Box!
📊 BELUSDT Amazing %120 Reaction!
📊 Simple Red Box, Extraordinary Results
📊 TIAUSDT | Still No Buyers—Maintaining a Bearish Outlook
📊 OGNUSDT | One of Today’s Highest Volume Gainers – +32.44%
📊 TRXUSDT - I Do My Thing Again
📊 FLOKIUSDT - +%100 From Blue Box!
📊 SFP/USDT - Perfect Entry %80 Profit!
📊 AAVEUSDT - WE DID IT AGAIN!
I stopped adding to the list because it's kinda tiring to add 5-10 charts in every move but you can check my profile and see that it goes on..
Perpetual

ETH 1W – Long above 200MA | Retest or Launch?ETH just broke two major barriers:
✅ Closed above the 200MA on the weekly
✅ Broke out of the pink zone, which marks the textbook double top base from June & December 2024
That pink box held price for months — a structural pivot that now flips from resistance to possible support.
Price paused into the 50MA, which typically doesn’t offer heavy resistance on the 1W.
If we see a pullback, I’m watching for a wick into the 200MA or even into the pink zone. Otherwise, this might just go vertical if macro stays calm.

Perpetual Protocol Not Dead Yet (TAC-S7)Doesn't look good. If you follow, you know that I mention the mid-March low and the 3-Feb. low. A bullish reversal signal we've been tracking moves around these levels. When a pair recovers above one of these, or both, after the 7-April crash we take it as bullish.
PERPUSDT looks bad because it is still trading below both lows, March and Feb. There is a positive signal though, there is really high volume in early April, and this is really high.
This can signal that the low is in and the current retrace will end as a higher low. Needless to say, this would be followed by a wave of growth.
Another interpretation can be around one final drop for this pair, say it gets delisted from a major exchange, this causes one more flush, huge flush, and only after this flush we can experience growth. This is just a possibility. The chart is weak and does not have many signals that support a recovery but, the market is one. What one does, the rest follows. And the volume is in.
PERPUSDT doesn't look good, but everything can change in a matter of weeks, 2-3 weeks.
We can revisit again and see what the chart says. Still, if you are confident in this project, there is room to accumulate. If you have many options and have to choose, many, many pairs look better than this. While this isn't a sure miss, it is better to go with those with lower risk. Some have lower risk or stronger bullish signals which means that these can move sooner or with a higher level of certainty.
Namaste.

ETH 3D – System Trigger, 200MA Test & Death Cross Insight
This was the actual trigger for my ETH long.
The system gave the green light on 3D:
✅ PSAR flip
✅ MLR > SMA > BB center
Now ETH is testing the 200MA from below, which lines up with the 50/200 death cross — often seen as bearish, but here it likely confirms the bottom already built through March–April.
MACD is pushing up strong.
The signal came from this chart — and I'm still in the move.

IOUSDT: Inverse Head & Shoulders Breakout – The Reversal is RealBINANCE:IOUSDT has just completed a textbook Inverse Head and Shoulders pattern, one of the most reliable reversal setups in technical analysis. After a prolonged downtrend that left the asset oversold and undervalued, the market has begun to shift. We’ve now seen a clean breakout above the neckline and a healthy retracement back to it. A classic confirmation signal that often precedes strong bullish moves.
This shift is further supported by the emergence of higher highs and higher lows on the smaller timeframes, suggesting that bullish momentum is building. With the downtrend now exhausted, BINANCE:IOUSDT looks poised to begin a new uptrend that could offer solid upside potential for early entrants.
As always, risk management is key. While the pattern setup is strong, it’s crucial to place stop losses just below the right shoulder or neckline to protect against unexpected volatility. The market doesn’t offer guarantees, but this setup offers high-probability conditions worth paying attention to.
BINANCE:IOUSDT Currently trading at $0.98
Buy level : Above $0.95
Stop loss : Below $0.76
Target : $2.65
Max leverage 3x
Always keep stop loss
Follow Our Tradingview Account for More Technical Analysis Updates, | Like, Share and Comment Your thoughts

Bullish Reversal Breakout in PEiPEi/USDT with Target Zone Hello guys!
The PEiPEi/USDT daily chart presents a textbook inverse head and shoulders pattern, a classic bullish reversal formation. The structure is clearly labeled on the chart:
Left Shoulder: Formed in late January.
Head: Deep retracement bottoming in early March.
Right Shoulder: Completed in April with higher lows.
Neckline: Shown with a breakout accompanied by strong bullish momentum.
Following the breakout above the neckline, price action surged, breaking above a consolidation wedge and validating the pattern. The breakout is supported by volume and momentum, indicating strong bullish conviction.
Key Zones:
Breakout Level (Yellow Box): Around 0.000000045 – 0.000000050 USDT, acting as immediate support on a retest.
Target Zone (Blue Box): Marked around 0.000000085 – 0.000000100 USDT, representing a projected 80% upside move from the breakout point. This target aligns with a previous major supply/resistance zone from late 2024.
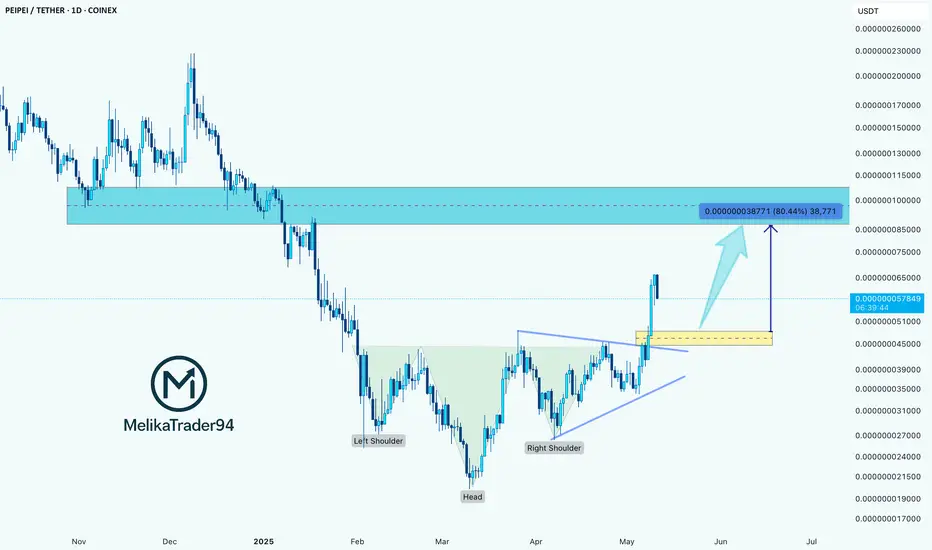
Chart structure reacts to memory. Momentum + reaction zones! BTCWhat you're seeing isn’t just price action—it's memory in motion.
🟥 Prior momentum shifts marked critical turning points where sellers temporarily dominated.
🟩 Support responses signaled reactive strength, giving early signs of accumulation.
📘 Consolidation zones show where price "remembered" to pause—these often act as launchpads or traps.
🟧 Swept demand cleared out weak hands before a sustained move.
📈 Historical resistance, once broken, becomes memory-based support.
Each label isn't a signal—it's a story.
This chart reminds us:
👉 Before price moves, it tests memory.
👉 Before breakouts, it absorbs emotion.
👉 And before trends, it reacts to old battles.
🧠 The more you study structure, the more you see intention—not randomness.

(PERP) perpetual "heightened activity in volume"Perpetual is showing an increase in volume for both sides of the table. This could be a sign of something to come that would otherwise be unexpected by most, perhaps a shot at a higher price. The bulk of activity is found in India 93% right now.

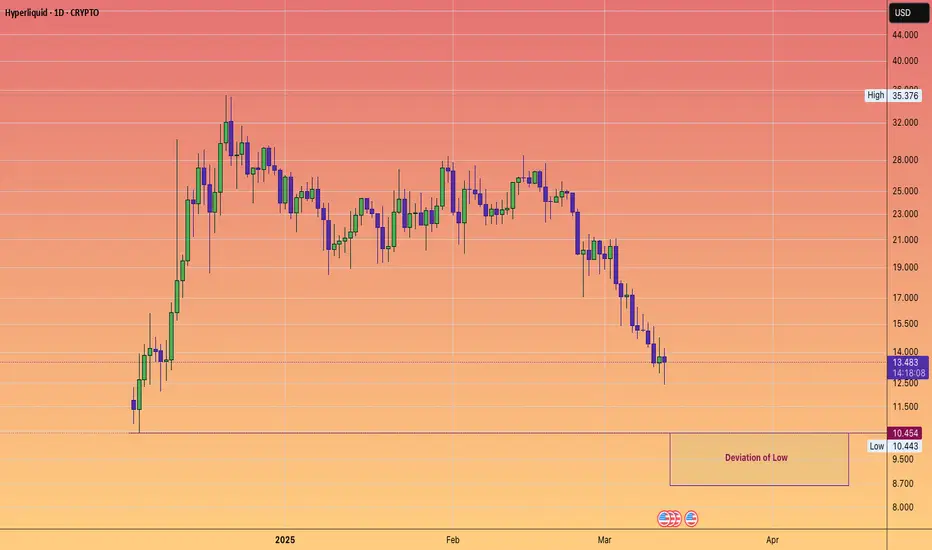
HYPERLIQUID LIQUIDATION SYSTEM EXPLOITED#HYPE is facing price declines following rumours of a malicious actor siphoning funds from the pool and taking advantage of the liquidation process.
While decentralised finance offers incredible opportunities, the actions of a single individual can lead to significant losses as investors pull their capital.
Let's hope Hyperliquid can enhance their security measures to prevent such incidents in the future.
LIMIT ORDER - RSS3/USDTLIMIT ORDER - $RSS3/USDT
Direction: #Short 🔴
Entry Price: 0.0414
Stop Loss: 0.043924
Target 1: 0.039645
Target 2: 0.037890
Target 3: 0.036136
Target 4: 0.034381
Target 5: 0.032626

PERPUSDT 1WPERP ~ 1W Analysis
#PERP This trade is very high risk. Buy gradually from here with a short -term target of at least 20%+. This is the lowest support for now.

Price Oscilattor with Entry and ExitPrice Oscillator Trend Reversal Strategy
Source: commodity.com -oscillator/
Indicators:
Price Oscillator (PO): Calculated as the difference between two Exponential Moving Averages (EMAs):
Short EMA (Fast Period): 9 days
Long EMA (Slow Period): 18 days
Thresholds:
• Overbought Level: PO >+2
•Oversold Level: PO <-2
Entry Conditions
Buy Entry (Long Position):
•PO crosses above the zero line from below (bullish crossover).
• OR PO moves into the oversold region (<-2) and starts to increase, indicating a potential reversal.
Sell Entry (Short Position):
• PO crosses below the zero line from above (bearish crossover).
• OR PO moves into the overbought region (>+2) starts to decrease, indicating a potential reversal.
Exit Conditions
Exit Long:
•PO crosses back below zero line.
Exit Short:
•PO crosses above 0 line.

Trading opportunity for BTCUSDT BitcoinBased on technical factors there is a Buy position in :
📊 BTCUSDT
🔵 Buy Now
🪫Stop loss 92750.00
🔋Target 1 106500.00
🔋Target 2 109900.00
🔋Target 3 115000.00
💸RISK : 1%
We hope it is profitable for you ❤️
Please support our activity with your likes👍 and comments📝

PUFFERUSDT, D1 chart Range Breakout trading plan,Long setup👋Hello Traders,
Our 🖥️ AI system detected that there is a H4 or higher timeframe ICT Long setup in
PUFFERUSDT for swing trade (a couple of weeks)
Here is a swing trade idea (since it is near support surface, we should use small lot size)
Please refer to the details Stop loss, Buy Zone,open for take profit.
We are waiting for next Long setup after price discount in coming days.
Crypto is highly risky, please do your own research on that coin before trading.
For more ideas, you are welcome to visit our profile in tradingview.
Have a good day!
Please give this post a like if you like this kind of simple idea, your feedback will bring our signal to next better level, thanks for support!


POPCAT: Our Next Crypto Swing PlayIt's been a while since we posted any crypto swing trades. The last few months have been particularly challenging for swing plays, and we made very good profits just by scalping in August. However, we've been closely monitoring the higher time frames, and we believe we've found a potential play with POPCAT.
For this trade to work out, we need BTC to behave, but so far, everything looks good, and the depth of the retracement is consistent with prior pullbacks. Recently, POPCAT has shown a change in structure after what seems to be a completed Wave (2). We want to bid on this continuation with a wider stop loss because there's a 12H FVG below that is relatively important for altcoins. There's a chance that we tag this FVG before rising higher, though a body close below it would invalidate our bullish outlook. Therefore, we're cautious but still want to place this bid, and we will DCA down if necessary. We'll keep you updated whenever we make any moves.
As for targets, we're looking to go above the high of the latest COS, then the fair value gap above, and finally, a continuation above the current Wave (1). If we get this far, we would let it run as a moonbag, but we'll keep you informed regardless.

BTC Bear Move Is Far From Over!I don't endorse any entry or exit actions based on any kind of indicators, but one thing for sure is that MACD Daily on BTC is a fairly reliable monitor for BTC trend reversals on macro level. And accordingly, the bear movement is in fact far from its end. What one may expect at best for the next some weeks (until MACD and Signal lines cross on the southern side of the MACD chart) is a sideways market.

Spotting a Bull Flag Pattern in Wave Coin (But Stay Cautious)Wave Coin is currently showing a promising bull flag pattern on the chart. This pattern typically indicates a continuation of the previous uptrend, suggesting potential for further gains. However, it's important to stay cautious as the price could also fall if the pattern fails to hold. The consolidation phase within the flag gives a chance to enter the market before the next breakout, but be mindful of key support and resistance levels. Always use stop-loss orders to protect your position and trade wisely!"

Bullish Triangle Breakout Pattern in SUNUSDT NOW Description:
SUN Coin has recently displayed a bullish triangle breakout pattern, signaling a potential upward trend. This pattern typically indicates a continuation of the prior uptrend, providing a strong buying opportunity for traders.
The key features of this breakout include:
Consolidation Phase: SUN Coin experienced a period of price consolidation, forming a triangle pattern. This phase is characterized by a series of higher lows and lower highs, converging towards a point of breakout.
Volume Increase: As the price approaches the apex of the triangle, trading volume often increases, suggesting heightened trader interest and momentum.
Breakout Confirmation: The breakout above the upper trendline of the triangle is a bullish signal. For confirmation, look for a closing price above this trendline accompanied by increased volume.
Target Price: The target price for this breakout can be estimated by measuring the height of the triangle at its widest point and projecting this distance upwards from the breakout point.
Support and Resistance Levels: Post-breakout, it's crucial to monitor key support and resistance levels. The former resistance line (upper trendline of the triangle) now acts as a support level, while previous highs may serve as resistance.
Trading Strategy:
Entry Point: Enter a long position at or just above the breakout level.
Stop Loss: Set a stop loss slightly below the breakout point or below the former support line to manage risk.
Take Profit: Consider taking profit at the projected target price or in stages as the price approaches significant resistance levels.
Stay updated with the market sentiment and watch for any signs of reversal or false breakouts

4H Head and Shouders FormationThe closing price of the second shoulder is observed to be lower than the first shoulder, indicating a potential reversal pattern. Furthermore, the price action is positioned below the 200-day Moving Average (EMA), reinforcing the bearish sentiment. Additionally, I noticed seven candles on the first shoulder and head. PHEMEX:BTCUSDT.P May 7, 2024, 2:25pm

Premium Crypto idea $$$$ #ENSUSDTENSUSDT is facing resistance, indicating a potential selling opportunity for day traders. The price has failed to break above this level, suggesting a reversal may be imminent. The overbought conditions on the RSI further support the idea of a short-term price decline. Day traders may consider selling ENSUSDT to profit from this potential downside movement. It is important to set appropriate stop-loss levels to manage risk effectively.
Entry: 14.786
SL: 14.885
Target 1: 14.426
Like share and comment for more
Click the follow button
#crypto #daytrading #signal #analysis #moneymanagement
Trade God out

Premium Crypto Idea DARUSDT we have fun on the weekends tooHello traders happy trading, it never stops even on the weekend
Entry: .1471
SL: .1604
Target: N/A lets see how far we go
premium idea for you to enjoy
Like share and comment, TradeGod out thanks
#DARUSDT
#Crypto
#daytading
#signal
#BTCUSDT

PERP has formed a Bullish pattern after the breakoutPERP has formed a Bullish pattern after the breakout
🔵Entry Zone 1.54056 - 1.58932
🔴SL 1.4136
🟢TP1 1.7128
🟢TP2 1.9900
🟢TP3 2.4700
Risk Warning
Trading Forex, CFDs, Crypto, Futures, and Stocks involve a risk of loss. Please consider carefully if such trading is appropriate for you. Past performance is not indicative of future results.
If you liked our ideas, please support us with your likes 👍 and comments.
