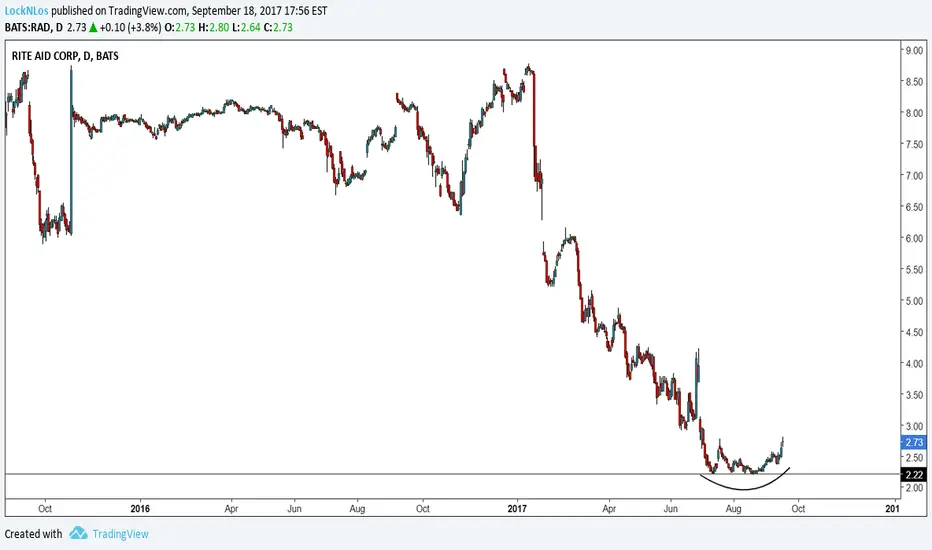
RAD wedge pattern points upwardRAD pharmaceuticals has been in a downtrend and indicated by the reversal in trend plus my analysis, shows a wedge form showing the bulls are ready to step in.
Pharmaceuticals

INSY Target $23 FDA Cannabidiol Fast trackFDA Grants INSYS Therapeutics ‘Fast Track’ Designation for Cannabidiol (CBD) Oral Solution as
INSYS Therapeutics, Inc. (NASDAQ:INSY), announced today that the U.S. Food and Drug Administration (FDA) has granted Fast Track designation to the company’s cannabidiol (CBD) oral solution for the treatment of Prader-Willi syndrome, a rare and complex genetic disorder characterized by insatiable appetite in children that often leads to obesity and type 2 diabetes.
“FDA’s Fast Track designation will enable an expedited regulatory review process for our proprietary formulation of CBD in the treatment of pediatric patients with Prader-Willi syndrome, a debilitating condition which currently does not have any approved products available,” said Steve Sherman, senior vice president of regulatory affairs for INSYS Therapeutics. “We plan to start the clinical development program for this promising therapy in late first quarter of 2018.”
The most common known genetic cause of life-threatening obesity in children, Prader-Willi syndrome has a prevalence of approximately 1 in 15,000, according to the Prader-Willi Syndrome Association, occurring in males and females equally and in all races.
“We are very encouraged by the FDA’s decision to put CBD for Prader-Willi on the Fast Track and believe it is good news for these young patients, their families and clinicians,” said Saeed Motahari, president and chief executive officer of INSYS Therapeutics. “This special regulatory designation represents a significant milestone in the company’s R&D program, which is focused on developing and delivering safe, effective and novel treatment options using cannabinoids and novel drug delivery technology for unmet medical needs.”
About INSYS
INSYS Therapeutics is a specialty pharmaceutical company that develops and commercializes innovative drugs and novel drug delivery systems of therapeutic molecules that improve patients’ quality of life. Using proprietary spray technology and capabilities to develop pharmaceutical cannabinoids, INSYS is developing a pipeline of products intended to address unmet medical needs and the clinical shortcomings of existing commercial products.
Forward-Looking Statements
This news release contains forward-looking statements including regarding (i) our belief that FDA’s Fast Track designation will enable an expedited regulatory review process for our proprietary formulation of CBD in the treatment of pediatric patients with Prader-Willi syndrome, (ii) our belief that Prader-Willi syndrome currently does not have any approved products available and that our proprietary CBD formulation has potential to be a viable treatment option and (iii) our plan to start the clinical development program for this promising therapy in late first quarter of 2018. These forward-looking statements are based on management’s expectations and assumptions as of the date of this news release; actual results may differ materially from those in these forward-looking statements as a result of various factors, many of which are beyond our control. These factors include, but are not limited to, risk factors described in our filings with the United States Securities and Exchange Commission, including those factors discussed under the caption “Risk Factors” in our Annual Report on Form 10-K for the year ended Dec. 31, 2016 and subsequent updates that may occur in our Quarterly Reports on Form 10-Q. Forward-looking statements speak only as of the date of this news release, and we undertake no obligation to publicly update or revise these statements, except as may be required by law.

Mylan Wedge BreakoutNASDAQ:MYL is breaking out of a wedge that it has been consolidating in for nearly four years. This wedge appears to be a retest of the breakout from resistance that occurred in 2013, which was followed by a large rally during the "biotech bubble". I expect the wedge breakout to take us back to the all-time highs, at a minimum, and potentially to $100/share.
Disclosure: I am long NASDAQ:MYL

VRX toward the first TPVRX yesterday has reached the first TP around 24.3/24.5 according to what happened some years ago. I expect some resistence here. if such hurdle will be step over, I expect another resistence at 26/27. This because some investors will take profit from the rally began in November: From 11 dollars to 19 (the neckline) 8 dollars of difference. 8+19= 27. Third TP is around 32/33 dollars. In the meantime Valeant will present at JP Morgan healthcare conference on the 10 jan, whilst fresch data on bussiness activity will be rolled out on 22 of febraury.

Finding the upcoming support zone and the right time to sell/buyAcadia Pharmaceuticals has shown a downward swing during the past 2 business days or so. Before that it was on a very big run, which on my opinion was due to the high demand and the low buy/sell price. It will soon find support around the 32.67 up to the 38 zone (see the purple channel) based on the past downswing which i just stated. In the very near future it will also go on an run as big as the last one or maybe a little slower, but it will fall out again.
In my opinion it would be better to buy soon, sell some when it breaks the channel and then sell more when it reaches the climax of the channel.

Teva strong resistence at 19.33, yet not a buyDespite the recent company's efforts to reduce its debit, from a technical point of view, I would be neutral with Teva until we will see a cross-over between slow 200d and fast 50d moving average on a daily chart pattern. For those who are aggressives MACD is still positive but keep in mind the resistence at 19.33 first and 20 after. Exhaustion gap betweeen 16 and 18 has been filled. Personally I see such movement as a prize for what the new CEO has done to reduce the impact of debit in short and mid term. Still 2018 will be critical to conferm that what has been undertaken is going toward in the right direction.

possible new uptrend line for ValeantYesterday I bet on a new trend line but I had needed a confirmation about the minimum which was given today, this is why I decided to post my idea. If confirmed during next sessions the new uptrend will accelerate.

Valeant: what's nextApologies for the chart but I don't have the premium version. I tried to figure out the next levels:
Here the summary:
1. 25.80
2. 33.20
3. 38.50

VRX imminent attack to 18 dollarsVRX after the correction largly expected, yesterday as demostrated a strong bullish counterattack closing the session slightly less than the short entry recovering mostly 100%. The pattern therefore shows clearly the uptrend line in place. Investors are considering a Q4 better than Q3 looking for new confirmation about debit reduction, so I expect price will move up, breaking down the barrier set at 18 dollars. In case of confirmation this would be a strong signal as Valeant is gaining back attention and potential turn around. Still there is a long way to go through, but what is important right now to highlight is that the trend has been confirmed.

Careful with VRX possible retracementWe reached 17.70 dollars and than a fast pullback as it was for the day before. Important resistence near 18 with possible retracement on the ascendent trendline first and the second dotted trendline after. Personally I sold it at 17 in order to see what it will look like next weeks. RSI overbought, MACD still positive.

Is VRX recharging for a new rally?We have seen in the last few days a dynamic resistance that characterized the pull back of the price from a threshold range between 16.95-16.75. Today the lowest minimum price touched 16.00 dollars (around -2% compare to opening). Violent and prompt reaction with high volatility intraday had set the price at 16.45 +0.3%. 16$ was the point where the ascendant trend line supported the price. Will we see an attack to 17 dollars next days?

DMPI, DelMAR Pharma Break Out and Short Squeeze DMPI has broken resistance on positive interim results of its clinical cancer drug, VAL-083. Analyst have a price target of $12. Bullish price action on trend analysis, chart patterns, and shorts covering.


Teva Pharmaceutical industries. up or down? This is my first wave chart, so be gentle. :)
i have 2 scenario. One is that wave 5 have ended and we are ready to a correctional wave of A,B,C.
The other is that they will present bad revenue. And the price will continue the down trend, and stop at the support line at 6,49
where the 5th wave could end and start a correction of A,B,C.
Fundamental:
Teva have a great product portfolio, but have lost 64.46% decline year to date. and a 68.83% decline from 30/10/2016 to 30/10/2017
The decline have something to do with there stock pilling on debt that run along the loss in product sales.
The U.S. generics industry is facing significant competitive and pricing pressure, which have been affecting the company’s generic revenues. An increase in FDA generic drug approvals and ongoing customer consolidation are resulting in additional competitive pressure in the industry. earlier this month, in a major blow to Teva, Mylan MYL launched its generic version of the 40 mg formulation, much earlier than expected. Mylan also launched a second generic version of Copaxone 20 mg formulation (once-daily).
Though these generic launches will not hurt Teva’s third-quarter sales and profits, Teva estimates that it will have a negative impact of at least 25 cents per share on fourth-quarter earnings.
Teva Pharmaceutical industries have a P/E Ratio (TTM)=-2,22
And a EPS(TTM)=-6,11
This means that the company is losing money.
besides that, investors now pay 2,22 Dollars less pr earned dollar
They still have a 1,20(8,07%) Forward Dividend and Yield
this means that the company is expecting a low grow rate because of the high yield
(if the Yield is low, a company is expecting high growth expectations and are more likely to give investors reward through out a rise in the stock price)
The Beta is low at 0,72. a Beta below 1 is a less volatile stock.
My target will be at 36.49$
where my stops loss will be at 6,18$
general 1y target estimate from other investors is at 20,02$
Profile:
Teva Pharmaceutical Industries Limited develops, manufactures, markets, and distributes generic medicines and a portfolio of specialty medicines worldwide. It operates through two segments, Generic Medicines and Specialty Medicines. The Generic Medicines segment offers sterile products, hormones, narcotics, high-potency drugs, and cytotoxic substances in various dosage forms, including tablets, capsules, injectables, inhalants, liquids, ointments, and creams. This segment also develops, manufactures, and sells active pharmaceutical ingredients. The Specialty Medicines segment provides branded specialty medicines for use in central nervous system and respiratory indications, as well as the womens health, oncology, and other specialty businesses. Its products in the central nervous system area comprise Copaxone for multiple sclerosis; Azilect for the treatment of Parkinsons disease; and Nuvigil for the treatment of excessive sleepiness associated with narcolepsy and certain other disorders. This segments products in the respiratory market include ProAir, ProAir Respiclick, QVAR, Duoresp Spiromax, Qnasl, Braltus, Cinqair/Cinqaero, and Aerivio Spiromax for the treatment of asthma and chronic obstructive pulmonary disease, as well as Treanda/Bendeka, Granix, Trisenox, Lonquex, and Tevagrastim/Ratiograstim products in the oncology market. This segment also offers a portfolio of products in the womens health category, which includes ParaGard, Plan B One-Step, and OTC/Rx, as well as other products. The company has collaboration arrangements with Attenukine, Procter & Gamble Company, and Regeneron Pharmaceuticals, Inc.
(source: finance.yahoo.com)
Good luck :)


$RADSTOCK SEEMS TO HAVE FORMED SAUCER PATTERN. PRICE HAS BEEN ON A NOSE DIVE SINCE THE START OF THE YEAR AND I HATE TO CALL TOPS/BOTTOMS BUT I LIKE THE STOCK TO RALLY SOON. TIGHT STOPS @ $2.05
Portfolio Position: Teva Pharmaceuticals $TEVATeva Pharmaceuticals $TEVA has shed over 50% of its value following its $6.1B impairment charge and 75% dividend slash in its latest quarterly report.
Pros:
- The company continues to expect double digit sales growth from its recent Actavis acquisition from Allergan $AGN.
- Teva expects over 1,500 new drugs to launch in 2017, with over 900 drugs still pending approvals.
- The company is divesting its non-core organic revenue drivers, expected to bring in over $5B in 2017 and boost margins.
- Aggressive cost cutting, saving over $1.6B annually is expected to boost Net Income and Margins.
Risks:
- Teva's blockbuster drug Copaxone is under competitive pressure, losing market share in 2017 & is expected to continue in 2018.
- Sentiment: The company still trades in a highly retail environment being effected by mass hysteria, boding bad for share price.
Targets:
I initiate TEVA with a $30 PT for the next 12 months, throughout 2018.
For the full review: seekingalpha.com

ADXS LONG POSSIBILITIESIF ADXS BREAKS ABOVE RESISTANCE ON STRONG VOLUME- GO LONG
IF IT HITS BOTTOM SUPPORT AND BOUNCES ON STRONG VOLUME- GO LONG

Short term target zone reached - Resistance aheadTo continue higher PRGO will have to break above the top of the channel and the 200 MA line.
Bears can look for bearish reversal signs inside this resistance zone.

$TNTY breaches lower bolliesThe candles breached the lower bollie yesterday by more than 50% signaling a 85% likelyhood for a correction with the MACD and STO supporting my idea.

TEVA H&S formation - price preparing to turnThe $TEVA chart just keeps getting better and better....
Quarterly chart is rejecting last 2 major lows with a pinbar with stoch RSI overbought
Ideally we bounce here to retest the fibs and form a right shoulder before complete capitulation.
If the H&S formation is confirmed $TEVA should head down to levels we haven't seen since the 90's ($10 and below)

mid term long on TRVNentry 4.00, exit 5.00
looks oversold, the study results were luke warm, but positive.

