PHA Bounce from Historical Support ZonePHA is showing signs of a potential bullish reversal after bouncing off a long-standing support zone. Price has consistently respected this support level since mid-2022, creating a strong base. Now, we’re seeing bullish momentum building as the weekly candle breaks above the 50-week EMA, which had acted as dynamic resistance in the past.
A break above the recent swing high could trigger a larger move toward the $0.25–$0.35 resistance area. As long as the support zone remains intact, the structure remains bullish.
Cheers
Hexa
PHAUSDT

PHAUSDT 1W AnalysisPHA ~ 1W Analysis
#PHA Buy back on retest of this support block with short term target of at least 20%+ from this support.
PHAUSDT Forming a Bullish Flag PatternPHAUSDT is currently displaying a classic bullish flag pattern on the daily chart, which is often considered a strong continuation signal in technical analysis. After a sharp upward move, the price has entered a consolidation phase within a descending channel—forming the "flag" portion of the pattern. With good volume backing the previous rally, this consolidation suggests that the bulls are simply taking a breather before the next leg higher. A breakout above the upper boundary of the flag could potentially trigger a 40% to 50% gain in the coming sessions.
From a market sentiment standpoint, PHA is gaining increased traction among crypto investors due to its underlying fundamentals and the growing use case of privacy-preserving technologies. As part of the Phala Network, which focuses on decentralized cloud computing with built-in privacy, the token has positioned itself well in the Web3 and privacy niche. This unique narrative is attracting more attention, and it reflects in the technical setup that's ripe for a breakout.
Traders should closely monitor the breakout zone near the flag's resistance. If PHAUSDT pushes through with strong volume confirmation, it could mark the beginning of a new bullish wave. Price action, along with volume spikes, RSI crossover, and MACD bullish alignment, further support this scenario. The potential risk-to-reward ratio favors strategic long entries for both swing traders and mid-term investors.
This pattern is a compelling opportunity for those looking to capitalize on breakout moves in trending altcoins. If market conditions remain favorable, PHAUSDT could easily exceed expectations, offering a solid gain for those positioned early.
✅ Show your support by hitting the like button and
✅ Leaving a comment below! (What is You opinion about this Coin)
Your feedback and engagement keep me inspired to share more insightful market analysis with you!

PHAUSDT 1D AnalysisPHA ~ 1D Analysis
#PHA Buy when re -testing this support block with a short -term target of at least 10%+ from here.

PHA USDTHere is a good and simple setup for PHA. Prioritize preserve your capital and avoid over expectation. It's been awhile since the last I posted. Many invalid calls in my profile. Crypto market moved unexpected to the downside and I was unable to anticipate. All market got liquidated. Cheers to those who still in the game.

Phala Network 2,400% Profits Potential Target & 2025 Bull MarketThe steepest decline ever for Phala Network just happened between late December '24 and April 2025. This was a really strong correction and broke two long-term support levels, August 2024 and August 2023, just to recover the next week.
This drop activated the market's All-Time Low. A price that was hit once only in October 2022. This same support level was activated only briefly with a higher low. The low back then happened at 0.0700 and the higher low this month at 0.0753. Buyers were ready almost at the lowest possible point. A long-term double bottom.
The last time this low price was hit the reaction was a super strong rise. PHAUSDT rose more than 600% the same week that it produced its All-Time Low. The high produced was only challenged again in December 2024, it broke by 10 cents. Back then the peak happened at 0.5000 (October 2022), in December 2024 the peak happened at 0.6000. This small difference makes a huge difference for the upcoming bull market bull-run, it is good news.
Another positive signal for this pair comes from the session close. Back in October 2022, the session that hit 0.5000 on a wick ended up closing at 0.2148. This time, the December 2024 peak at 0.6000 ended up with a close at 0.4919, a huge difference, more than 100%. This is a signal of strength and good news for the upcoming bull market.
The bulls were testing the waters and removing a very strong resistance point. This was a success. The market went through a full flush and is ready to grow again. Phala Network can hit a new All-Time High this year based on these simple signals, so be prepared.
An entry now and a long-term hold can produce a nice and easy 300% in the coming weeks or months. By late 2025, profits can amount to 1,350% or even 2,400%, all these targets can be seen mapped on the chart.
This is another good pair. The chart looks strong and the action went through a full reset. Bottom prices are present today. A huge discount. The best possible timing. This is your chance.
Thank you for reading.
Namaste.

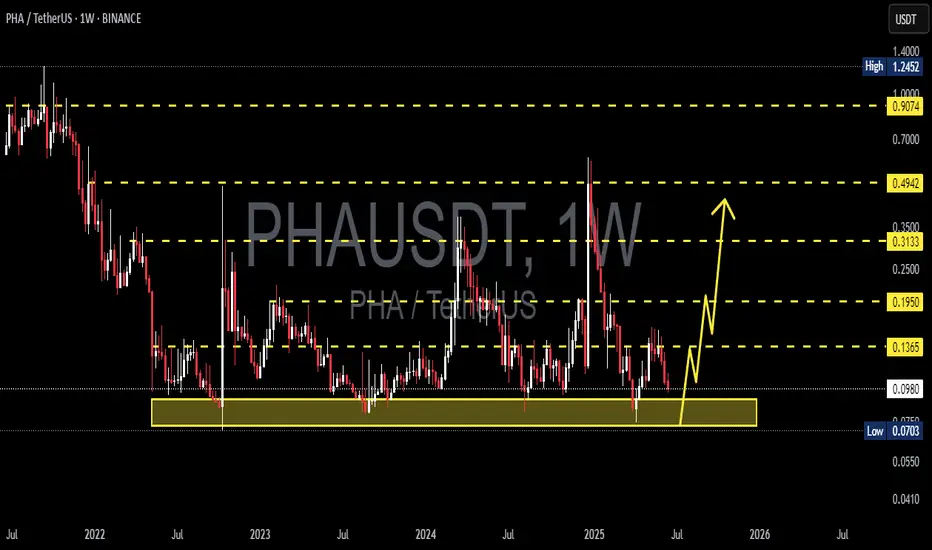
PHAUSDT 1WPHA ~ 1W Analysis
#PHA Buy back gradually from here with a short -term target of at least 20%+.
This is the lowest support for now.

PHAUSDT 1WPHA ~ 1W Analysis
#PHA Buy gradually from here if you still have a Conviction on this Coin. with a short -term target of at least 20%+.

LTCUSDT UPDATELTCUSDT is a cryptocurrency trading at $118.43. Its target price is $150.00, indicating a potential 25%+ gain. The pattern is a Bullish Pennant, a continuation pattern signaling a potential breakout. This pattern suggests a brief consolidation before a strong upward move. The Bullish Pennant is a positive signal, indicating a potential price surge. Investors are optimistic about LTCUSDT's future performance. The current price may be a buying opportunity. Reaching the target price would result in significant returns. The Bullish Pennant pattern typically leads to a strong upward move. LTCUSDT is poised for a potential breakout and substantial gains.

PHAUSDT (PhalaNetwork) Updated till 16-01-25PHAUSDT (PhalaNetwork) Daily timeframe range. Finally its trying for a retrace back a clean close above 0.4353 can run it back. not a fake close keep in mind. failed close will lead it back to 0.2884 or lower. 0.2884 needs to hold for the push.

#PHA/USDT #PHA
The price is moving in a descending channel on the 1-hour frame and is expected to continue upwards
We have a trend to stabilize above the moving average 100 again
We have a descending trend on the RSI indicator that supports the rise by breaking it upwards
We have a support area at the lower limit of the channel at a price of 0.2860
Entry price 0.3201
First target 0.3634
Second target 0.4000
Third target 0.4400

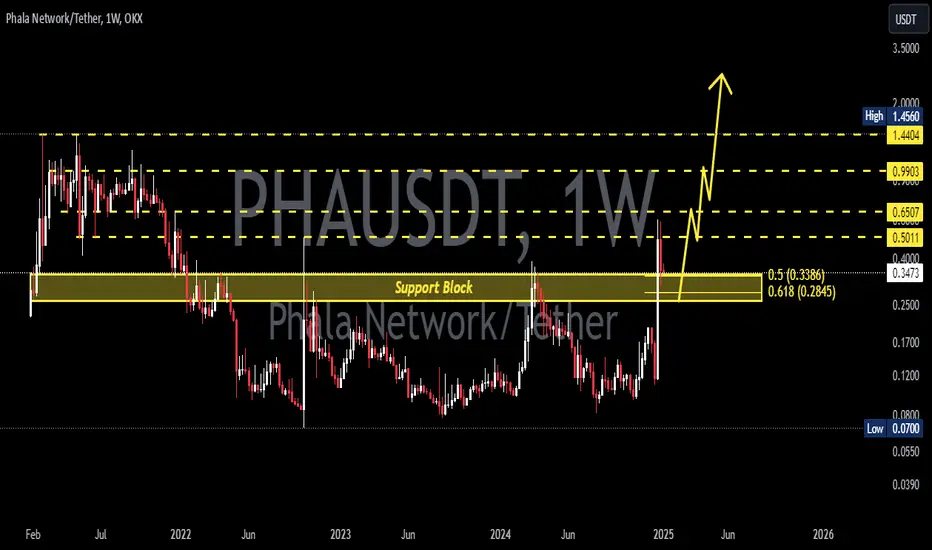
PHAUSDT 1WPHA Update ~ 1W
#PHA So far it still maintains its bullish structure. This is the support block of the golden ratio,. Buy in stages. with a minimum target of 20%+
PHAUSDT Nearing Breakout Zone!PHAUSDT technical analysis update
PHAUSDT has been ranging for the last 1100 days and is now moving towards the range resistance line for a breakout. A strong bullish move can be expected once a breakout is confirmed on the daily chart. An increase in volume near the resistance is also observed.
Stop loss : $0.18
Take Profit 1: $0.41
Take Profit 2: $0.61
Take Profit 3: $1.23

#PHA ( SPOT_TRADES)BINANCE:PHAUSDT
Entry (.132- .152)
SL 4H close below .130
T1 .162
T2 .174
T3 .187
T4 .207

PHAUSDT (PhalaNetwork) Updated till 24-12-24PHAUSDT (PhalaNetwork) Daily timeframe range. we can see a nice pump today. retraced above 0.1835 all it needs a confirm close to get to 0.2347. it got volume but retail interest needs to keep up. recent support at 0.1384.

PHA Retrace Opportunity to 0.12XX to 0.13XX before taking OFF PHA Retrace Opportunity to 0.12XX to 0.13XX before taking OFF
PHA is about to break out but it may be rejected to test the 0.12XX Area

PHAUSDTPHA ~ 1W
#PHA So far have continued to maintain this support block. If you still have Conviction on this coin,. This support block would be a very good buy for now. With a minimum target 20%++

PHAUSDTPHA ~ 1W
#PHA Maybe if you are interested in this coin,. you need to pay attention to this key Support,. Last time the price bounced off this key support. at least for a minimum 20%++ profit.

PHAUSDT 6 Day timeframe TargetBINANCE:PHAUSDT
PHA USDT , I am seeing a falling wedge on a 6 Day timeframe that can take phala to the next level.
also it touches the bottom.
A very good project AI and DEPIN.
not a financial advise.DYOR

Phala Network (PHA) completed a setup for upto 20% pumpHi dear friends, hope you are well and welcome to the new update on Phala Network (PHA) coin.
Recently we caught almost 20% pump of PHA as below:
Now on a 4-hr time frame, PHA has formed a bullish BAT move for the next pump.
Note: Above idea is for educational purpose only. It is advised to diversify and strictly follow the stop loss, and don't get stuck with trade.

#PHA/USDT#PHA
The price is moving in a bearish channel pattern on the 4-hour frame, and it adheres to it well, and it is expected to break to the upside
The price rebounded well from the lower border of the channel at the green support level 0.1650, which is a strong level.
We have a tendency to stabilize above the Moving Average 100
We have oversold resistance on the RSI indicator to support the rise, with a downtrend about to break higher
Entry price is 0.1900
The first target is 0.2330
The second target is 0.2600
The third goal is 0.2884

PHA/USDT Showing Positive Signs to Breakout From a Falling Wedge💎Paradisers, #PHA is compressed between falling wedge trendlines and gaining momentum for a breakout.
💎Once it breaks out, we'll wait for a retest for confirmation before planning our trade. The retest phase often follows a breakout and provides an excellent opportunity to validate bullish momentum. If #PhalaNetwork holds support at $0.166 and continues its upward climb, the next target lies in the resistance zone we've projected.
💎However, if #PHAUSDT struggles to maintain support and dips back into the wedge, it will indicate a weakening bullish trend. In this scenario, the price may drop further to the next significant support level, around $0.146.
💎Historically, PSE:PHA has shown resilience by rebounding decisively from this level. If this pattern holds, a strong bounce could occur. However, a decisive candle close below this support will challenge the bullish outlook and signal a shift toward a more bearish trend.
MyCryptoParadise
iFeel the success

#PHA/USDT#PHA
The price is moving in a bearish channel pattern on a 12-hour frame,
which it adheres to perfectly.
We have stability above the moving average of 100.
We have a downtrend on the RSI indicator that supports the rise and is about to break higher
Entry price is 0.2444
The first target is 0.2724
The second target is 0.3228
The third target is 0.3650
