PHB Looks Bullish (1D)It appears that wave E has ended after a long consolidation and the formation of a double bottom. A key trigger line has been broken, and the price has reclaimed the flip zone (marked in green).
As long as the green zone holds, the price can move toward the targets and the red box.
The targets are marked on the chart.
A daily candle closing below the invalidation level will invalidate this analysis.
For risk management, please don't forget stop loss and capital management
Comment if you have any questions
Thank You
PHBUSD
PHBUSDT Bounces from the Golden Pocket?🧠 Market Context & General Analysis
Phoenix (PHB) is currently at a critical juncture in its market structure. After a prolonged downtrend from its 2024 highs, price has now reacted strongly off a key Fibonacci Golden Pocket retracement zone (0.5–0.618), which also aligns with a historically respected demand area.
This level is not just a technical formality – it’s a zone where smart money typically enters, and historically it has provided reliable bullish reversals.
---
📍 Key Zones to Watch
🟨 Demand / Accumulation Zone:
0.549 – 0.608 → Fibonacci 0.5–0.618 + Historical support
⤷ Has been retested and shows early signs of a bullish reaction.
📈 Layered Resistance Zones (Fibonacci Targets):
0.834 → Minor resistance + potential double bottom neckline
1.028 → Previous structural resistance
1.200 → Psychological round level
1.458 → Key Fibonacci extension
1.945 – 2.735 – 3.648 → Mid/long-term Fibonacci targets
4.149 → All-Time High (ATH) on this chart
🔻 Major Support if Breakdown Occurs:
0.326 → Historical bottom / last line of defense
---
🧩 Pattern Formation: What’s Emerging on the Chart?
🔄 Potential Double Bottom:
Price structure is showing signs of a potential reversal formation in the form of a double bottom near the 0.55–0.61 zone. A confirmed breakout above the neckline at 0.834 would validate this bullish setup.
📉 Broken Downtrend Channel?:
PHB was previously trading in a downtrend channel. The current move suggests a possible breakout and the beginning of a trend shift or accumulation phase.
---
✅ Bullish Scenario: The Rise of the Phoenix
If the price holds above 0.608 and confirms with a strong breakout above 0.834, a bullish trend reversal could follow.
🚀 Short-term targets: 0.834 → 1.028
🔥 Mid-term targets: 1.200 → 1.458 → 1.945
🌕 Long-term potential: 2.735 – 3.648 – 4.149
Validation Key: Break above 0.834 with strong volume
Bullish confirmation candle: Bullish engulfing / Marubozu on 4D or Daily
---
⚠️ Bearish Scenario: Breakdown Threat Looms
If the price fails to hold the 0.549 support level, we could see a continuation of the downtrend, potentially targeting:
💀 First stop: 0.45 – 0.40 zone
🧊 Extreme case: Drop toward 0.326 (historical low)
Breakdown Confirmation:
Daily or 4D close below 0.549
Followed by selling volume and no quick recovery
---
🎯 Potential Trading Strategies (Not Financial Advice):
🟢 Bullish Swing Entry: Buy zone at 0.55–0.61
⤷ Targets: 0.834 – 1.028
⤷ Stop-loss: Below 0.52 (close basis)
🔴 Breakout Trade: Enter on breakout above 0.834 with volume
⤷ Targets: 1.200 – 1.945
⤷ Stop-loss: Below 0.80
🔵 Bearish Play / Re-entry: Short if break below 0.549
⤷ Targets: 0.40 – 0.326
⤷ Stop-loss: Above 0.60
---
🧲 Final Thoughts
PHBUSDT is in a make-or-break zone, sitting atop the Golden Pocket and showing early bullish momentum. If buyers step in and maintain the momentum, we could be witnessing the early stages of a significant market reversal.
However, failure to hold the key support at 0.549 would likely shift the sentiment back into bearish territory. Volume and confirmation candles will be the deciding factor for the trend’s next direction.
#PHBUSDT #PhoenixCrypto #AltcoinReversal #GoldenPocket #CryptoTA
#FibonacciLevels #BullishSetup #BearishBreakdown #ChartPatterns

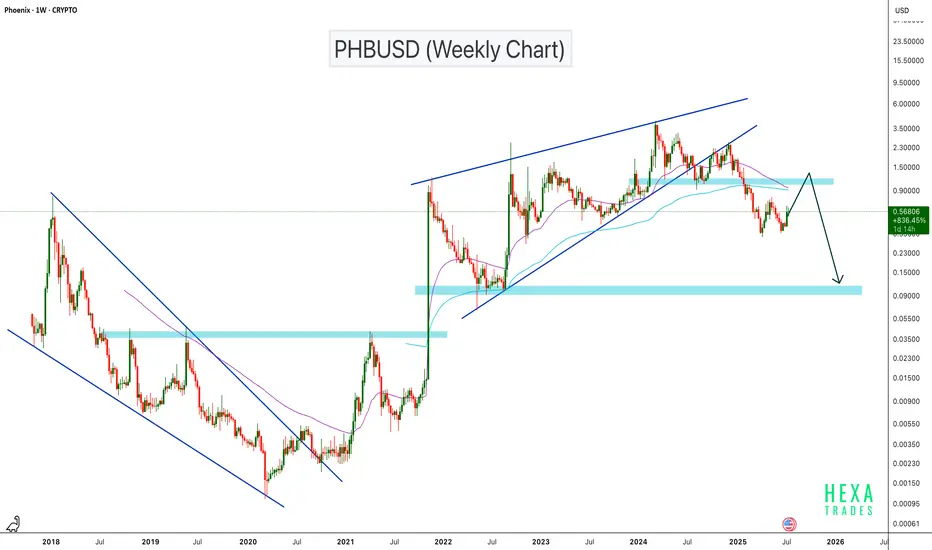
PHBUSD Breakdown: Rising Wedge Signals Bearish ContinuationPHBUSD has broken down from a rising wedge pattern on the weekly chart, signaling a potential trend reversal. The price is currently attempting a retest of the previous support zone at the $1.00–$1.20 level, which is now likely to act as resistance. If this retest fails, it could confirm a bearish continuation setup, with the next key support zone around $0.10. This level has previously acted as a major base and could serve as the next downside target
BINANCE:PHBUSDT AMEX:PHB
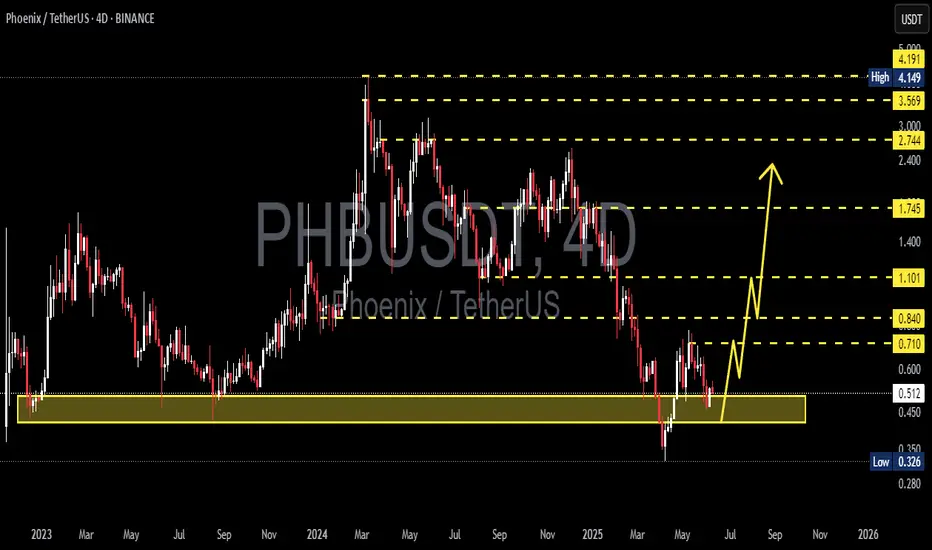
PHBUSDT 4D AnalysisPHB ~ 4D Analysis
#PHB This trade is very High risk, Buy gradually from here if you still have confidence in this coin with a short term target of at least 15%+ from here.
PHBUSDT 3D Analysis PHB ~ 3D Analysis
#PHB Buy from here if you still have confidence in this coin with a short term target of at least 15%++

#PHB/USDT#PHB
The price is moving within a descending channel on the 1-hour frame and is expected to break and continue upward.
We have a trend to stabilize above the 100 moving average once again.
We have a downtrend on the RSI indicator that supports the upward move with a breakout.
We have a support area at the lower boundary of the channel at 0.652, which acts as strong support from which the price can rebound.
Entry price: 0.666
First target: 0.692
Second target: 0.712
Third target: 0.740

PHBUSDT 6DPHB ~ 6D Analysis
#PHB Buy gradually from here with a short -term target of at least 20%+
The reason, this is the lowest support, before the price rises high.

PHBUSDT 3DPHB ~ 3D
#PHB for now continues to maintain this Support block,. Buy gradually on this support,. with a minimum target of 20%++

PHB looks bullishIt looks like the PHB is forming a triangle.
We are now in wave E of this triangle.
The green range is a suitable support where we can look for buy/long positions.
The targets are marked on the chart.
Closing a daily candle below the invalidation level will violate this analysis.
For risk management, please don't forget stop loss and capital management
When we reach the first target, save some profit and then change the stop to entry
Comment if you have any questions
Thank You

PHBUSDTPHB ~ 1W
#PHB Forming a bullish pattern on the 1W Time frame. If you have Conviction on this coin,. Wait for the resistance line of this pattern to be successfully broken through with strong volume. after that buy in stages. with a minimum target of 20%++

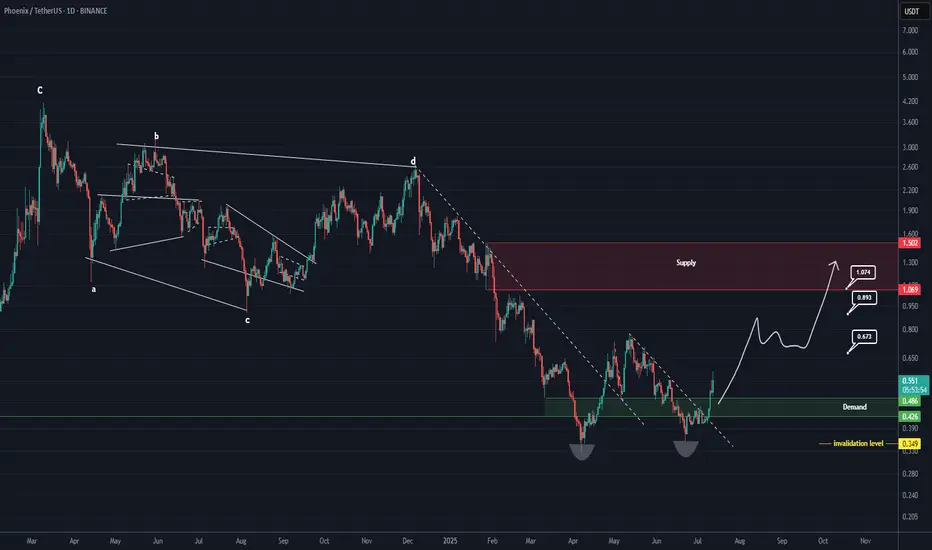
PHB Looks BullishThe PHB has finished a major correction ABC.
It is now in a bullish phase. The PHB has just reached a supply limit.
Given the good news that has been released for the AI space, the bullish movement is expected to continue.
The best place to rebuy is the green range. If PHB returns to the green range, we will look for buy/long positions.
The targets are inserted on the image.
Closing a daily candle below the invalidation level will violate the analysis.
For risk management, please don't forget stop loss and capital management
When we reach the first target, save some profit and then change the stop to entry
Comment if you have any questions
Thank You

PHB buy setupThe large structure of the PHB is a bear. But recently a bullish iCH has been formed on the chart and the price is constantly making higher Hs.
It is expected that the price will move towards the targets by meeting the demand.
The targets are clear on the chart.
Closing a 4-hour candle below the invalidation level will violate the analysis.
Note that the financial market is risky, so:
Do not enter any position without confirmation and trigger.
Do not enter a position without setting a stop.
Do not enter a position without capital management.
When we reach the first TP, save some profit and try to move the stop continuously in the direction of your profit.
If you have any comments please post them, comments will help us improve our performance
Thanks

PHB looks bearishPHB appears to be involved in an ABC correction.
Now it looks like the inside of wave B and wave B looks like a triangle.
The red range of supply is the best place for a sell/short position.
The targets are clear on the chart
Closing a daily candle above the invalidation level will violate the analysis.
For risk management, please don't forget stop loss and capital management
When we reach the first target, save some profit and then change the stop to entry
Comment if you have any questions
Thank You

Phb aiming higher.A nice example of breaker block pattern.
* What i share here is not an investment advice. Please do your own research before investing in any digital asset.
* Never take my personal opinions as investment advice, you may lose all your money.

PHB ANALYSIS (1W)Before anything, pay attention to the time frame. The time frame is big and time consuming.
To buy, we need a pullback and get a trigger.
PHB appears to be in its bullish wave C. Wave C is a diametric. It is completing wave e of C.
Closing a weekly candle below the green range will violate the analysis.
For risk management, please don't forget stop loss and capital management
Comment if you have any questions
Thank You

Saucer pattern presenting potential profit of +900% through PHB#PHB/USDT #Analysis
Description
---------------------------------------------------------------
+ PHB has formed a well-defined saucer pattern and has effectively broken out from the resistance level associated with this pattern.
+ This presents an opportune moment to enter the trade. I anticipate a significant price surge following this breakout.
+ I'm initiating my entry at the current price, leveraging 10x with only 0.25% of the capital allocated to this trade.
---------------------------------------------------------------
VectorAlgo Trade Details
------------------------------
Entry Price: 1.8667
Stop Loss: 1.4259
------------------------------
Target 1: 2.1153
Target 2: 2.4014
Target 3: 2.8614
Target 4: 3.6370
------------------------------
Timeframe: 1D
Capital: 1-2% of trading capital
Leverage: 5-15x
---------------------------------------------------------------
Enhance, Trade, Grow
---------------------------------------------------------------
Feel free to share your thoughts and insights.
Don't forget to like and follow us for more trading ideas and discussions.
Best Regards,
VectorAlgo

#PHB/USDT#PHB
On the 4-hour frame, we have a bullish channel within which the price is trading
We have strong support that the price is committed to bouncing from
Entry price is 0.0900
The first target is 0.0944
The second goal is 0.09963
The third target is 1.0545

PHB LOOKS BEARISHBy maintaining the red range of supply, it seems that PHB can drop more.
A liquidity pool is swept above and then the Order Flow (OF) is well done.
Now we have liquidity pools in the lower limits, it is expected that the price of the lower pools will also collect.
By LSH, we mean the Long Shadow, which is a marked support on the chart.
The targets are marked on the chart. Closing a daily candle above the supply range will violate the analysis
For risk management, please don't forget stop loss and capital management
When we reach the first target, save some profit and then change the stop to entry
Comment if you have any questions
Thank You

Key Support and Resistance to WatchRight now, the price of PHB is at 1.4170 USDT, showing a steep and fast increase. The trading volume is big enough to show that this isn't a fluke—people are really buying. Looking at the Fibonacci chart, if the price starts to fall, it might find a cushion around 1.0458 USDT.
The Parabolic SAR, a tool that helps us spot the trend, is below the current price, indicating that the uptrend is still strong. The Simple Moving Average (SMA) is at 1.2410 USDT and also below the price, which agrees with this upward trend.
Bollinger Bands help us see how stable the trend is and right now, the price is touching the upper band. This can mean the market is a bit too excited and might need to cool down. The Stochastic Oscillator and the Relative Strength Index (RSI), both ways to measure if things are overheating, are very high. This often means the price might take a breather soon.
The On-Balance Volume (OBV) number is also up, showing that more people are getting in on the action. The Moving Average Convergence Divergence (MACD) is positive, which is another good sign for buyers. The Chaikin Money Flow (CMF) tells us there's more money coming into the market, and the Average True Range (ATR) says the price is moving around a lot, which isn't surprising given the rise.
The Average Directional Index (ADX) is very high, which usually means the trend is your friend and could keep going.
Most Probable Scenario
The trend looks like it could keep going up for a bit because of all the positive signs. But, because the indicators that tell us if the price is too high are ringing alarms, there's also a good chance the price might stop going up so fast and even drop a bit to take a rest.
Keep an eye on the price levels from the Fibonacci chart. If the price does start to drop, these might be spots where it could steady itself.
PHB is doing really well, but the market might be getting a bit ahead of itself. It's important to be careful—things could change quickly. If you're thinking of jumping in, make sure it fits with what you're okay with risking.
This is just a quick look at the market—it's not trading advice. Always make your own decisions.

PHB LOOKS BULLISHWe reached the red box that was the front of the f wave in the previous analysis, but this resistance was cleared.
Clearing this resistance, we revised the analysis and we think we are completing a large triangle. The leading resistance of the box will be red and the drop is canceled.
This is an update to the analysis linked in the relevant section

PHB ROADMAPIt looks like PHB is completing a descending triangle as we are now in wave D which is a diametric. Now it seems that we are in wave F of this diametric, after this wave is completed, PHB can fall from D for wave g.
From the PHB we expect the completion of drawn branches. Do not enter the position without trigger or confirmation and without setting stop loss and capital management.
This coin has a small volume, control the risk

PHB Quick 15% profit scalp (Long)Even though bitcoin is falling PHB is in AIL mode and every close and every pullback is a buy opportunity.
NFA

