Phicube
Bitcoin will continue climbingAfter consolidating for almost 3 months, Bitcoin broke the resistance formed by the narrowing of the MIMAS 17 (pink) and 72 (orange) and has thrown a strong move to the weekly resistance of the $11750 area.
Now, we can see that the price is resting above this resistance and the green lines PV72 and PV305 are aligned below the price giving nice support to it.
This is a continuation setup and aims the third green line PV1292 on the $15650 area as the first target, furthermore, it is confirmed by the fan formed by the MIMAS in ascending order.
This is one of the strongest setups of the trade-system Phicube and I consider this as an amazing opportunity for a swing trade.
If we see the price getting there and having the same behavior after breaking the $15650 region, the target becomes the all-time high, and I confess that I'm pretty excited to see this happening and what comes after!
Bitcoin, best buy scenario in the continuation of the trend:Stop for now at 8200. Waiting for stronger support between MIMA 72 and the high trend line, in the range from 9100 to 8600. Initial target would be between 11200 and 11900 after confirmation of top breach. Comments and counterpoints are very welcome. Thanks!
Bitcoin lefts the accumulation phase behindSeems that Bitcoin got enough power on the accumulation phase to release a new wave. This time, aiming to target the 11800 - 12000 region as a local target, which is a PVPC resistance and also matches the 1.618 Fibonacci projection based on the last wave.
The Santo indicator shows that the bandwidth is becoming large which means that the trend is gaining strength.
Once we can see the Bitcoin halving coming in the horizon and the technical scenario is turning positive, I'm quite bullish with what comes ahead for Bitcoin, at least upon the price perspective.
Bitcoin downtrend gaining strengthOnce the Phicube MIMAS 144 and 305 (pointed by the red arrow) started to be displayed on the chart, the probability of the downtrend continuation increased.
The Santo Indicator shows that the MIMA 34 (light blue) has enough power to hold that downtrend as well.
So, I believe that the price is going to make new lows, aiming to target the $5750 area which is a PVPC support and important level of breakeven for some miners.
That set up caught my attention because it has a close stop loss and far target, the risky x return ratio is 3+ and respect all my rules for entering a trade, so let's see how the price is going to play...
ALVOS BITCOIN GRÁFICO DIÁRIO - BITCOIN TARGETS DAILY CHARTMuitas pessoas perguntam sobre os alvos do BTC no grafico diário. Para usuários PhiCube, é bem simples. Neste exemplo, utilizo indicadores MIMACON (mima na consolidação) e MIMADUPLACOM (mima na dupla consolidação) para mostrar tanto os níveis das resistências quanto os níveis das suportes. Temos duas consolidações ativas no momento: dourada e azul marinho. Os alvos da queda são os níveis de suporte destas cores. Simples assim. Abs!!
Many people ask about BTC targets on the daily chart. For PhiCube users, it's pretty simple. In this example, I use MIMACON (mima in consolidation) and MIMADUPLACOM (mima in double consolidation) indicators to show both resistance levels and support levels. We have two active consolidations at the moment: golden and navy. The target support levels are shown below in these colors. It's that simple. Take care!!
SETUP PHICUBE - Beijo da vida e beijo da morte (consolidação) Este gráfico mostra as únicas operações permitidas na consolidação pelo trade system PhiCube.
A maneira mais popular de operar uma consolidação lateral é pela relação retorno/risco, pois preço não tem direção ou força.
Neste exemplo, o indicador PhiCube DUPLAMIMACON mostra forte suporte e resistência de dois fractais gigantes separados pelo PhiCube e formando uma banda de consolidação lateral bem larga.
Assim, quando preço reage no fundo da consolidação, o mercado entende que existe uma compra com stop pequeno e com alvo distante no topo da banda. Preço da um "BEIJO DA VIDA" no fundo da banda e começa subir.
Quando preço chegar no alvo, o mercado entende que a consolidação continua firme. Desta vez, existe uma operação parecida, mas no sentido oposto.
Preço dá um "BEIJO DA MORTE" no topo da banda e começa cair. O mercado entra na venda perto do topo, com stop pequeno logo em cima e um alvo distante no fundo da banda.
Este comportamento continua até preço quebrar a consolidação lateral.
A confiança no trade e dado pela confiabilidade do indicador DUPLAMIMACON combinada com uma distancia grande entre o topo e fundo da banda.
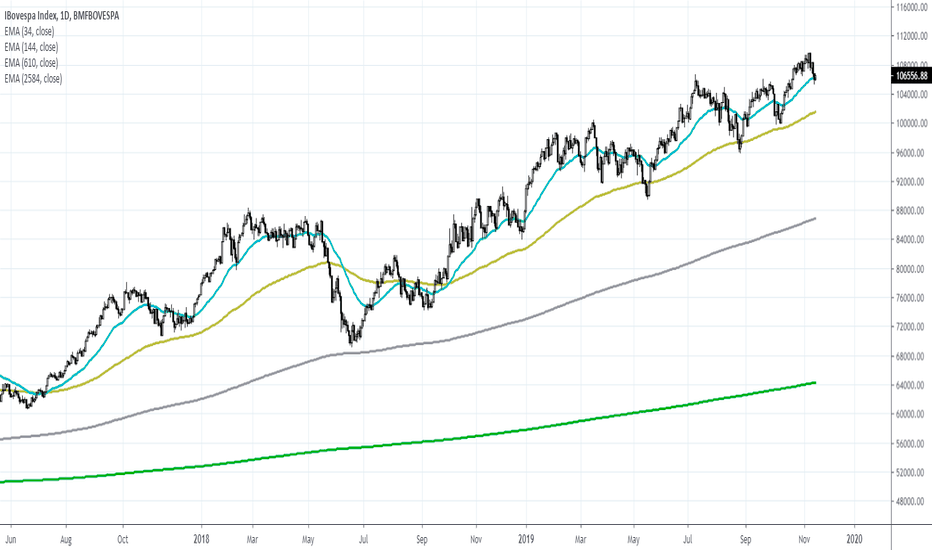
PhiCube EMA - PhiCube MMEThis PhiCube template provides a very easy and simple way to see the relative behavior of the PhiCube fractals (SMALL - EMA34, MEDIUM - EMA144, LARGE - EMA610, GIANT - EMA2584). These lines represent the decision point of each fractal to continue on its current direction or not. Price > 34EMA > 144EMA > 610EMA represents a pure uptrend. Selling is prohibited. Price < 34EMA < 144EMA < 610EMA represents a pure downtrend. Buying is prohibited. Price between EMAs represents a consolidation.
Este modelo fornece um maneira fácil e simples de observar o comportamento relativo dos fractais PhiCube (SMALL - MME34, MEDIUM - MME144, LARGE - MME610, GIANT - MME2584). Estas linhas representam o ponto de decisão de cada fractal para continuar na sua direção atual ou não. Preço > MME34 > MME144 > MME610 representa uma pura tendência de alta. É proibido vender esta condição. Preço < MME34 < MME144 < MME610 representa uma pura tendência de baixa. É proibido comprar nesta condição. Preço entre lines representa uma consolidação.


