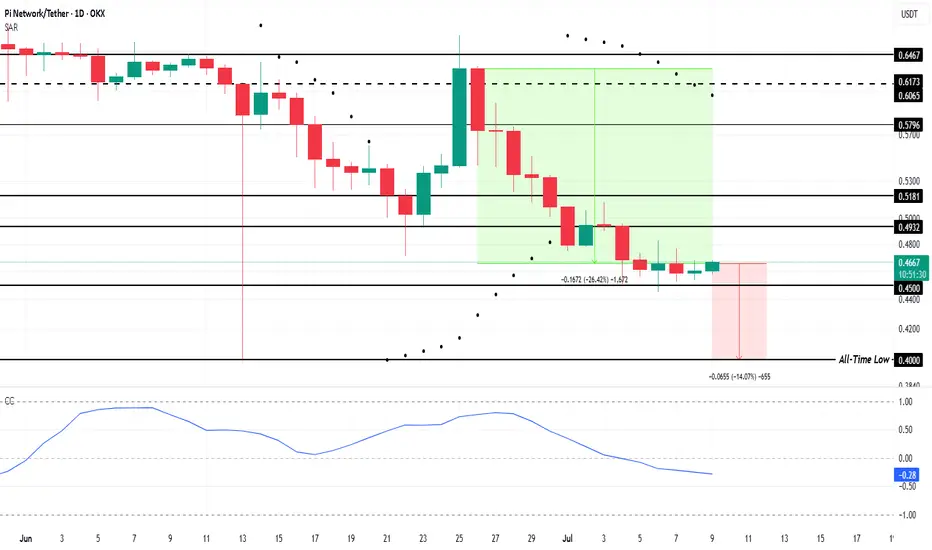
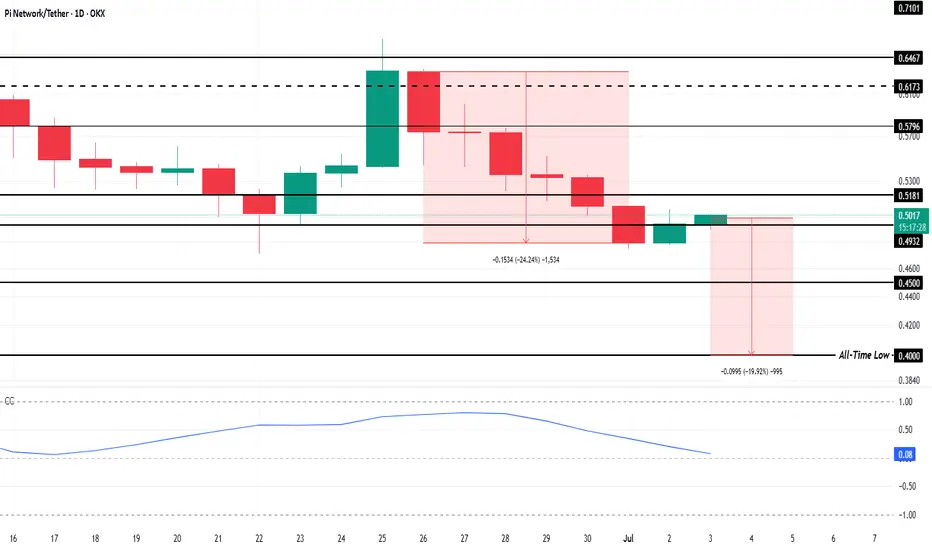
Pi Coin Decouples from Bitcoin, Pushes Price To All-Time LowOKX:PIUSDT is currently priced at $0.465, just above the critical support level of $0.450. With the altcoin hovering only 14% above its all-time low of $0.400 , it faces significant downside risk.
This price range puts Pi Coin in a precarious position, as a break below $0.450 could trigger a further decline. In the past two weeks, OKX:PIUSDT has already suffered a 26.4% drop , highlighting its ongoing struggle to regain momentum.
OKX:PIUSDT has experienced a dramatic shift in its correlation with BINANCE:BTCUSDT , now sitting at a negative 0.27 . This negative correlation means that Pi Coin is moving in the opposite direction to Bitcoin. In simpler terms, as Bitcoin rises, OKX:PIUSDT continues to struggle.
The negative correlation with Bitcoin suggests that Pi Coin will not capitalize on the positive trends seen in the wider cryptocurrency market. Instead, OKX:PIUSDT faces the risk of further decline.
Given these indicators, it seems likely that OKX:PIUSDT will fall to its all-time low of $0.400 . The fear of further losses is likely to prompt additional selling, which could accelerate the price decline. With the market sentiment weighed down by Pi Coin’s disconnection from Bitcoin, the path to recovery looks increasingly challenging.
However, there is still hope for OKX:PIUSDT if investors show restraint. If Pi Coin manages to hold the $0.450 support level, it could bounce back. A move past the $0.493 resistance level would be a positive sign , potentially pushing the price to $0.518. Such a recovery would invalidate the bearish thesis and offer a fresh outlook for the altcoin.
Picoin
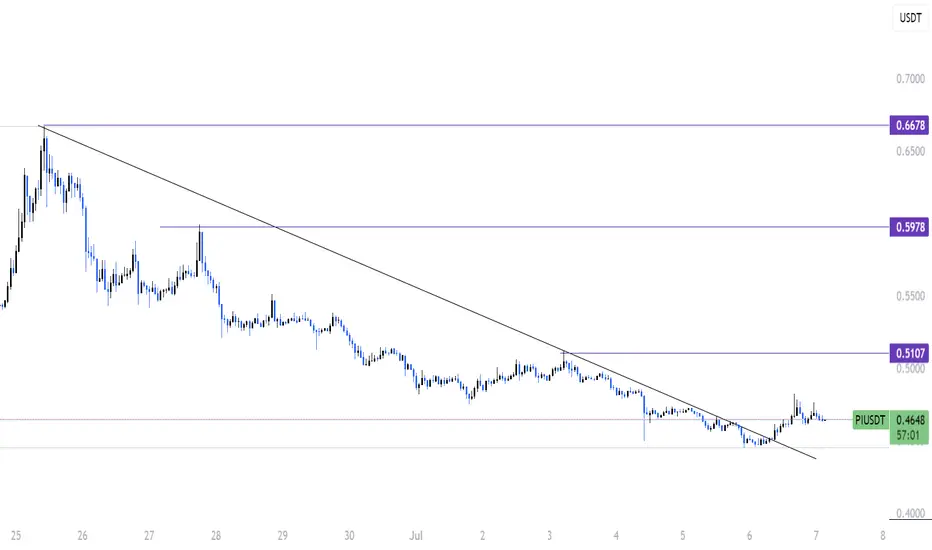
PI breakout from wedge and Trendline !!🚨 PI Breakout Update 🚨
Hey traders, hope you're all doing great!
Looks like PI just broke out of a strong trendline, and things are getting interesting.
We’ve seen solid support holding for a while, and now bulls are starting to wake up.
This move could be the start of something big if momentum continues.
Still early, but signs are pointing towards a possible bullish leg up.
Watch for a clean retest of the trendline — that could be your confirmation.
Volume is building nicely, and price action is starting to shift.
If you're tracking PI like I am, this is one to keep an eye on.
🔔 Follow for more updates and let's catch this move together!
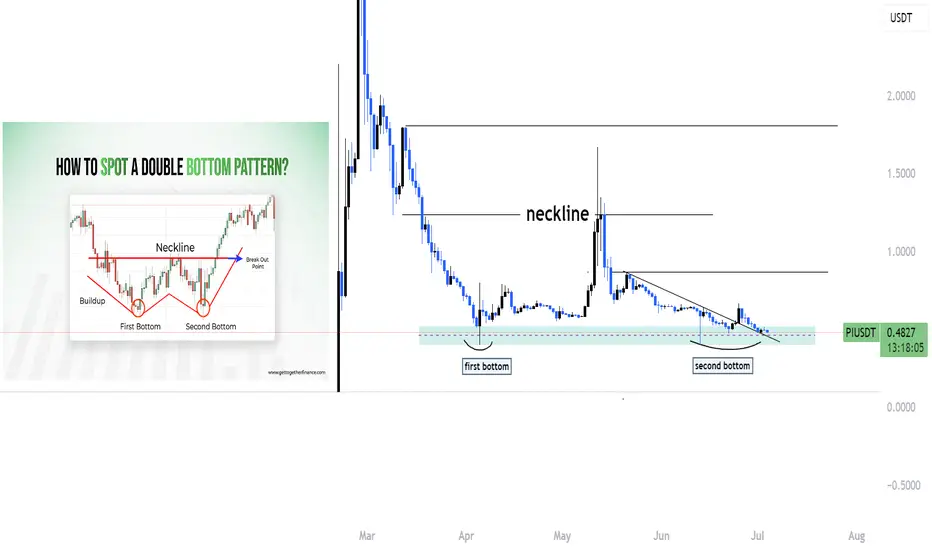
Piusdt making double bottom ??Hello traders, I hope you're all doing well!
Currently, we're seeing an interesting setup on PI that could lead to a potential bullish move. Let's break it down:
🔹 Double Bottom Formation
PI appears to be forming a double bottom on the higher time frame — a classic bullish reversal pattern. This indicates that the market has tested a key support level twice and failed to break lower, which often suggests that selling pressure is weakening.
🔹 Trendline Breakout
In addition to the double bottom, we’ve also broken out of a descending trendline that has been acting as dynamic resistance for some time. A clean breakout with volume often signals a shift in market structure from bearish to bullish.
🔹 Strong Support Zone & Liquidity
We are still holding above a strong support zone, where previous demand has stepped in. This area has likely accumulated a lot of liquidity, with stop-losses from retail traders sitting just below. If price holds this level, it may trap sellers and trigger a short squeeze, pushing the price higher.
🔹 Possible Upside Move
As long as we remain above this support and confirmation continues, there is a high probability of an upward continuation. This could be the start of a bullish leg, especially if we see a break of recent highs with strength.
📈 Conclusion
This confluence of technical signals — double bottom, trendline breakout, and liquidity resting below support — gives us a strong reason to watch this setup closely.
👉 Like and follow if you’re seeing the same structure or planning to trade this move. Let’s ride it together!
Pi Coin Closes In On All-Time Low; Bitcoin ResponsiblePi Coin’s price is currently hovering around $0.499, which is approximately 20% above its all-time low of $0.400. However, the overall market environment suggests further decline may be imminent. With continued bearish sentiment and decreasing confidence in Pi Coin , the altcoin could struggle to maintain its current levels.
Furthermore, the correlation between the Pi Coin and Bitcoin has steadily decreased. Currently, it is just 0.07, a stark contrast to the positive relationship the two coins once shared.
A low or negative correlation means that Pi Coin is moving independently of Bitcoin. This is concerning for investors who have relied on Bitcoin’s momentum to drive altcoins like Pi forward.
If Pi Coin loses the support level of $0.493, it may drop further, potentially testing the $0.450 mark. A sustained decline below this support would make Pi Coin vulnerable to hitting its all-time low again. The ongoing outflows and negative market sentiment only add pressure to Pi Coin’s price, keeping it on a downward trajectory.
However, should the altcoin experience a shift in momentum, Pi Coin could find demand from investors looking to capitalize on a potential recovery. If the coin breaches $0.518 and flips into support, it could open the door for a price rebound. A reversal would allow Pi Coin to regain investor confidence and potentially invalidate the current bearish outlook.
The falling wedge of Pi Coin?Falling wedge Pi network pattern?The Pi Network (PI) token is currently showing signs of forming a falling wedge pattern, which is often interpreted as a bullish reversal signal in technical analysis. This pattern is characterized by two downward-sloping trendlines that converge, indicating a slowdown in bearish momentum.
One week to go.. just wait what will happen next.

Pi Network Price Prediction DAY Chart BUY AnalysisThe Pi Network (PI/USDT) is attracting increased attention from crypto traders and long-term investors alike, with growing speculation about its future price potential.
Based on the current technical chart dated May 26, 2025, several critical insights and projections can be drawn for those considering investment in this digital asset.
This analysis reflects personal views and does not constitute financial advice.
At the time of analysis, PI/USDT is trading at **$0.7812**, with visible consolidation just above the key support zone.
The chart displays three major **Take Profit (TP)** targets, reflecting potential bullish momentum in the medium to long term:
TP1: $1.0000
TP2: $1.6700
TP3: $3.0000

PIUSDT Daily Technical AnalysisPIUSDT Daily Technical Analysis
Pi Network Coin Indicators Are POSITIVE.
The price has broken above the 21-day moving average and successfully held above it. Currently, Pi Network appears to be targeting the $0.905 resistance level. After a wave of profit-taking, its recovery has increased the likelihood of continued positive price action. Resistance levels will be monitored closely. Indicators have turned positive from lower levels and are now pointing upward.
Resistance Levels: 0.900 – 0.963 – 0.999
Support Levels: 0.830 – 0.810 – 0.787
Positive news from the Pi Network team could support further upward price movement. Accumulating Pi Network Coin at these price levels for long-term investment might be considered potentially profitable. However, the decision is entirely yours. This is not financial advice. In the long run, Pi Network Coin may test the $3 levels again — or it might remain at a lower price range.
NOT FINANCIAL ADVICE
The information, commentary, and suggestions provided here do not constitute investment advice. Investment advisory services are offered only through a formal agreement with authorized institutions such as brokerage firms, portfolio management companies, or non-deposit banks.
The content on this page reflects personal opinions only. These views may not align with your financial situation or your risk and return preferences. Therefore, investment decisions should not be made solely based on the information provided here.
If you’d like to stay updated on our technical analyses — whether positive or risky — please follow and like us. We’d really appreciate your support!

Pi network is in the sistem progress development?Refering to the latest Consensus2025 at Toronto, most of Pi pioneers are disapointed on what happend. What the pioneers expecting is a sudden fly high price up to the sky or moon. But that still not yet happen. But when looking at Dr. Nickolas the way he walk in and sit, he show a high confident body language. He knowing what is he doing and what next.
After listening to the discussion, the number of peoples attend, who is coming, what are they discuss for. I see Pi is a diamond in the dust, hiding in the dust just waitting to be taken and to be polish. The two important key people attend is Eric Trump and Robert Hines. Eric is the important key role in Trump's family in running the family business.
This time the President Trump sending his best man from the The White House, Robert Hines to see and colecting data for their next steps. Why Robert Hines? Here some facts..
Robert Hines is the Executive Director of the President’s Council of Advisors for Digital Assets at the White House, where he leads efforts to develop and coordinate national policy on digital asset innovation, regulation, and emerging financial technologies. A graduate of Yale University and Wake Forest University School of Law, Hines brings a strong foundation in law, policy, and political strategy to his role. Prior to his work in the administration, he was active in national politics and continues to be a key voice on issues at the intersection of technology, regulation, and U.S. economic competitiveness.
For sure the President aware about this Pi Network now.
And lots of great people are coming to this massive event, and what we don't know is they are now busy working with the Pi Network system, into merge something new and astonishing.
Think about this :
1.Crypto + blockchain = OLD Cryptocurrencies (Slow)
2.Crypto + Blockchain + Web3 + Ai = Pi Network / Enhance cryptocurrencies. (Fast)
Seems that the crypto also need an upgrades.

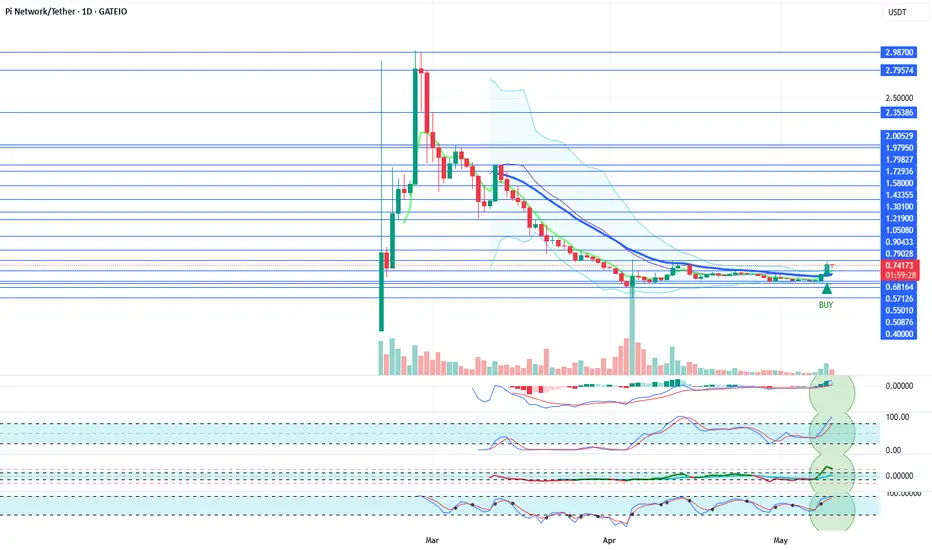
PIUSDT Daily Technical AnalysisPIUSDT Daily Technical Analysis
Pi Network Coin indicators are POSITIVE.
It has broken above the 21-day moving average and managed to stay above it.
The announcement that the Pi Network team will make about its ecosystem on May 14th could significantly benefit the project and increase activity around the cryptocurrency.
Resistance: 0.79028 - 0.90433 - 1.05080
Support: 0.68164 - 0.57126 - 0.55010
New and positive news from the Pi Network team could support a price increase.
At these levels, accumulating Pi Network Coin for long-term investment could be considered potentially profitable. The decision is yours. This is not investment advice.
In the long run, there is a possibility that Pi Network Coin could retest the $3 levels.
For users who use the Pi app and hold locked Pi Network Coins, if there is no urgent need, they may consider re-locking their coins for another 2 weeks. They can continue this strategy by monitoring the price every two weeks.
In the long term, the probability of the price reaching much better levels remains high.
THIS IS NOT INVESTMENT ADVICE.
The information, comments, and suggestions here do not fall under investment advisory services. Investment advisory services are provided under an agreement between clients and authorized institutions such as brokerage firms, portfolio management companies, and non-deposit banks.
The content of this page reflects only personal opinions.
These views may not be suitable for your financial situation or your risk and return preferences. Therefore, investment decisions should not be made based solely on the information and content on this page.
We’d appreciate it if you could follow and like us so you don’t miss our analyses with positive or risky technical indicators.
A silent Bull run?The last projection was astonishing and a remarkable, leaving a big candle spike. The whales are aware where the moneys are really go. Once one whale get the source, another whales will follow, that bring more spikes to the Pi coin price.
What do we expect from Pi consensus day? The even from May 14 to 16 in Toronto.
Some key expectations for the event include:
- Potential Pi Coin Rally : Experts predict that Pi Coin could experience a price surge during the event, especially if major announcements or partnerships are revealed.
- Major Announcements : The Pi Network team has hinted at a big ecosystem update on May 14, which could involve new partnerships, funding opportunities, or exchange listings.
- Founder’s Speech : Dr. Nicolas Kokkalis, Pi Network’s founder, is scheduled to speak at the event, potentially sharing insights into the network’s future.
- Exchange Listing Speculation : There are rumors that Binance may be testing Pi transactions, which could lead to a listing on the exchange.
With million of Pi network pioneer, this event could be the turning point for its adoption.
Web3 is ready to roar...

What is the possibility ? The golden cross has been appear, but what is the possibility of Pi Network REAL strength of Web3 techology and the ecosystem ?
The world today are still in the Web1 and Web2 technology internet, not yet entering the Web3 phase. And Web3 is now ready to use, just a matter of time.
Forecast maybe, Pi coin will have a nice trajectory of $3-4 in the short term. If the price didn't rise above the resistance, a one side movement will be ranging $0.65-0.74

PIUSDT Daily Technical AnalysisPIUSDT Daily Technical Analysis
Pi Network Coin indicators are POSITIVE.
It has broken above the 21-day moving average and managed to stay above it.
The announcement that the Pi Network team will make about its ecosystem on May 14th could significantly benefit the project and increase activity around the cryptocurrency.
Resistance: 0.79028 - 0.90433 - 1.05080
Support: 0.68164 - 0.57126 - 0.55010
New and positive news from the Pi Network team could support a price increase.
At these levels, accumulating Pi Network Coin for long-term investment could be considered potentially profitable. The decision is yours. This is not investment advice.
In the long run, there is a possibility that Pi Network Coin could retest the $3 levels.
For users who use the Pi app and hold locked Pi Network Coins, if there is no urgent need, they may consider re-locking their coins for another 2 weeks. They can continue this strategy by monitoring the price every two weeks.
In the long term, the probability of the price reaching much better levels remains high.
THIS IS NOT INVESTMENT ADVICE.
The information, comments, and suggestions here do not fall under investment advisory services. Investment advisory services are provided under an agreement between clients and authorized institutions such as brokerage firms, portfolio management companies, and non-deposit banks.
The content of this page reflects only personal opinions.
These views may not be suitable for your financial situation or your risk and return preferences. Therefore, investment decisions should not be made based solely on the information and content on this page.
We’d appreciate it if you could follow and like us so you don’t miss our analyses with positive or risky technical indicators.

PIUSDT Daily Technical AnalysisPIUSDT Daily Technical Analysis
Pi Network Coin indicators are POSITIVE.
On April 14th, Pi Network Coin faced a strong sell-off after failing to break above the 21-day moving average (0.75121), dropping down to the support level at 0.59073 before attempting to recover. If this support holds, it may test the 21-day moving average (now at 0.71713) again. If it can rise above this level, it will also break through the 0.69100 resistance at the same time. Overall, we can say that Pi Network Coin has halted its downtrend and increased the probability of a new upward move. Positive news from the Pi Network team could support a price increase. At these price levels, accumulating Pi Network Coin for long-term investment might be a reasonable decision. The final decision is yours. In the medium term, there's also a possibility that Pi Network Coin could retest the $3 level.
For users of the Pi app who have locked coins, if there's no urgent need, they can choose to relock their coins for another 2-week period instead of selling. They can then track the price every two weeks and decide to relock again if appropriate. The long-term potential for the price to reach much higher levels still remains strong.
THIS IS NOT INVESTMENT ADVICE.
The information, comments, and recommendations here do not constitute investment advice. Investment advisory services are provided within the framework of an agreement to be signed between the investor and brokerage firms, portfolio management companies, or non-deposit-taking banks. The content shared here reflects only personal opinions. These views may not be suitable for your financial situation, risk, and return preferences. Therefore, no investment decisions should be made solely based on this content.
If you'd like to avoid missing out on our technical analyses with positive or risky indicators, please follow and like us — we'd appreciate your support!

PIUSDT Daily Technical AnalysisPIUSDT Daily Technical Analysis
Pi Network Coin indicators are POSITIVE.
After experiencing a sharp decline, Pi Network Coin started showing sideways price movements following the positive action on April 5. Currently, it is trading above the support level of 0.5087. With today’s positive movement, a slight increase in volatility is also observed. If the positive sentiment in the cryptocurrency market continues, Pi Network Coin is likely to show upward movement as well. For stronger support and bullish momentum, it is important for the coin to break through the resistance levels at 0.6910 and 0.7711. Additionally, if it can break above the 21-day moving average around 0.8060, it may gain strength in the medium term and potentially reach back to the $1 level.
THIS IS NOT INVESTMENT ADVICE
The information, opinions, and suggestions here do not constitute investment advice. Investment advisory services are provided through an agreement between the investor and authorized institutions such as brokerage firms, portfolio management companies, and non-deposit banks.
The content on this page reflects personal opinions only. These views may not be suitable for your financial situation or your risk and return preferences. Therefore, no investment decisions should be made based solely on the information and writings on this page.
To avoid missing any of our analyses with positive or risky technical indicators, feel free to follow and like us — we would really appreciate it!

Pi Network is a stablecoin? “Cryptocurrency is becoming more popular. A legal framework for stablecoins is a good idea.”
Jerome H. Powell
The market, global economy is entering a greatest thunder storm, yet not end.. and it is still going. The financial market, organization, banks, ets.. are now getting fear, panicking on what is happening to the market crash, and new tariff pause.
Yet, there is a crypto..still not yet plumeting crashing and waitting the game changer. Crypto already grow rapidly fast years by years, and proven in the market crash, covid , the crypto still strong.
The price currently trying to breaking trough resistance and still in the bearish for the moment.

Eat a pie with PISo much closed narrow i mean the worlds something most narrow move you could expect

Pi Network has began to soar?Previously, Pi Network was keep on silent with the pioneers getting frustrated with declining prices. Just get reminded that Pi core team already mention that keep posted any NEWS coming. They are getting more working hours more than we had. So, pioneers just keep on what your doing daily, let the team core doing their part.
Global payments company BANXA has made a big splash by purchasing over 30.5 million Pi Coins, worth around $19 million. But this isn’t just another crypto deal—it’s a clear sign that major players are starting to take the Pi Network seriously as a future leader in digital payments.
With this move, BANXA now lets users buy Pi directly on its platform and send it straight to their wallets. This makes it much easier for users to access Pi, especially as the community keeps growing.
BANXA’s purchase isn’t just about owning Pi—it’s a vote of confidence in the entire Pi Network. It shows that Pi is no longer just an experiment, but a growing digital economy with real-world potential.
By supporting direct purchases and improving infrastructure, BANXA is helping Pi shift from a mined-only coin to one that has real value in the market.
This is a new steps in the crypto digital payment to all nation wide, with uncertain economy crashing today lots of countries are seeking the safest way to sustain economy. The traditional way of economy has getting older and slower.
My personal opinion is, Trump's crypto team now silently work closely with Pi core team to develop a new bond tie of digital economy, and will makeing a huge and powerfull worm hole of economy, that may suck any all kind of economy into it. Looks like a Si-Fi movie.. Lol..
The chat can be automaticly updated in every two hours, and I try to keep a new updates regarding Pi Coin , for the sake of Pi Pionners movement and Pi coin awarensess. Keep watch closely until th cup and handle chart pattern completed.

Breaking: $PI Dips 18% Today, Reaching New All-Time Low The price of the notable crypto asset NASDAQ:PI saw a nosedived today plummeting 18% reaching a new all time low price albeit the general crypto landscape is in a bloodbath with CRYPTOCAP:BTC dipping to $81k pivot similarly assets like CRYPTOCAP:ETH , CRYPTOCAP:SOL , $TRUMP and a whole lot of tokens saw a massive selling spree except for NYSE:FUN token that surged 55% today.
As of the time of writing, NASDAQ:PI is down 13% with the RSI at 21, this is hinting at a bullish reversal prior to the falling wedge pattern depicted in the chart. Other factors that attributed to the crypto currency and stock market downturn is the Donald Trumps' tax Tariff edict leading to Over $1.65 trillion wiped out from US stock market at open.
What Is Pi Network?
Pi Network is a social cryptocurrency, developer platform, and ecosystem designed for widespread accessibility and real-world utility. It enables users to mine and transact Pi using a mobile-friendly interface while supporting applications built within its blockchain ecosystem
Pi Price Live Data
The live Pi price today is $0.568544 USD with a 24-hour trading volume of $437,786,014 USD. Pi is down 16.31% in the last 24 hours. The current CoinMarketCap ranking is #27, with a live market cap of $3,862,744,520 USD. It has a circulating supply of 6,794,101,040 PI coins and a max. supply of 100,000,000,000 PI coins.
Just In: $PI Dips 6% Losing The $1 Pivot- Is There Still Hope?The price of the crypto currency NASDAQ:PI saw s noteworthy dip today, down by 6% approaching All time Low (ATL). With massive selling pressure, NASDAQ:PI has lose the $1 pivot to the bears.
However, with the appearance of a falling wedge, it clearly hints at an impending bullish reversal on the horizon with a speculated 350% surge albeit the crypto is having its own fair share of the marker's volatility.
With the RSI at 31 further hinting at a trend reversal, a breakout might be lurking around the corners.
Pi Price Live Data
The live Pi price today is $0.678989 USD with a 24-hour trading volume of $213,832,968 USD. Pi is down 5.03% in the last 24 hours. The current CoinMarketCap ranking is #26, with a live market cap of $4,612,460,558 USD. It has a circulating supply of 6,793,134,138 PI coins and a max. supply of 100,000,000,000 PI coins.

PIUSDT Daily Technical AnalysisPIUSDT Daily Technical Analysis
Pi Network Coin indicators are NEGATIVE. The selling pressure on Pi Coin is still ongoing. Indicators are at a low position but still appear negative. If it can move sideways above the 0.92957 support level, the chances of recovery in the coming days may increase. The 0.92957 - 0.858 price levels are important support points.
It seems that the Pi Network team is somewhat weak in social communication. The applications created on the platform are still inactive, and the KYC period for users who joined before the Mainnet has now expired. There has been no explanation regarding the coins removed from accounts, or at least, we haven't seen one. In fact, no statement has been made on their YouTube channel either. If the coin does not break below these support levels, it could create a buying opportunity for positive price movements in the future. There is currently no clear information, so we will see how things develop.
NOT INVESTMENT ADVICE.
The information, comments, and recommendations provided here do not constitute investment advice. Investment advisory services are offered within the framework of an agreement between clients and brokerage firms, portfolio management companies, and non-deposit banks. The content on this page reflects only personal opinions. These views may not be suitable for your financial situation, risk tolerance, or return preferences. Therefore, investments should not be made based on the information and writings on this page.
To avoid missing our analyses of both positive and risky technical indicators, follow us and like our content—we would appreciate it!

PIUSDT Hourly Technical AnalysisPIUSDT Hourly Technical Analysis
In the 1-hour technical analysis of Pi Network Coin, the selling pressure continues as it failed to break the 1.21 resistance. The price has dropped to the 1.0770 support level. If this support is also broken downward, the next support levels are 1.031 - 1.010. Our current expectation is negative. Next week, we may shift to daily technical analysis since daily technical data is also becoming clearer. However, for now, the daily outlook also appears negative. If there are sharp declines, buying at lower prices could create a potential for significant long-term returns.
THIS IS NOT INVESTMENT ADVICE.
The information, comments, and recommendations provided here do not constitute investment advice. Investment advisory services are provided within the framework of an investment advisory agreement signed between the investor and brokerage firms, portfolio management companies, or non-deposit banks. The content on this page reflects only personal opinions and may not be suitable for your financial situation, risk tolerance, or return expectations. Therefore, no investment decisions should be made based on the information and statements provided here.
To stay updated on our analyses with both positive and risky technical indicators, please follow and like our page. Your support is greatly appreciated!

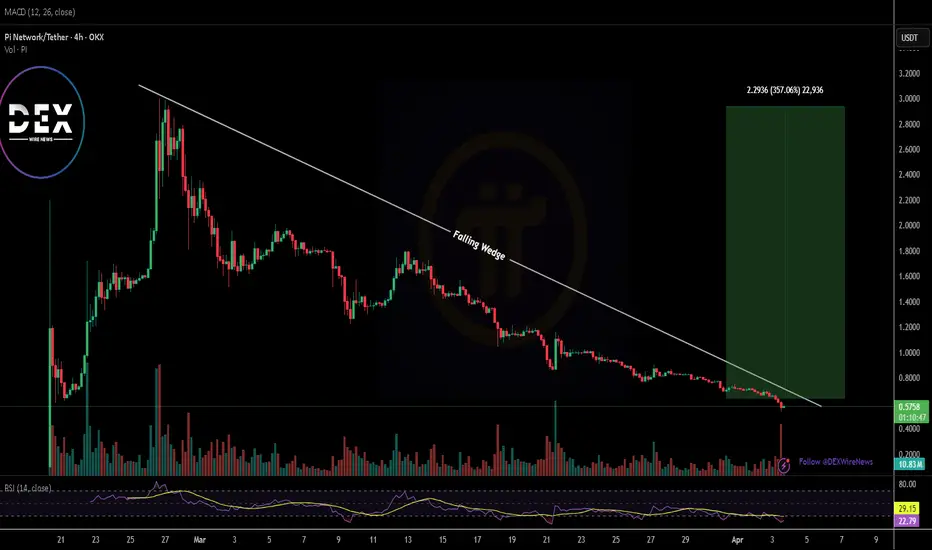
Just In: $PI Set for 200% Surge Amidst Steep Falling WedgeThe price of price is set to skyrocket amidst a steep falling wedge pattern that has left the asset plummeting currently down 14%.
While the asset is currently oversold as indicated by the Relative strength index (RSI) of 21, this adds more credence to the bullish thesis. With a recent All time high (ATH) of $2.98 and a total and maximum supply of 100 billion tokens, PI coin is more than ready to capitalize on this market dip to spark a renaissance.
Albeit the crypto market is facing turbulence time at the moment, with the crypto fear and greed index dipping to 27% hinting at a bearish sentiment. Similarly, CRYPTOCAP:BTC lose its dominance over altcoin with the ration pegged as 21% bitcoin and the remaining 79% comprises of all the remaining tokens. This metric hints at a potential altcoin season incoming and NASDAQ:PI is not exempted.
Pi Price Live Data
The live Pi price today is $0.897547 USD with a 24-hour trading volume of $543,904,959 USD. Pi is down 23.67% in the last 24 hours, with a live market cap of $6,122,316,736 USD. It has a circulating supply of 6,821,168,428 PI coins and a max. supply of 100,000,000,000 PI coins.

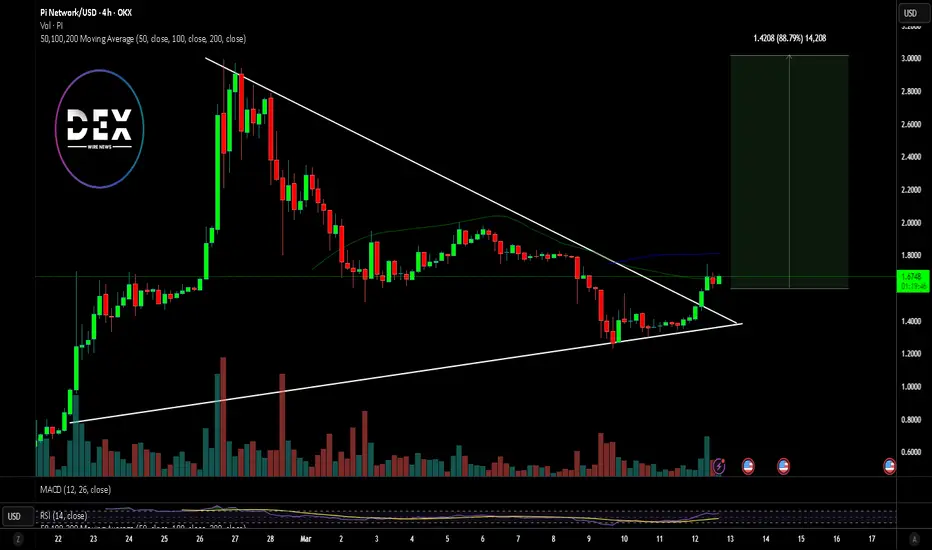
$PI Set for Massive Breakout Amidst Bullish Symmetrical TriangleThe long-awaited launch of NASDAQ:PI has ignited excitement in the crypto space. After six years of mining, Pi Coin finally hit the open market last month, and its price action suggests a potential major breakout. With a bullish symmetrical triangle pattern forming and key technical indicators aligning in its favor, NASDAQ:PI is gaining traction among investors and traders alike.
Technical Analysis
Pi Coin is currently trading at $1.66, having surged 22.75% in the last 24 hours. Its 24-hour trading volume stands at an impressive $811,256,445, indicating strong market interest.
Symmetrical Triangle Formation
A symmetrical triangle is often considered a continuation pattern, signaling a potential breakout in the direction of the prior trend. NASDAQ:PI recently broke out of this bullish formation, setting the stage for further upside movement.
The Relative Strength Index (RSI) sits at 62, suggesting increasing buying pressure. An RSI above 70 typically signals overbought conditions, but with room for growth, NASDAQ:PI is positioned for an extended bullish campaign. If buying pressure intensifies, NASDAQ:PI could soon breach the key psychological resistance at $2, with the next pivot point set at $3.
Market Capitalization and Trading Volume
NASDAQ:PI boasts a live market cap of $11.91 billion, with a circulating supply of 7.15 billion coins. Such a high ranking underscores the coin’s growing adoption and market confidence.
Conclusion: What’s Next for Pi Coin?
With strong technical indicators and a solid fundamental foundation, NASDAQ:PI appears well-positioned for continued growth. If the buying momentum sustains, breaking the $2 resistance could open the door for a push towards $3. Meanwhile, its unique approach to mining and real-world adoption potential make it an intriguing project for long-term investors.