PIDILITIND: High-Probability Trade Setup1️⃣ Current Market Structure & Fibonacci Setup
The price is currently in a corrective wave, forming a potential ABC pattern from the swing high of ₹3,385.40.
The correction aligns with the crucial 113%-127% retracement zone, a powerful reversal area often referred to as the golden extension zone.
Support Zone: ₹2,945 - ₹2,886 (Demand Zone)
Golden Retracement Zone: ₹2,817 - ₹2,850
Stop Loss: Below ₹2,817 (Day Close Basis)
Target Zone: ₹3,332 - ₹3,364 (Volume Imbalance Zone)
2️⃣ Why is the 113%-127% Retracement Zone Important?
Liquidity Grab: This zone often acts as a "trap" where liquidity is taken before the market reverses.
Reversal Point: It overlaps with demand zones and volume imbalances, making it a high-probability area.
Harmonics: Possible completion of a corrective wave C in this range, signaling a potential trend reversal.
3️⃣ Volume & Break of Structure (BoS)
Volume Imbalance: The price has left a gap at higher levels, which will likely act as a magnet for future bullish moves.
Break of Structure: A breakout above ₹3,075 will confirm bullish continuation toward the ₹3,332-₹3,364 zone.
4️⃣ Trade Plan with Confluences
Entry Zone: ₹2,945 - ₹2,886
Stop Loss: Below ₹2,817 (Day Close Basis)
Target 1: ₹3,162.35 (Immediate Resistance)
Target 2: ₹3,332 - ₹3,364 (Volume Imbalance Zone)
Confluence Factors:
Price nearing a demand zone with FVG overlap.
113%-127% retracement aligns with Fibonacci and market psychology.
Wave C correction appears to be completing.
5️⃣ Risk Management
Always prioritize risk management in your trades.
Position sizing should align with your risk tolerance.
Monitor price action near ₹3,075 for confirmation of bullish strength.
If the price breaks ₹2,817, reassess the setup.
Key Takeaway :
Pidilite Industries offers a great educational case study on using Fibonacci, demand zones, and structural analysis together. The golden retracement zone and volume imbalance make this a high-probability trade idea for both swing and positional traders.
If you find this analysis insightful, drop a like 👍 , leave your thoughts in the comments, and follow for more educational market insights! 📊📈
Pidilite

PIDILITIND bullish buy "PIDILITIND bullish," it seems that the overall sentiment is positive, with many analysts and technical indicators suggesting a potential increase in the stock price

Pidilite Industries Ltd.*Pidilite Industries Ltd.*
C&H Formation on Yearly Basis.
Vol. Consolidation gaining Traction.
Price BreakOut >3072 Needed & Should Sustain. Then Good to go!!! To be Watched.
Financially strong company. Sector Outlook Highly Positive for Co.
*Concern*
Spike & Sustained Crude oil prices.
*Trail SL with Upside*
*Book Profit as per Risk Appetite*
*Do Your Own Research as well. This is an Opinion*
*_Happy Investing_*🤓

Pidilite is back breaking out of a VCPBullish on my Long term holding.. Its broken out of a consolidation above 2700 after a VCP was formed for a long time..
T1 3300
T2 3700
T3 4100


Bullish on Pidilite Broke High of Red volume Engulf candle by current candle
Selling Pressure is absorbed by current green candle
Disclaimer : it's my personal view, do your own analysis before taking any trade

My view on Pidilitind Pidilitind forming double bottom on 1 day time frame.
Giving breakout above 2796 level.
Looking tgt 2840-2860-2900++
in very short term.
Keeping on radar Pidilitind 2800 CE

PIDILITE is on trendlinemy view on PITILITE to get in to go long at the trendline as per given limited rist of last swing/trendline breakdown.
RSI 40 on support daily timeframe and last day green candle gives long singnal
DISCLAIMER: above is my own personal view only for study purposes.

{PIDILITE}:{SHORT for 3:1}
Price has reacted to a Monthly Supply (Left Side) to reach The Fresh Monthly Demand, basically this is a PPullback before the Upward Impulse, still the Reward to Risk ratio is favourable hence shorting,
The Exit is @ Monthly Demand Entrance so Exit on Time is as critical as the Entry,
ENJOY THE RIDE ! ! !

Bearish flag pidiliteBearish flag below the 200 dma. Pidilite is consolidating at 2300 which is a strong support. And break below can take it to 2000 which is the next support.
Execution - take in the money calls at 2400 as they are cheap on iv basis. 2400 puts at 100. Stop loss at 2360 which would be 50 bucks. Target of 2100 or above the next logical support shown on the chart.

PIDILITE INDIA, ANALYSIS!!a monopoly stock, with great returns in a year, is the greatest thing to have.
a detailed analysis is written down:
firstly , the red trend, is the original trend past corona crash.
now since the markets had become bullish post corona crash, it has formed a new trend, and that is drawn by dark black line. the red line resistance, has now become support of stock.
after the rally, markets were consolidated, and the stock was moving sideways. then came the june- sept rally 2022, since then markets got consolidated, and became volatile.
since then from 3 months, stock is forming a good traingle pattern, there could be a breakout.
moving to next point,
since the stock is bottom of its trend, this makes sure that is in its support zone, a good pullback was show today.
RSI ANALYSIS: average time of stock's rsi moving is from 50-70. currently the stocks rsi is 50, this says that unless there is a bear market for pidilite, the stock is bottom off. this again shows a bull move, coming.
i predict that, if volume not supporting the price, and if INDIA'S bear market for shorter term, continues, stock could fall further, but since the stock has been mostly bottomed out then if stock started showing a positive move, then one can take some swing positions, and may exit around 2800. if it breaches the 2600 support of traingle formation, then i see downside till the 2500.
i hope that stock would move about 7% upward.

PidilitePidilite CMP 2592
Aggressive players can buy here.
Safe players buy above 2620
SL Below 2540
Target 2730/2800/2900
Positional / Swing

PIDILITIND LONG PIDILITIND Long Side in Positional Basis Opportunity
Wait For Green Closing Candle Near price 2662 & Start to Long Run. Current Hourly & 30 Min TF is bearish so wait For One Daily Time frame Green Candle & enter.
Buying Price - 2662
Stoploss Price - 2590
Target Price - 2920

PIDILITINDNSE:PIDILITIND
One Can Enter Now ! Or Wait for Retest of the FIB Level.
Note :
1.One Can Go long with a Strict SL below the Trendline or Swing Low of Daily Candle.
2. Close, should be good and Clean.
3. R:R ratio should be 1 :2 minimum
4. Plan as per your RISK appetite
Disclaimer : You are responsible for your Profits and loss, Shared for Educational purpose!

PIDILITE Trade setup Idea for 09 September, 2022PIDILITE has been performing quite well.
It recently took the support at the 2800 levels and rebounded beautifully back to 2869.
We can go long once the stock crosses 2875, with a stop loss of 6 and a target of 2900.


Pidilitind Looking Bullish 2320Pidilitind Looking Bullish 2320 & WILL TOUCH 2370-2440-2500 IN COMING DAYS

Pidilite at resistance. upper circuitPidilite at its resistance after a breakout from a descending channel as shown. Expecting to reverse

Pidilight bearish pattern Pidilight bearish harmonic cypher pattern complete,2370/2385 supply zone, maybe we can see some corrections here .

Pidilitind Looking Bullish 2320 (POSITIONAL)Pidilitind Looking Bullish 2320 & WILL TOUCH 2370-2440-2500 IN COMING DAYS

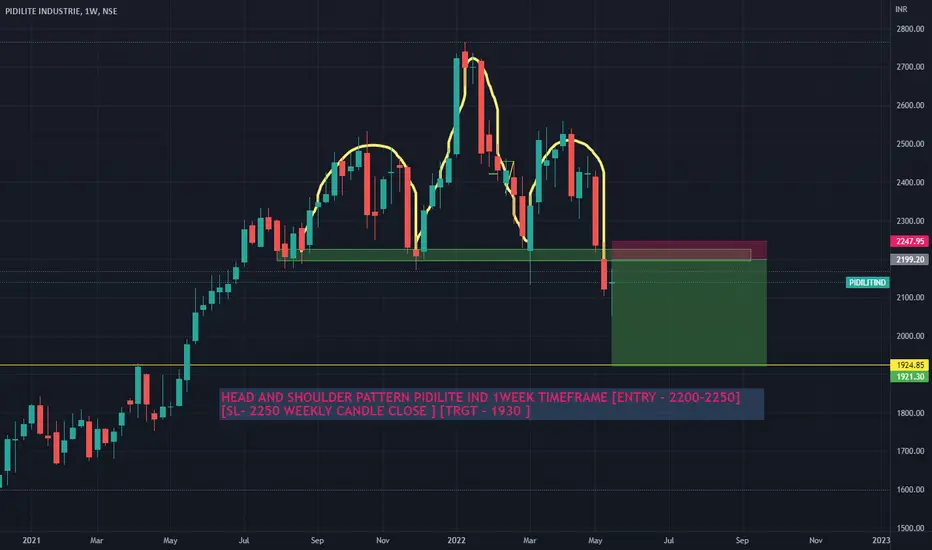
PIDILITE INDUSTRIESfevicol is forming head and shoulder pattern in weekly time frame we can accumulate puts in 2200-2250
it making channal pattren it making channal pattren and above the 44 moving avarage line so it may go long

PIDILITIND Flag and Pole PatternThe stock has made flag and pole pattern. It can give a good move in coming days. Keep an eye ! This is just for educational purpose and not any investment/trading advise. Do your own analysis too.
