Pidilite
PIDILITIND LOOK OUT FOR THESE LEVELS!!! ALL THE LEVELS AND PATTERNS ARE MARKED ON CHART, RED ZONES DENOTES SUPPLY ZONES AND GREEN IS FOR DEMAND ZONE .
BUY BETWEEN 1575-1565 FOR TARGETS OF 1600/1620/1640 SL: 1545
The indicator used:
1) Daily Lines plots Daily 20 (BLACK) & 50 EMA (GREY) on lower time frame charts
2) TE-REKAB
- PB : PULLBACK
If you like the analysis, do leave a like and follow for more such content coming up.
The analysis is my POV, hope you got bucks in your pocket to consult a financial advisor before investing :P :)
HAPPY TRADING!
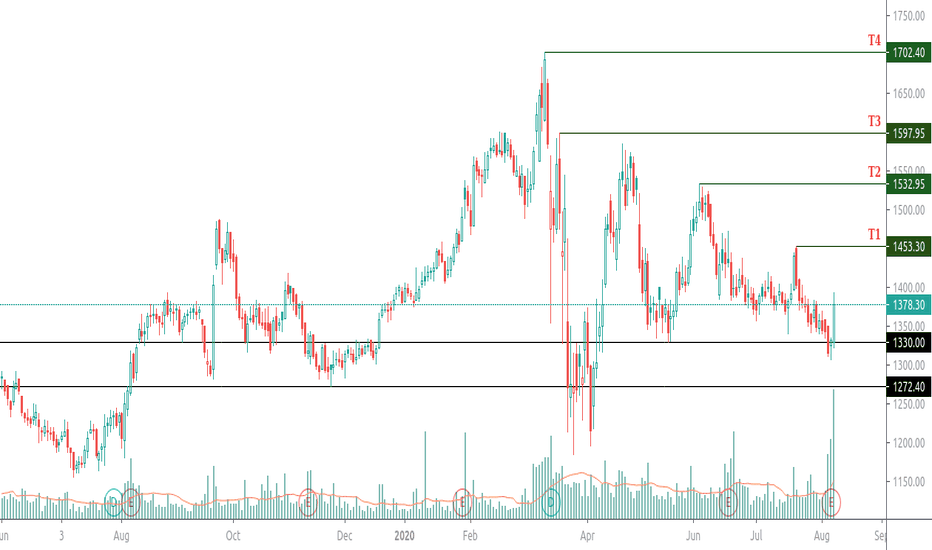
PIDILITE Industries shoing reversal from its support level.NSE:PIDILITIND
PIDILITE on daily chart taken a goods support and showing reversal.
Whats looks interesting here is the price and volume movement at its support level one can check the chart and observe the same.
There is nothing too much complicated here everything is just nice and simple as I expected.
For positional traders its looks bullish on daily chart with SL 1270 Targets are mentioned on chart so do check.


