Weekly Bearish Pinbar followed by a Shooting Star Retest2 Weeks ago DPZ tried to conquer the level of 432 and failed then tried again this week and confirmed it's failure. We now have Hidden Bearish Divergence on the MFI and we have Weekly Momentum Pointing downwards on the Momentum Indicator. I will be looking for around an 80 percent pullback towards the $330 area from here.
Pin Bar

Ethereum (ETH), time to BUY !!!Hey traders !
on chart you can see four signals telling us queen of cryptocurrency will Rise..
1. a positive divergence on stochastic
2.RSI is in oversold level which means a uptrend at soon future
3. price didn't break selected support zone
4. we see 2 pin-bars highlighted on chart that confirm uptrend
i think these 4 signals are as powerful as to determine an uptrend ( even its possible that ETH give one more fall(pullback) and then rise massively)
dont forgot to like and comment :)

NQ - are the bears done selling?Yesterday's pin bar close could be a sign that selling is getting exhausted. With trendline support tested (and rejected) twice in a week, the odds appear to be in the bulls favour now. Hence I am cautiously bullish at the moment. To be doubly sure, wait for a break up of the near term trendline (in green) to get bullish.
However, should NQ break below the larger red trendline support (though the chance of this happening appears to be diminishing), then it will likely head towards the horizontal support zone of 12200-12300.
Disclaimer: TA is about improving our odds of a successful trade, but there is no guarantee. This is just my own analysis and opinion for discussion and is not a trade advice. Kindly do your own due diligence and trade according to your own risk tolerance and don't forget that money management is important! Thank you. Feel free to let me have your comments ! :)

LTCUSD Litecoin EMA 10 EMA 20 Pin Bar 15 May '21 03:00LTCUSD Price broke 334.86 support resistance level. Price pulled back into exponential moving averages and formed a pin bar. Entry at pin bar candlestick closing price.

ETPUSD Entry Price is near the EMA 10 EMA 20Entry at the EMA 10 EMA 20 area. Stop loss above the EMA 20 numeric value.

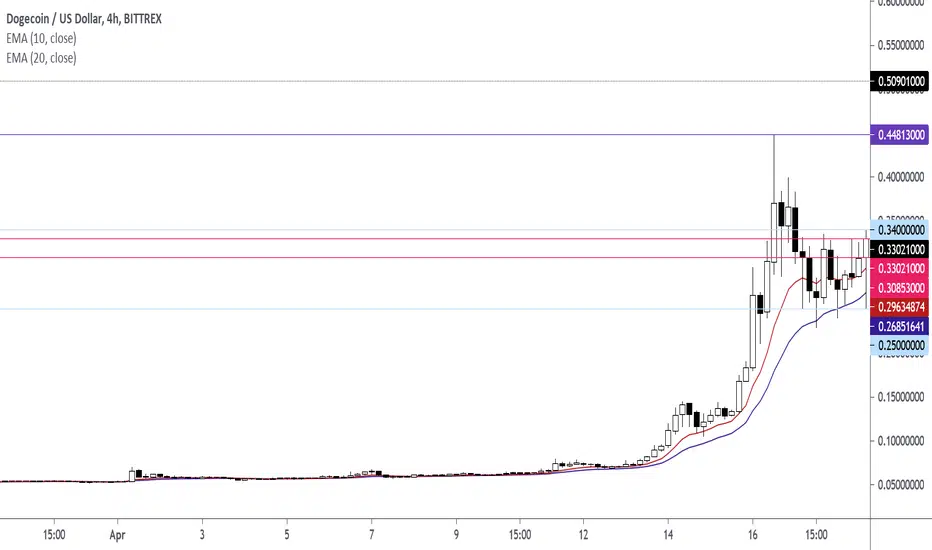
Dogecoin/USDollar EMA 10 EMA 20 Pin Bar H4 ChartThe open|close price is beneath the EMA 10 and above the EMA 20. Open|Close Price is in the EMA 10 EMA 20 area. The high price is above the EMA 10 EMA 20. The pin bar is located at a higher low.

DOGEUSD Dogecoin Entry Price near OHLCOn the H4 Chart, the best entry was at the closing price on 18 Apr '21 at 19:00. Wait for the next Pin Bar to occur on the H4 Chart. The Pin Bar to trade should have the Open High Low Close near the EMA 10 EMA 20 values.

japanese candlestick patterns (pin bar)The pin bar:
It is candlestick pattern that consists of just one candle, it has a long lower wick and short body and little or no upper wick. Strictly speaking, the lower wick should be at least two times longer than the body, the longer, the better.
There are two types of pin bar , the bullish pin bar which is a reversal candle that occurs at the end of downtrend and reverse the trend. A bearish pin bar which is also a reversal candle that happens at the end of an uptrend and revers it
As you can see this chart, almost pin bar appear the trend will change reversal. This is one of the best in price action.

SUGARUSD EMA 10 EMA 20 Pin Bar TradeAfter a break out, wait for the right moment to enter. Don't be in a rush to enter the market. Wait for confirmation of the trade set up. If trade signal does not occur, then do not enter the market.
For SUGARUSD, the confirmation signal occurred on February 4, 2021. See Pin Bar located at the EMA 10 EMA 20. After price breaks a horizontal key level, wait for the trade signal. Price may bounce around the horizontal support resistance key level. The signal may not fall neatly on support resistance level. Remember support resistance levels are areas. Be patient and wait for a signal to form in the area.

USDCHF Pin Bar at Support Resistance; EMA 10; EMA 20Traded USDCHF Currency Pair This Morning Using The Same Strategy. Used a bullish price action chart pattern with a bullish pin par. Pin bar with inverse head and shoulders neckline, EMA 10, EMA 20.

GBPUSD down to 1.3920 - premarket forecastExpecting GBPUSD to retrace to 1.3920 after rejecting off of resistance that has held price within a daily consolidation range for a couple of weeks now. Maybe price gets enough steam after retracing to break out of the range but it is showing signs of rejection at the top of the range on the daily chart and with a pinbar formed at resistance on the 4 hour chart.


CADJPY - Mean Reversion TradeMean Reversion Trade is something that I don't usually trade, but in this case, it looks like the candle close is going to form a long shadow candle within the Weekly Chart resistance area(supply area) providing an amazing Reward:Risk.

ETCUSDT inside 4hr after daily hammer breakoutETH has been one of the strongest crypto after being slumped, and ETC hasn't really followed much.
Here we got the inside 4hr after its daily hammer was broke to the upside.
I would love to trade the inside 4hr breakout yo!
Let's see how it goes !


Daily new york session watchlistGBUSD as we remind you was moving into the range boundries now it is near to the major psychological level where we are expecting the breakout for the growth zone start now wait for confirmation and more confluence nee to match all the price action
Make sure you watch the price action closely in each analysis as this is a very important part of our method

LTCUSD Litecoin ; Trend ; Pin Bar ; EMA 10 ; EMA 20Litecoin (LTCUSD) Mean Reversion Trade Set Up.
Enter after pin bar formed. Enter at the closing price of pin bar. Target previous swing high for take profit. Placed stop loss at pin bar low.

Pullback In A Trend | EMA 10 | EMA 20 | Pin Bar | NEOUSDNEOUSD
Enter at Pin Bar Close. Exit At Previous Swing High For Take Profit. Place Stop Loss At Pin Bar Low. H1 Chart.

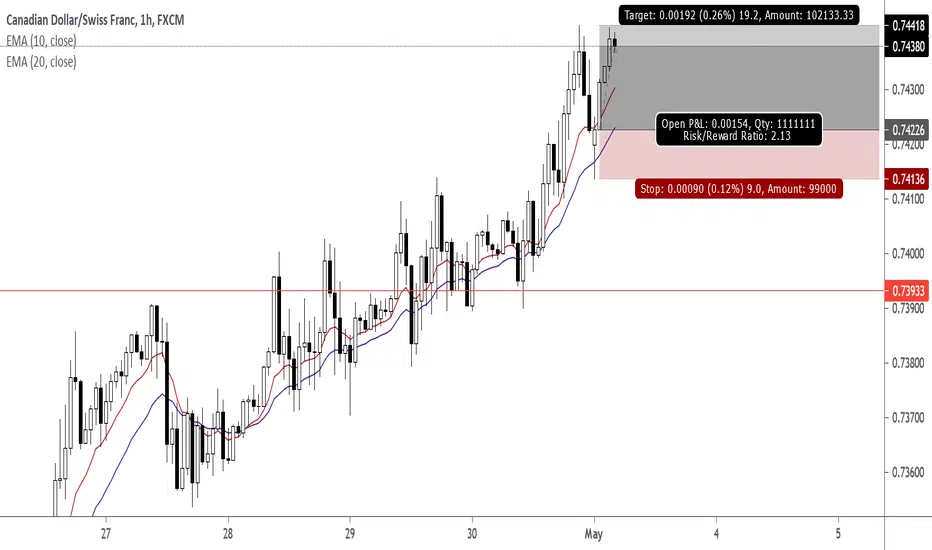
Pullback In A Trend | EMA 10 | EMA 20 | Pin Bar | CADCHFCADCHF
Enter at Pin Bar Close. Exit At Previous Swing High For Take Profit. Place Stop Loss At Pin Bar Low. H1 Chart.
Pullback In A Trend | EMA 10 | EMA 20 | Pin Bar | EURSEKEnter at Pin Bar Close. Exit At Previous Swing High For Take Profit. Place Stop Loss At Pin Bar Low. H1 Chart.
