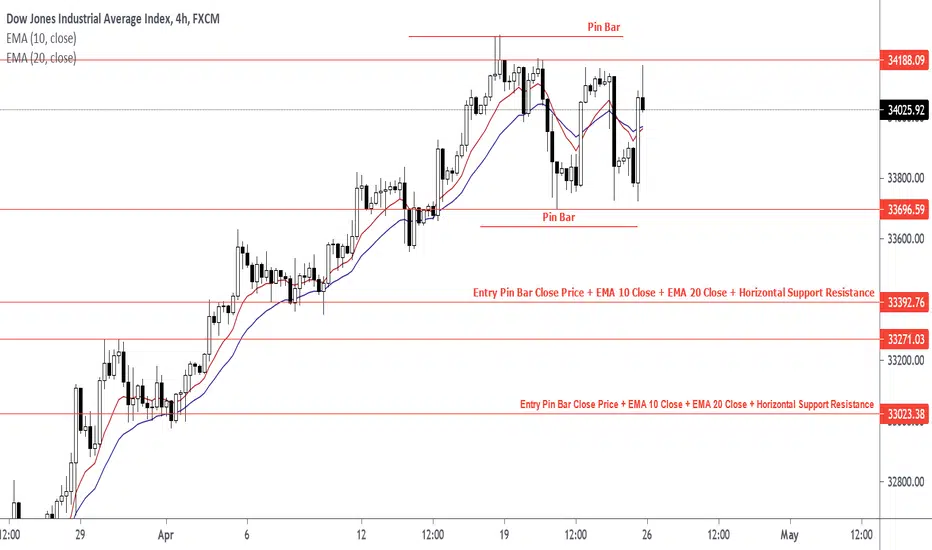
US30 ; Wait For Price To Close Above 34188.09US30 ; After A Close Above 34188.09, watch for a price action signal like a pin bar to form. Pin Bars located at a higher low for long positions and pin bars located at a lower high for short positions perform the best.
Pin Bar
XMRUSD Entry Price LevelsWatch for a buying opportunity at 330.06; 327.64; 325.97. Watch Fibonacci 50% Retracement of Pin Bar for a buy entry at price 329.04.


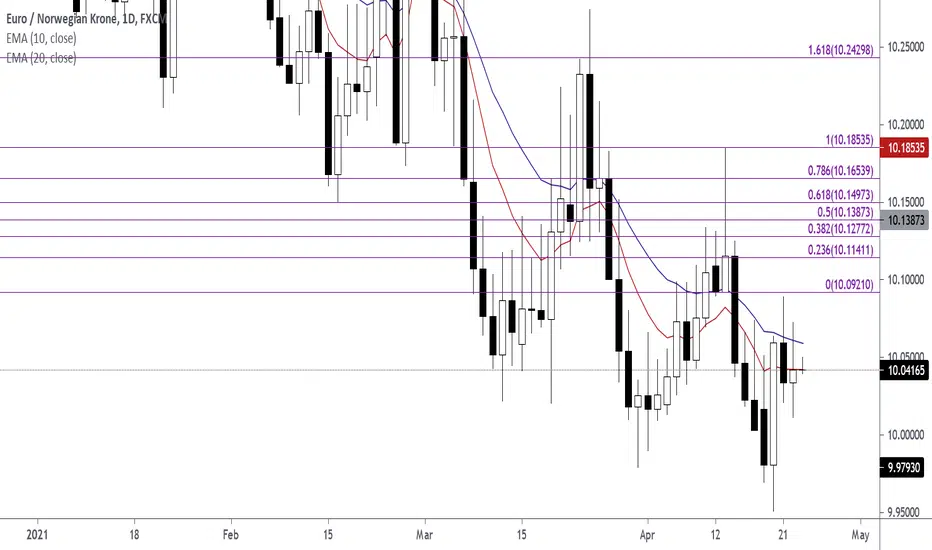
50% Fibonacci Retracement of Pin Bar for EURNOK | Pin Bar | EMAEntry at 50% Retracement of Pin Bar. Entry at 10.13873.
Fibonacci Retracement Entry For Pin Bar | Ethereum | ETHUSDFibonacci Retracement Level 0.500; 0.236; 0.000
Entries at 2170.50; 2260.52; 2341.00
Pin Bar at Fibonacci Retracement Level 0.500; 0.236; 0.000
---------------------------------------------------------------------------------------
Daily Time Frame Pin Bar + Fibonacci Retracement

EURGBP Target Price 0.87308EURGBP Exponential Moving Average Period 10 Price, Exponential Moving Average Period 20 Price, Open Price, Close Price, High Price, Low Price
Trend: Up Trend
Level: Horizontal Support Resistance, Dynamic Support Resistance
Signal: Pin Bar
Open Price and Close Price is between the area of EMA 10 and EMA 20.
EMA 10 is above EMA 20. Both EMA point up.


Is it possible for PBBANK drop till ~ RM1.60?! Updated 20/4/21There was a Pin Bar in monthly chart of Public Bank Stock Price..

GBPUSD Target Price 1.42410Wait for price to pull back to the exponential moving averages before entering a long position.


3X BTC Bear Token Looks Ready To Make High Percentage MovesBTC is showing exhaustion on the MACD and RSI at the Logscale 1.618 PCZ of a Bearish Butterfly and looks to be gearing up for further downside. The way I plan play this move is by buying the 3X Short Token for BTC as it looks to be breaking out bullishly on on the Daily RSI and the MACD seems to be ready to make some more Positive Momentum.
The weekly for this 3X Bear Token also looks to be showing a Bullish Pinbar if it manages to close the day and thus the week the way it is now.
Overall i think the it has the potential to go back to the 1 cent area.

4.59R Trade for XAGUSD Silver4.59R
4.42R
s3.tradingview.com
2.68R
s3.tradingview.com
2R
s3.tradingview.com

LTCUSD | Support Resistance Level For LitecoinLTCUSD Support and Resistance Level
LTCUSD Dynamic Support and Resistance Level
