Seller Re Entry at Fresh Top Candle Zone?Current seller makes Bearish Pinbar. And seems like this is the first seller trial, showing signal of possible seller getting more supply to make downtrend. Sign of H1 Bearish Pinbar and fresh Top candle supply zone, more likely I will sell entry starting from High price of Bearish Pinbar. For this pattern on H1, I will safe exit at starting of demand zone of bottom candle.
Pin Bar

The "PIN BAR" Story Hi Pro Trader's .. Hope You Be Fine ♥
Today We Have Very Important Education Lesson .. THE PIN BAR STORY
The Pin Bar In Candle .. Came To Change The Pair Direction ..
we Have 3 Levels For It
Strong .. That's Came And Change Direction With High Move
Medium .. That's Came And Change Direction With Medium Move
Week .. That's Came And Change in Direction Will Happen
Start Trade Now With PIN BAR .. And Tell US Results
Be Safe -- Trade Safe

ITC - Trend ReversalITC formed a beautiful bullish pin bar from golden Fib level 0.618 + resistance zone.
If it manages to cross Fib level 0.382, possible target of 225.


NZDCHF 5-0 ON HOURLY The final leg has also formed a very nice 1.00AB=CD which hopefully increases our odds. I like those stoch crossovers as paired with a little divergence. I am pretty confident about this trade. Will use 3 positions; 2 targets and 1 trailed position.

EUR/GBP - Long Term Support Level Continues to HoldThis is EUR/GBP on the Daily Chart.
We can see price has respected this level of support since May 26th 2020.
Once again price has tanked down to our support level and bulls have been sitting at our support zone - we can see price starting to move away from our key area yet again to the upside.
We can use candlesticks at this key level as extra confirmation - such as an engulfing candle, or the bullish pin bar.
Any questions, just ask!

BTC - Pin Bar Formation but RSI Bearish DivergenceWas quite the drop today, swapped some Gold for Bitcoin-adjacent equity QBTC - more than doubled my position, also HIVE - doubled position - did not get the best prices, but close enough. When I sold the gold prior (Mutual Fund), the timing could not be better to get a half decent price and to buy those equities on a dip prior to the weekend, where all bets on BTC are off in my mind. The move up on this pin bar tells me that better to be safe than sorry in case Bitcoin suddenly breaks trend and moves up. Still not all the way there in terms of where I want to be on those equities, but closer.
RSI seems to be tracking some bearish divergence to my eyes, with price settling higher than, but RSI printing lower on the RSI trend line I've drawn. The divergence is not very large, but not insignificant at this point and I would not be surprised if we were to see lower prices by Sunday despite that 4-hour Pin Bar. Could be a short idea in there somewhere, but trading it would be a matter of timing and cutting losses very quickly if price does not manifest lower than the entry. Something to look at tomorrow perhaps.
All in all, I would say my bias is neutral and that playing the range that we have is most likely what traders are doing right now - might join them with a tiny stack that I reserve for trading purposes. If I were to place a bet, I would be selling as high as it can go in the next day or two and look to exit on a re-test (and possible failure) of 32 K (exact number would be found along the bottom of the trend line). Too much of a headache at this point to play it, and perhaps that is for the best.


EURGBP - Longsetup #RRR 1:4 (min) #RRR 1:10 (max)Dear Traders,
today I analyze the EURGBP on the 1 hour chart. Based on the reducing volumes on the the last candles, the touching the bottom support line and developing a pin bar I expect a increasing direction upside.
I tried to draw the development of priceaction near the local HVN (high volume nodes => orange line boxes).
Moreover, the minimum RiskReturnRatio would be 1:4 - and the maximal RiskReturnRatio would be 1:10.
Kind regards
NXT2017

GBPJPY - SHORT Nice bearish candle forming on the daily time frame, a move back down towards this ascending trend line

TWTR - presented opportunity to longI am not sure why TWTR should crash just because it banned Donald Trump permanently. But tank it did! Falling 12.5% to 45.15 from last Friday's close of 51.48, briefly breaching the 61.8% fibonacci retracement level but stopped short of the longer term trendline support @ 44.50
A bullish pin bar is forming right now as well as a potential bullish divergence between price and RSI. I decided to long as it began to recover above today's open (> 47.10), with initial stop placed just slightly below the trendline (currently @ 44.50).
Looking to trail the stops up if trade goes my way.
Disclaimer: This is just my own analysis and opinion for discussion and is not a trade advice. Kindly do your own due diligence and trade according to your own risk tolerance. Thank you. Feel free to give me your thoughts ! :)

Weekly Bullish Divergence: One Final Chance for a USD Comeback!DXY showing some seller exhaustion here we are attempting another breakout of a wedge that we have been stuck in for about a year.
We have some classic bullish divergence on both the RSI and MACD weekly.
Along with the divergence we closed last week above the bottom trendline with a Bullish Pinbar which is a bullish candlestick reversal pattern commonly found near the end of downtrends.
The looks to be the final stand for the US Dollar as if we don't bounce here we are likely in serious trouble and will see much lower prices.
Based off the technical I expect us to see a sharp reversal to the upside and suspect that USD will perform well on USD Pairs and that stocks will do badly in the comings days and weeks.

NZDJPY hourly 0.618 and shooting star combination shortYen had been the strongest currency since 2021 as dollar bounced a little bit yesterday.
Trying to get involved is one of my main focus today.
Here I got this little hourly shooting star after 0.618,
quite a good trade though.
I'll only be interested in the breakdown short, if it didn't break to the downside I'll cancel the trade.
Let's see how it goes yo!

GBPNZD DAY Pinbar candles In the support zone BUYHello traders GBPNZD DAY Pinbar candles. Price reversal In the support zone There is a chance to go up to the key resistance at 1.983.
If you find this analysis useful, please support me with your likes and comments.
If you have another analysis on this pair, please share it in the comments.
Good luck.

AUDUSD DAY price reversal pinbar sellHello Traders. AUDUSD DAY price reversal pinbar and rsi divergence.
Opportunity comes down to the important support zone.
If you find this analysis useful, please support me with your likes and comments.
If you have another analysis at this pair, please share in comments.
Good luck.

TTD - Swing up opportunityTTD had a strong dip of nearly 18% over the last 4 days, retracing 62% of the recent swing up and looks to be finding support as it closed with a pin bar candle. The odds that it is done pulling back is high now that we are also seeing a potential bullish divergence between price and RSI.
Long if it is able to rise above the hi of this pin bar (@ 840.30) with initial stop loss slightly below the pin bar low @ 796.
Looking to scale out partially at least as it approaches the last high at 972 and protect the rest of the position with trailing stops
Disclaimer: This is just my own analysis and opinion for discussion and is not a trade advice. Kindly do your own due diligence and trade according to your own risk tolerance. Thank you. Feel free to give me your thoughts ! :)


GOLD US SESSION 15M SCALPRules for Bullish/Bearish Reversal
1 - Pin Bar - Hammer
2 - Stop Hunt Wick
3 - Low Bear Engulfment
#3 Lowest Bear Candle
Break High for Reversal
Break Low for Continuation
#3 Highest Bull Candle
Break High for Continuation
Break Low for Reversal


Long EURGBPRecently EURGBP ranged in H4 rectangle pattern and falls to below of this and makes a bullish pinbar candle.we can expect some upside movement from this area!

LTCUSD Trade Opportunity (Cryptocurrency)Next entry is at 109.77 for a Buy. Wait for the candle to close above 109.77. Next watch for a buy signal at 109.77. Watch for a bullish pin bar. Or a bullish engulfing bar. Enter at a "higher low."

CADCHFDaily pin bar On the bottom of the channel and demand zone as well.
I am expecting the market eventually to go up where the target is shown.
Thanks for taking the time and reading my chart.

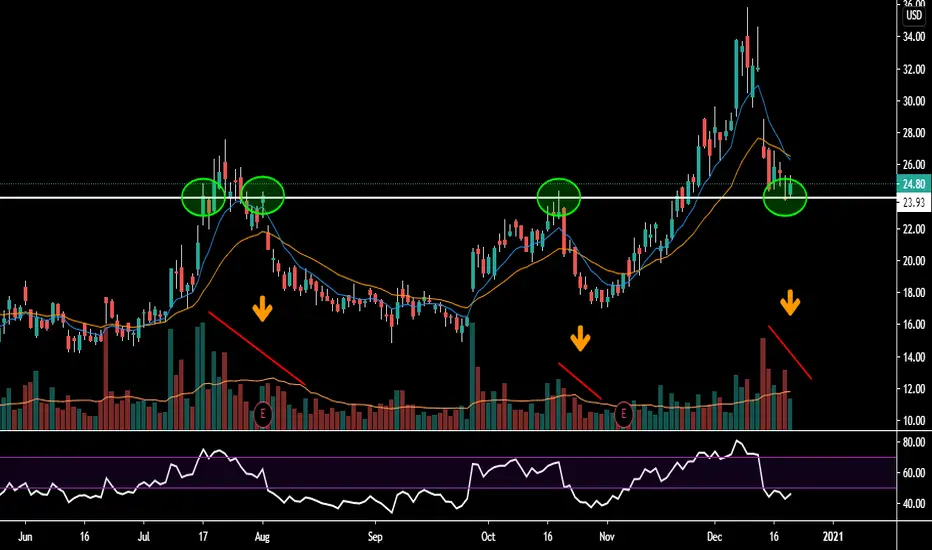
SPCE Possible ReversalSPCE showing signs of a possible reversal. Gathering/consolidating support along a previous significant resistance level. Volume has typically tapered lower during downtrend which we currently see. High risk play entering right now, I'd like to see more confirmation first before entering (RSI divergence along lows or break of pinbar printed on 11/30.
Heavy eyes on the 1/15/21 $25c and $30c. Volume seems to be focused there.
Leave a comment to discuss!!!