CAD/JPY on Christmas people :)The graph is very very slow but we got that short position. Slowly but profitable!
Pin Bar

ETHUSD PRICE ACTION PIN BAR TRADING STRATEGYPin Bars
This price action strategy will focus entirely on a price pattern called pin bars. This candle is simply the price hitting a certain level and being “rejected” from it. This bar has a long tail on it with a small body.
There are different types of characteristics for a particular pin bar. For instance, the long end of the candle is the wick, while the small end (the opposite side of the body) is called the nose. Most agree the long tail, or “wick,” will be at least two-thirds the total length of the pin bar itself. The other part of the pin bar will naturally be, at the most, one-third of the candle. The open price of the candle and the close should be relatively the same price. This forms the ‘Body.’
To confirm a pin bar, you must wait for the candle to close. Just because the current candle “looks” like a pin bar, does not necessarily mean it is. in the example above, the price movement could have continued upward and closed at the top of the candle. In turn, it would not be considered a pin bar.
Basic Guidelines:
Timeframe - ANY
Market - ANY
Indicators - NONE
OTHER - Trend lines, horizontal lines, support resistance lines (anything to help you find these areas).
Step 1: Find a Pin Bar On Your Chart.
*Note This is a stock price action strategy, and a forex price action strategy. I will use a currency pair as an example. Price action charts are with any market and timeframe.
First, identify a pin bar that has formed.
Step 2: Look for Past Price Action to Determine Why The Pin Bar Formed.
Why did the reversal suddenly hit a price, and then continue back to the upside?
Let’s zoom out a bit on a daily chart. We'll figure out if we can see anything that explains what happened.
Note** you can either look at the current time frame you are on, in this case, a 1-hour time period. Or you can bump up one or two periods to gather information.
Resistance in the past can mean support in the future. What happened is the price hit this level but failed to break through it.
Since the long bullish wick formed, we decide it is time to enter this trade based on what we learned from the prior days.
This is what Price Action is all about. No two trades are the same. However, we can take what we've learned from the past. Then make the best judgment as to where the price is going in the future.
You are essentially like a detective when you trade price action. The point is to gather many pieces of evidence to back up your conclusion. You are trading with confluence. Sometimes simple is best. Study the charts and form an educated conclusion as to where the price will go.
Step 3: Trade entry
You just enter the trade 2-3 pips from the break of the nose of the pin bar.
Step 4: Stop loss
Place the stop loss 3-5 pips away from the wick. The end of the wick will be a support area. So if this is broken the trend may continue downward. Which is why you place your stop 3-5 pips away from this.
Step 5: Exit Strategy
Your exit strategy is when you hit the first level of support or resistance on your chart. As you can see, the price hit a point then stalled out. Once we see the price action stalling out, we exit the trade immediately.
Conclusion - Price Action Pin Bar Strategy
Price action is another fundamental element to learn when trading the market. There are thousands of strategies you can use with price action. It is important to find something that works for you.
These pin bars are hard to miss. They are relatively accurate when you learn why a pin bar formed. Pin bar candles are shown in any time frame. The rule of thumb is, the higher the time frame, the stronger the signals. But that does not mean that this will not work on a five-minute time frame.
Do not trade every pin bar you see that forms. Gather up key information from the charts. Then form the best conclusion to determine if you should enter the trade based on the rules.

GBPUSD Wave AnalysisGBP made some really interesting moves the last two weeks. Anybody who is familiar with the Elliott wave Theory was expecting the final push to the upside.
We now have finished the 5-Wave structure to the upside, which took place since September. The Brexit is pretty clear right now and UK will face some macroeconomic difficulties.
From the technical perspective we will have some very interesting setups for the next Weeks/Months.
Market finished 5-Wave push to the upside
This week we got the immediate retrace and selloff which was also 5-Waved and the beginning of something big.
Across all GBP Pairs we get some nice daily/weekly sell signals
I am waiting for the retrace to occur to get another sell setup
IF the months closes below 1.2900 we get a picture perfect Pinbar candlestick. This would indicate a much bigger selloff toward new lows on the weekly and monthly chart.
Let's watch the 4H/1H Chart to get a good entry around the regular fibonacci lvls.
Follow us to receive future updates on this and other pairs. Learn how to apply the Elliott wave Theory to the markets!

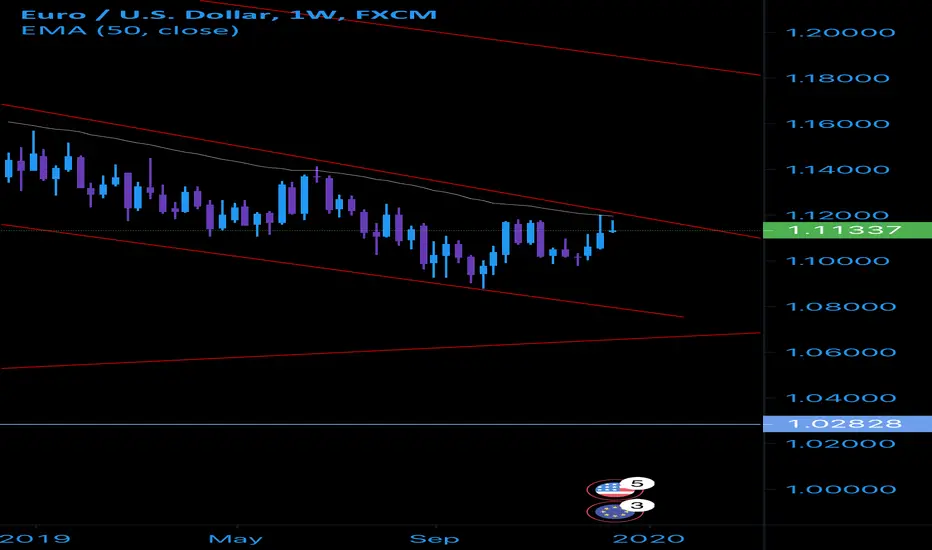
EURUSD Eurusd SELL. In my opinion*** 3 confirmations
1- pinbar
Other 2..
Hint* support and smaller time frame
$WABI has very possible rapidly reversed local trendAt least we can touch 0.618 by Fibo. But this on daily pin-bar 06.12 tells me that pressure from buyers exists.

S&P Topped out - Heading to $1,100Elliot wave analysis top of 5th wave of 5th wave. Bearish pin bar adds to confirmation. Cycle lines added to project correction over next 10 years. Have fun:)


BTCUSD ATTENCION FOR A BADASS BOUNCE POSSIBILITYHi guys and gerls
Just to warn of a possible change in a game plan
on a 3D chart $BTC esteblished a beautiful pin bar , which now price came down to retest
bears are strong because price been pushed below the trend line uet the horizontal resistance of 7465
bull have got supporting PIN on a 3D
I closed my short position from 7300 at 7140, not gonna play gambling
I still think 6860 could provide a great SFP opportunity but price might as well bounce from here
The first long target would for me be 8100 where the horizontal resistance and the descending trend line coincide
Otherwise I'm just a bulltard, why do you listen to me?


GBPJPY Bounced at SupportSTRATEGY: S&R Trading Strategy
(1247)
Analysis
1D: Price still moving inside a well-defined range
1H: Looking at 1H TF, a Hammer was created and it was followed by Bullish Engulfing which act as our ETs
See previous post for more details:
Action Item(s)
- Scale-in as necessary
Note: This post is for my personal journal/personal opinion only. Please trade at your own risk

Bitcoin Bullish Pin BarGood afternoon ladies and gents, update on btc. Sadly enough if btc fails then so will the rest of the alt coins. It is absurd how fast we hit that 6800 support. I wasn't expecting us to hit it so quickly. You had 1 hour bullish divergence play out last night and you tested the .382 at 7700 before rejecting that to lower prices. That is absolutely disgusting. But what could we expect from here. I am currently accumulating btc throughout critical supports between 6150 and 7400, that being said this is meant for my long term trade set up and you still need a plan for when hell breaks loose. But I am not in a short-mid term trade set up.
I would like to state that you did close a price reversal candle known as the Bullish Pin Bar. What you want is follow through price action. As of now we are rejecting that $7400 critical support. If we can't break above that, then we will just ladder ourselves back down to 6800 once again and if you break that, then see you at 6150ish at that real critical support during the bear market of 2018. That being said, if btc manages to break that, then we'd be looking for us to break 7700 again or test the common retrace zones between $8,213 and $9,102. From this range, you'd want to see us reverse price action once again either creating a higher low than our bottom or a lower low with 4 hour and DAILY bullish divergence or convergence. The daily in this trend would honestly be our best bet.
Measured move of the descending triangle break out remains the same inside the teal box range which we have hit, but the real measured move is at $6,150ish. So, I am not going to be going over alt coins because all have dumped so poorly compared to btc and because of btc. Although, once btc reverses its price action, then we can expect a better chance for those alt coins trade set ups.
Join our Free Telegram Channel: t.me
We are a new community growing day by day in hopes to accomplish a trading premium group by December 1st of 2019.
Subscription prices are $99 a month, $499 for 6 months and $999 for a year. We give the best possible technical analysis with a touch of art work to it hence the name "ChArtWorks" ;). "We remove the hard work from your end and just give you the trade set ups along with education." Don't let the prices scare you, we give TA free too! But the most benefits are in the Elite Channel.
50% off all Contracts for Military Veterans and Active Duty Service Members, just provide your DD214 or Military ID for proof of Status. Discharge Type is completely confidential and does not need to be shared. I am a Marine Vet myself and I will not share any information regarding Military status with anyone else.
Feeling generous and wanting to show us love and support? Donation addresses are listed below
$Usdc: 0xe3b95b4575d6456D090ac24Ad4DC8D46C9c97b2C
$Bitcoin: 3Jg9ng234aJdgz3zzt3iCyeb124eAmKs5N
$Ethereum: 0xd251Cc3b78e92191B5dEC4E0D2f2acDCa5B33599
$Litecoin: MRHupJeTegPM2a8AJewC3B1oqq7Mpjr1MK
$Xrp: rw2ciyaNshpHe7bCHo4bRWq6pqqynnWKQg
Tag: 2183371567
$Bat: 0x9b95E0Bd4556dbb0b407B32f43B923607b896F48
$ChainLink: 0x559d92B08D72Fe20B0aF063ebE59ead6612c2b00
$Dash: Xq5kCnMknHrknC2ipw1JGuRcdbDtbTSqWU
$Beam: 553e2b176e611674559f92b8fa10f5d129bd80acd14fb5f8d6e387ab4f0b281144
$XMR: 4DSQMNzzq46N1z2pZWAVdeA6JvUL9TCB2bnBiA3ZzoqEdYJnMydt5akCa3vtmapeDsbVKGPFdNkzqTcJS8M8oyK7WGj2kh3ajCzSUSAQTr

USDCAD DAILY SHORT, bearish pin bar and downtrend line rejectedUSDCAD has shown brief consolidation at the long term downtrend line before providing a bearish pin bar which has lead us to the trade setup where we anticipate it reaching a previous floor that has been bounced up from twice.
SL - 1.32636
TP - 1.30558

EUR AUD AB=CD Point C Pin Bar rejectionPrice has formed a nice AB=CD pattern.
It has rejected the 61.8 level at point C.
Take profit could be as much a 435 pips. A tight entry could a very nice risk reward. There for Risk reward of 13.5 or 4.4.
A nice rejection pin bar has formed, so a stop placed a bit beyond that is my preference.
Currently I can't see any sign of divergence.
I have seen a trendline breakout when using the smaller time frame.
The rejection pin bar sits nicely on the 61.8 level and the 1.62500. There is some structure there, but there is more on the 1.6300 - which may be the safer location for a stop loss..
Rejection of horizontal (blue) ascending resistance trendline.

USDMXN Entry 19.46409 Stop Loss 19.58471 Target Price 19.01639USDMXN Pin Bar Candlestick (3.33R) (R-Multiple = 3.33)

USDJPY SHORT OVERDown trend form weekly level last week. I'm try to short +-50 pips below 109.00 Level.
Trade base on Technical:
-fib retracement 61,80%
-h4 pin bar
-MA Cross

USDCAD False Breakout?
STRATEGY: False Breakout Strategy/Counter-Trend
Long Term Trend Time Frame: 1D/4H
Focus Time Frame: 1H
Market Condition 1D:
Short Term: Downtrend (based on 100ema)
Long Term: Sideways
Market Condition 1H:
Short Term: Sideways
Long Term: Uptrend (based on 100ema)
Area of Value (AOV)
Resistance: 1.32915 - 1.33813
Support: 1.31118-1.30205
Entry Trigger:
1H: Bearish Engulfing
Entry Price (EP): 1.32216
Stop Loss (SL): 1.32426
Take Profit (TP): 1.31234
RRR: 4.68
Analysis:
1H: Price boke above minor resistance but immediately followed by bearish engulfing. Found support at descending trendline, however, price seems struggling reaching new high (pin bar was also formed rejecting higher price). These could be a sign of False Breakout.
NOTE: This post is for my reference/journal purposes only. Trade at your own risk.

EURCAD Support & Resistance TradingSTRATEGY: Support/Resistance Trading Strategy
Focus Time Frame: 1H
Long Term Trend Time Frame: 1D/4H
Market Condition: Ranging
Area of Value (AOV): Resistance (Price at Resistance Zone) 1.47387 - 1.46936
Entry Trigger:
1H: Bearish Pin Bar
4H: Bearish Engulfing
Entry Price (EP): 1.46725
Stop Loss (SL): 1.47432
Take Profit (TP): 1.44753 (2.79R)
Analysis:
EURCAD is currently at a ranging market condition as we see clearly on the chart. Looking on the 4H Time frame, we can see that price rejected the Resistance Zone with Bearish engulfing. On 1H Time Frame, the zone got rejected with 2 bearish Pin Bars. Prior to these, we can see that the price approached the Resistance Zone with High Momentum. This usual type of move approaching either Support or Resistance Zone usually indicates trend reversal.
OANDA:EURCAD
DISCLAIMER: This post is for my reference/journal purposes only. Trade at your own risk.

NZDUSD : BEAR OR BULL ?NZD at a decision point or is it USD weakness ?
This pair is registering at the opposite ends of the daily strength and weakness table which could present some trend opportunities going forward.
A close below the previous daily candle could show a break of support with short setups. A close at the present level then PA to the upside with a close above 0.6490 could resume speculative buying to push up for a higher selling position around 0.6900.


USDZAR 0.618 and 4hr shooting star combination shortThe bullish bat worked fantastically!
Now the 2 0.618 retracements are basically both at the 15.06 spot,
which will be a good combination short to focus on!
A sell limit @ 15.06,
Out: 15.1400
1ST kick: 14.9800
TP2: 14.7500
Let's see how it goes yo!
