GOLD SHORT!Hey Traders,
We were pretty busy recently working on our new YouTube channel, so apologies for not being active for a while.
Gold produced a lovely textbook bearish pinbar confirmed by a high volume. It is also a sell zone with a huge psychological number 1350 + monthly resistance +weekly angled resistance+ daily bearish divergence. Therefore is it our hot spot. The more confluences the higher probability for us to make some money.
What is your bias on this market?
Happy Trading!
Pin Bar

EUR/JPY has the potential to make a H&S patternEUR/JPY has the potential to make a Head & Shoulders pattern.

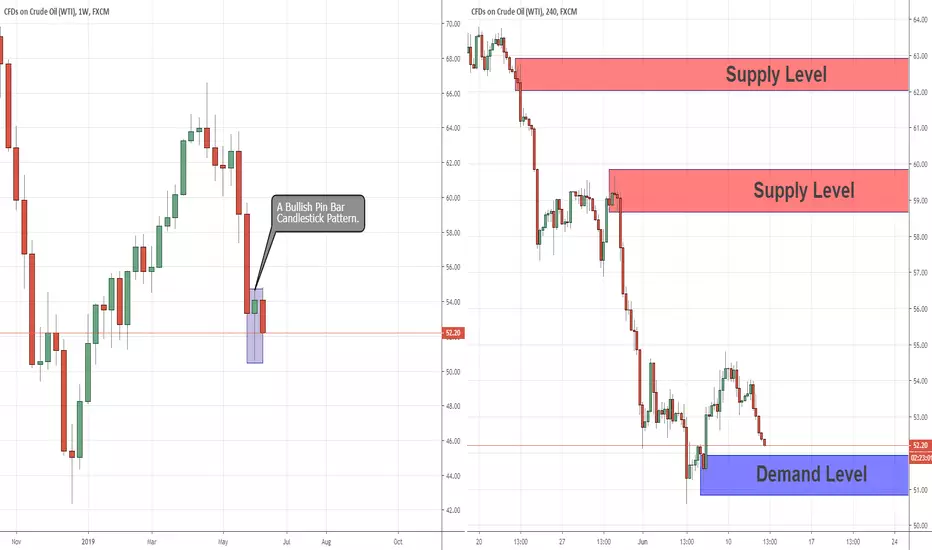
How Far could this Technical Correction move, before The Long TeThe last USOIL weekly candle formed a bullish pin bar pattern following a closure.
The Pin Bar candlestick pattern is one of the most reliable and powerful candlesticks patterns for technical Forex analysis. If this pattern is found near a support or resistance key level, it is then a reliable indication for a reversal pattern.
Although the last week candle ended as a bullish pin bar candlestick pattern, zooming out for the bigger picture. it is clear that the long term momentum in USOIL price remains bearish.
It seems that for the long term, any upward movement of the price will be considered as a technical correction, regardless of the price continuing a bearish momentum.
First, it will move upward to collect unfiled orders from the supply above, which we can see on the 4H chart, and maybe even from the supply at the top.
On the 4H timeframe – A fresh demand zone located just below 52ish, if the price touches this demand before reaching the supply above, it will be great timing to open for a buy position.
The supplies above will be the first target and the one at the top is the final target.
TECHNICAL ANALYSIS OF NEOUSDT CRYPTOCURRENCY PAIR
Third week of February has seen the biggest buying in Binance history for the pair. Bearish pin formed and was later broken to the upside.
Price action of the last ten weeks is signaling break of important 13.800 price level.
NEO seems to be a good investment opportunity and 13.800 is a good price to buy. Margin trading should be avoided. Even if the mentioned signals don’t work out, the next idea is just to hold NEO.
If bull trend develops reaction around 25 level is expected. One option would be to take some profits out.
Next (major) level is 40 and price reaching that level means having nice profit. Maybe holding on to some NEO after that for some wilder ideas is not so bad.
Here is the link for fundamental research.
neo.org
Picture tells more than thousand words.
Enjoy.


Raymond sell [pinbar]Can see downtrend after pin bar at
key resistance.
sell below 847 sl 857
tgt 832-819

EURUSD 0.618 and shooting star combination shortDXY has already pulled back to its 0.618 and 4hr demand zone combination spot,
and here we got this 4hr reversal sign for EURUSD.
I would love to take this shooting star breakdown short!
If it makes new high before broke 1.1205, this trade will be cancelled!
Let's see how it goes yo!


EURJPY Heavy Divergence Between Price and Momentum...Analysis
-EURJPY looking bullish after showing signs of reversal. Sellers pushed down into support but buyers bought it back up before the daily candle close.
-The price action resulted in a very clean pinbar setup at support which is a bullish sign.
-On the 1H time frame, price looking to break the trendline to the upside.
-There is also strong bullish MACD divergence on the 1H time frame following a head and shoulders pattern which further eludes to price possibly moving higher in the coming days.
-The reward/risk is good for an entry on the break of the trendline (given the distance between daily S/R levels)
*Trade safe and at your own discretion!*

USDJPY's Stop and Reverse Setup...Analysis
-USDJPY looking bullish after showing signs of reversal. Sellers pushed down into support but buyers bought it back up before the daily candle close.
-The price action resulted in a pinbar setup at support which is a bullish sign.
-On the 1H time frame, price looking to break the trendline to the upside.
-There is also strong bullish MACD divergence on the 1H time frame following a double bottom pattern which further eludes to price possibly moving higher in the coming days.
-The reward/risk is good for an entry on the break of the trendline (given the distance between daily S/R levels)
*Trade safe and at your own discretion!*

AUDUSD Momentum Fading (Upside Ahead)Analysis
-AUDUSD looking bullish and showing signs of a potential reversal following days of consolidation.
-The price action in the consolidation resulted in a daily pinbar at support which is a bullish sign.
-On the 1H time frame, price is making equal lows and looking to break the trendline to the upside.
-There is also bullish MACD divergence on the 1H time frame which further eludes to price possibly moving higher following the equal lows.
-The reward/risk is good for the setup (given the distance between daily S/R levels)
*Trade Safe and at your own discretion!*

GBP/JPY: Contrarian PerspectiveSo far, GJ has been down quite strong, but I has a different perspective:
1. GU still is in the uptrend, so is UJ (but it is coming to the end).
2. GJ carved pibars at resistance at 143.00
So I'll give it a try and see what happens.

AUDUSD 4h shortStrategy: pinscher
Signal: 2 bar pin
Order: entry point was @0.69805 but as I got in very late, got a much better price, a bit risky but met all my rules.

EURUSD 1D; possible Elliott interpretation of a down trend [/url
In this interpretation important (shallow) WXY correction is already over and down trend is continuing (that is main thing). Looking for shorts seems reasonable. Recent pinbar is massive and on important spot. Support becomes resistance.
Picture tells more than a thousand words.
Enjoy


GBP/CHF: Hindsight For Reversal?GBP/CHF currently form a 3 pinbars together, show how much effort it wants to go down.
I already have a Short at 1.32946, and the profit is huge, because for me this maybe the beginning of a huge downtrend, follow by thousands pips.
Wish you trade safe and sound!

Have a look at GNC weekly bullish set-up, as my wife said so!GNC's endless slumping is kinda hard to understand for me, and I usually get away from this kind of stocks.
A profitable healthcare/retail drug store with only 3+ P/E and a non-stop downtrend from $60 to $2.5 a share in such a bull market!?
Hard to believe, but anyone who tried to pick the bottom based on those fundamental numbers worked horribly so far.
Let's not pay too much attention on its fundamentals, let's go back to the chart!
Here we got a weekly bullish butterfly with a hammer, not a bad set-up,
and most important of all, my wife said that she has a feeling that it would be a better investment than buying the lottery!
So why not, I'll get some position here with very little risk there to put the out below 1.90.
Maybe 500 shares with $300 risk and see how it goes!
Happy wife, happy life yo!

Short GoldHi there,
break through the resistance, then retested as an support level.
There are formed a eveningstar (4H) and at dayli close perhaps a pin bar.
The candelstick pattern ist also formed at the new support level.
S/L: 1281,31
TP: about 1253


Sell USDCHF (Daily)in daily chart:
Triple top
overbought in RSI indicator
touching weekly trend line
Low2 is lower than low1
Resistance level at 1.011 - 1.013
> Sell
Entry : 1.0130
-Stop : 1.0150 (35 pips)
-TP1- : 1.0005 (125 pips)
-TP2- : 0.9805 (325 pips)
in 1H chart:
Bearish pin bar candle
Overbought in RSI indicator
Regular divergence
Weekly chart:

US30 - SHORT(shooting Star(Bearish pin bar))Entry was at 50% if it comes again you can reenter
this is a swing trade on the daily time frame
3 seperate tps you may secure partials at each level
or 3 separate positions 3 tps
this is a trade idea take at your own risk.

USD/CAD: Pin bar at Resistance (Short-term)USD/CAD currently form a pin bar at near resistance 1.3400.
A sell here with TP at 1.3300.
5min chart. Can sell here.
