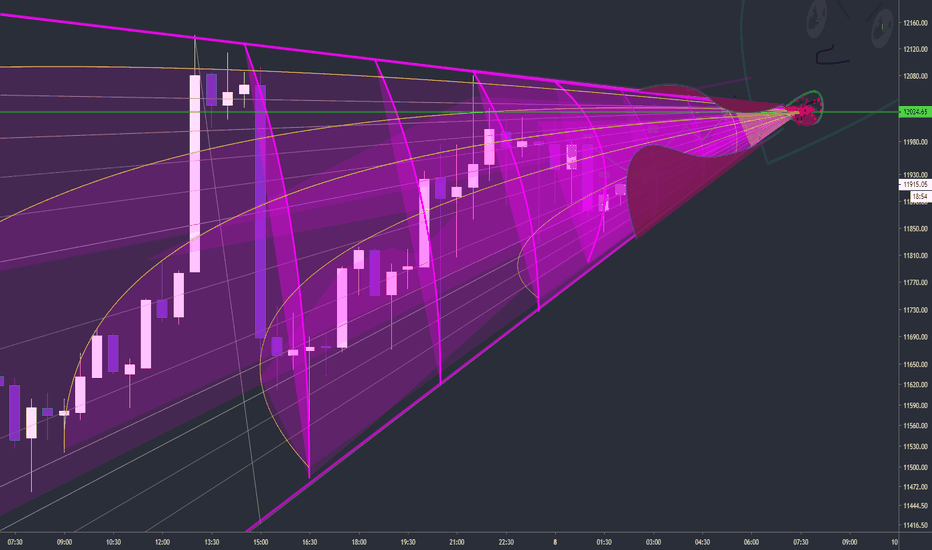
An Easy Method for Identifying Wave and Cycle Endings! :)Hello, you don’t need to discover anything else to make money in this market. Simply by identifying peaks and valleys at the same level, which align in terms of numbers, degrees, and angles, you can easily earn a lot of money. Don’t get caught up in vague and useless information, my friends. Much respect, Ehsan :)
Pink
$EMBI obvious looking reversal in 1 hr chart. Going LONG!!After big sell offs, we can see a reversal in the 1hr chart. Volume coming, ma crossings, a lot of catalysts in future, lower lows and higher highs after a long consolidation. Sabby investing big here. I see at least 0.2+(20 cents) by end of Jan.
Pretty Regression Band BYOC #OTCMarkets #OTC #PinkMarket $BYOCBYOC has hit a TD Seq9 in red on this 6hr chart , it did this recently as you can see on the chart and had a nice rise within that regression band (( in blue and pink ) . Our rsi here is touching the blue line at 34.00 . This seems like a fairly good one - with a resistance above us at .001743 and the price now at .001050 it could be going there . The Macd is harder to read here but all in all it looks ok .
Be aware that this is OTC penny stock Pink Markets and it's extremely volatile . Please DYOR - do your own research .
100% Copper ? XFLS - Xfuels #OTCMarkets #PinkMarket #OTC Possibly going to a penny ? As you can see XFLS ( or Xfuels ) is about a third of a penny right now at .0034 .Also we are inside that colorful Fib Circle indicator ! We are in the purple band of the circle , as you can see . It's a bullish band that should lead us up . But how high ? Possibly to a penny or higher . You see the Ichimoku cloud is above us but there is a strong resistance just under a penny at .009 . It's very possible to go there and wick up to 1 penny - which is right near that blue X on the chart . Maybe we get turned back at 1 penny and don't go through the cloud . But what if we go through the cloud ? It's possible to see 2 cents , 3 cents , 4 cents . It's hard to say as Penny Stocks are very volatile . Please be careful and DYOR - do your own research . But this looks pretty good to go up in the near future .
Penny Stock Indecision ! BRLL #otcpink #pennystocksAs you can see BRLL one hour chart rsi has hit 33 and this almost always means some nice upside will be coming - perhaps even 50% or more . But .... there's a problem . July is the one month I'm a bit cautious to but penny stocks - mid summer is notoriously dumpy - plus I'm not losing anything by sitting it out .Anyway it's also hit a TDSeq9 in red and should be good for at least 10% - I'll just be upset if it shoots up because I'm not jumping back into penny stocks til mid or late August !
#PinkBtc chart analysis for non premium members $pink $btcMany of non premium members wanted me to share my opinion on pink
as quite a few channels shared a long call for pink/btc pair.
Well for now i clearly see it forming a bearish structure and would advice not to enter the trade for now.


