Median Lines and Finding the Right Path When it comes to learning about markets and trading, finding the right path and committing to it is the hardest part. The right path has little to do with any technical analysis method. It has to do with structuring our mental framework so that we fundamentally change how we experience markets, trading, and loss.
In the video, I show some Median Line and Action/Reaction work but this work is useless by itself. No tool is good or bad, they are just tools we use to comprehend markets. The problem arises when the tools start using us and we think there is some kind of magic to them.
The essence of our strategy should be to structure our methods and mindset towards functionality. The journey we should commit to is one marked by fostering accountability and responsibility in all our actions. The swing trade Idea I show, takes method and structures it into function.
Shane
Pitchforks

Gold's last leg toward 2308 +/-. 30/May/24XAUUSD probably trending down toward wave (b) yellow of expanding flat (a)(b)(c)(yellow) in wave in b (blue circled). Probably a "good news" for gold on this coming Friday Core PCE Price Index.

EURO & Olympic games are close / CHILIZ can reach $0.3 level! BINANCE:CHZUSDT
COINBASE:CHZUSD
Hello Traders
Chiliz is one of my suggestions for the altcoin market.
You can clearly see long-term accumulation of the price and the break in pitch-fork structure strictly.
Highly potential for the alt rally season.
The best strategy for altcoins is to allocate a certain percentage of assets (for example, 10% of the total portfolio) to buy potential altcoins.🎲
As the Olympics and Euro games approach, the demand for betting on matches and sports tokens will increase.

support levelThe Dow seems to be at a support level, if the support holds, the uptrend is likely to continue

📉Think Outside the Box BTC!📈BINANCE:BTCUSDT
COINBASE:BTCUSD
Hello Dear Traders.
🔴The market has reached the end of its suffering range and our team's holiday break is nearing its end.
⚡️ In this post I will track the BTCUSDT movements as long as it stays inside the Box.
🔴The past few weeks, the pressure of market volatility was very high and we needed a break.
We will review the market again from today.
Please share the analysis posts to support and give us energy.

further price reductionIt seems that due to the maintenance of conditions by the Federal Reserve, the possibility of further price reduction is possible

BTCUSD morning updateI'm looking for key support of 65541.11 to hold, and for a daily higher high to complete an impulse wave off 56547.64 low.
The regular flat that ended at 56547.64 seems too shallow for a wave 4 or a wave 2 of higher degree. If we continue to impulse higher, my primary bullish count will have this be a 5th wave extension, to complete a primary wave 3 around 125000. Bulls immediate target is the median line of the pitchfork.

Bullish Continuation LikelyBack above the daily Cloud for COIN with a successful Falling Wedge breakout. Recent US regulatory clarity on ETH ETFs also positive news as COIN will be the custodian.

NQ1! morning updateWith NQ1! reaching higher highs on the monthly, it adds to the wave ((5)) impulse off the October 2022 low. It suggests we need to finish a smaller impulse, have a correction, and then one final impulse to reach a top for the market. Price target is the median line of the pitchfork, and bulls are very likely to get it at some point.
In summary, I have NQ1! in wave 5 of (3) of ((5)), with a projected top to happen in 2025, likely north of 22000.

ETHUSD/ETHBTC afternoon updateVery intriguing bullish setup for ETHUSD and ETHBTC. ETHUSD holding support at .618 Fibonacci drawn from pivots at 4093.88 and 2100. There are different bullish counts that can be drawn from 879.80 low, will know more if price gets above 4093.88 and how price moves above that resistance.
ETHUSD move may be magnified by bullish ETHBTC setup, if low of 0.04474 can hold off .618 Fibonacci drawn from 0.08864 and 0.01614.
Immediate bullish targets on both charts would be the median lines of each pitchfork.

Tesla's kangaroo still hopping. 20/May/24TSLA kangaroo still boxing/ hopping inside the ring (triangle) since end of 2021. Strong support if there was a pullback toward 186 +/-. Which is confluence zone of 1) POC of Volume Profile (red horizontal line) 2) 233 weekly EMA (white MA Line) 3) Pitchfork lower channel (blue).

📈Quick BBSUDT 2H Long Setup📉BINANCE:BBUSDT
BINANCE:BBUSD
📈Quick BBUDT 2H Long Setup📈
⚡️long position with mid-risk status.⚡️
TP 1-2-3-4 and SL are on the chart.
The Alternate scenario: If the price stabilize below the Bollinger midline, the setup will be cancelled
⚠️Don't forget to de-risk your positions.⚠️

Schiff show: VIX gap filled.Volatility is near record lows. Low VIX is often associated with market tops. 0day options have been pushing VIX down further than normal though. Judging from the many solid candles on the monthly chart, the month often closes near tops and bottoms. So there should be plenty of time. The writing is on the wall. But it would not be surprising to see stock prices remain elevated, with correspondingly low VIX, until June 3 or later.
Caption: Using the auto pitchfork indicator and choosing Schiff pitchfork reveals alignment with the gap.

📈Bitcoin on its way to $80K? / Serial analysis on BTC📉BINANCE:BTCUSDT
COINBASE:BTCUSD
Hello dear traders.
⚡️ In this post I will track the BTCUSDT movements from 11 Apr - 18 Apr.
📈 What to Expect Next?
💡The price of Bitcoin is in a vital situation. As long as the price is above the BB midline, the bullish scenario is quite valid.
The bullish scenario targets are on the price chart.
🔑Key Insights:
The level of $72,784 is the optimal level for risk-freeing long positions.
The risk of this position is lower in the upward direction due to the price trend. But in the case of falling prices, a possible scenario is drawn in the chart.
📉On the other hand, if the price fails to receive the necessary support at the mentioned level, the bearish scenario will be activated around the target of $69,400.
A price stabilization below the middle line of the Bollinger Band can push the price down to pullback to the pitchfork.
◀️Reverse scenario:
🔴Major and hidden divergences are also plotted in the chart. The $67000 level is Bitcoin's support in a bearish scenario.
🔴The main divergence is related to the OBV indicator, which reinforces the bearish scenario.
On the other hand, the hidden divergence is related to the RSI indicator, which reinforces the bullish scenario.
🔴The failure of specified support level will bring Bitcoin down to around $65,100.
✅Entering a bearish or bullish scenario with the help of price behavior above or below the 4-hour Bollinger midline can be the most optimal strategy in the current market conditions.

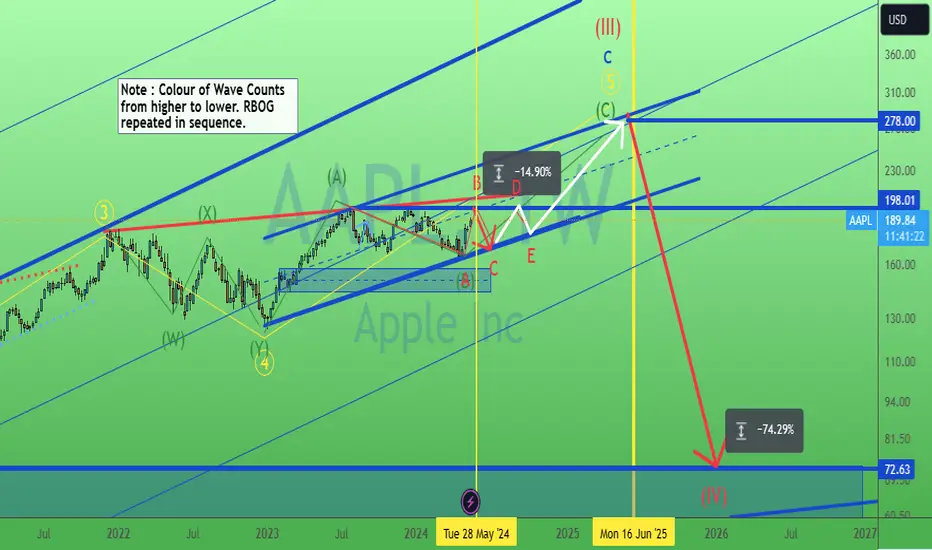
Apple still not out of wood (triangle). 17/May/24AAPL still forming a triangle pattern. Probably a -14.90% drop by end of May ( so sell in May still working") or early June.
Hartalega dynamic cycle analysis. 15/May/24Hartalega still trending up to cycle high 4 ( purple ) which is only due at end of year by average (near yellow vertical dotted line) . So how "hi" can it goes?!

gold moon this summer?It was said in chat 8% rise in gold predicted this year. I drew these lines on in Feb, and although $3500 by August sounds a lot, the chart looks ok.
Again, just a bit of fun for the scrapbook.

possibility of a fallIt seems that due to the news, the upward trend has lost its strength, if the resistance is maintained, there is a possibility of a fall

Gold's intraday path toward 2340 +/-. 14/May/24Gold probably is forming an expanding ending diagonal / wedge pattern now while waiting for US CPI on 15 / May/ 24.

Gold's last path toward 2380 +/-. 13/May/24XAUUSD's last roadmap toward 2390 +/-. before 2150 +/-. Price currently at the last leg wave (C)(green) of expanding flat (A)(B)(C) pattern in wave B (Yellow Circled). Price/Market Structure Probably tell us somethings "Big" gonna happen on this 15/May/24 US CPI data...

uptrendIt seems that the recent upward movement is a powerful movement and has high goals, if the support is maintained, the continuation of the upward trend is likely

possibility of correctionIt seems that the previous upward movement was a bit emotional, if the resistance is maintained, there is a possibility of correction

Slapping upper channel resistancePrice has reached upper resistance with MACD divergence.
If price breaks the fast MA and most recent pivot low -- taking a short to at least the median line.
