📈Bitcoin price movement near 40K level📉BINANCE:BTCUSDT
COINBASE:BTCUSD
Hello dear traders.
After receiving support around the level of 38-39 thousand dollars, Bitcoin now has two possible scenarios in front of it.
If the price fails to stabilize in the specified area, the bearish scenario will be activated. But according to the divergence of the indicated indicators in the chart, Bitcoin can advance towards $41,500 to $42,500 after stabilizing above the yellow zone.
✌💥If you are satisfied with my analytical content, please share my ideas💥✌
✍🐱👤Otherwise, make sure you leave comments and let me know what you think.🐱👤✍
🍾Thank you for your support. I hope you will gain profit by following my analyses.🍾
Pitchforks

IBKR Weekly Technical AnalysisIBKR Weekly - No RECOMMENDATION or ADVICE Status / EDUCATIONAL only - Support, Resistance, Pitchfork, Confluence, Clusters, Trend Lines, ABCD Pattern, Fibonacci Extensions - Hope it Helps, Good Luck
DISCLAIMER - This communication is not trading or investment advice, recommendation or solicitation to buy, sell or hold any investment product is provided for informational, educational and research purposes only. All illustrations, forecasts or hypothetical data are for illustrative purposes only. The author or persons involved in the conception, production and distribution of this material cannot be held responsible for transactions or any financial loss or damages resulting directly or indirectly from the use or application of any concepts or information contained in or derived from this material. Past performance is not indicative of future results. Any person who chooses to use this information as a basis for their trading assumes all the liability and risk for themselves.

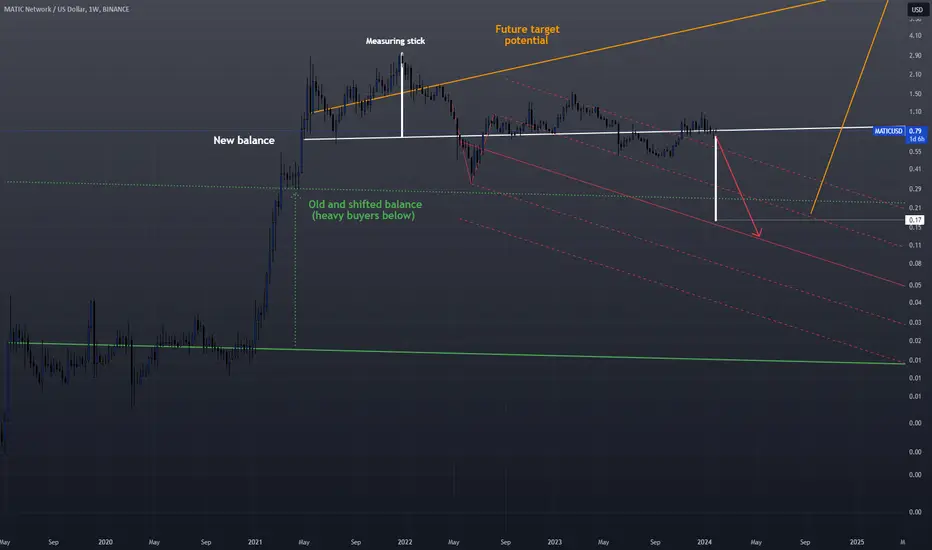
MATIC may contract by 80% before next bullish rallyMATIC may still be overpriced and needs a bigger correction before the heavy buyers step in. In my attempt to gauge the size of that correction I have concluded that the price may drop to around 0.17 USD. Please note that this is weekly, logarithmic chart.
MSFT $560+ - Energy Point + Fib ConfluenceNASDAQ:MSFT
Microsoft is breaking out after putting in a base from November to early January.
Plotting a Modified Schiff fork, we see the base and breakout took place right after both passing and retesting the median line.
Adding Fibonacci extensions and a secondary fork, an energy point appears at the intersection of the ML-H, ML, and 1.0 Fibonacci extension.
It has already surpassed the previous all-time highs, put in a base, and broken through this base.
However, this idea is not perfect.
Ideally, the break-out would have taken place with heavier volume.
I'll be keeping an eye on volume going forward.
Another positive weekly candle with above average volume will really boost my confidence.
If everything goes as planned, we should see MSFT reach ~$560 by August 2024.
With a stop below the November-Jan base, we have 1:4 Risk/Reward ratio trade. (Screenshot below)
Long MSFT
Fat_Fat

AMD Weekly Technical AnalysisAMD Weekly - No RECOMMENDATION or ADVICE Status / EDUCATIONAL only - Support, Resistance, Trend Lines, Confluence, Cluster, Parallel Channels, Modify Schiff Pitchfork, Fibonacci Extension - Hope it Helps, Good Luck
DISCLAIMER - This communication is not trading or investment advice, recommendation or solicitation to buy, sell or hold any investment product is provided for informational, educational and research purposes only. All illustrations, forecasts or hypothetical data are for illustrative purposes only. The author or persons involved in the conception, production and distribution of this material cannot be held responsible for transactions or any financial loss or damages resulting directly or indirectly from the use or application of any concepts or information contained in or derived from this material. Past performance is not indicative of future results. Any person who chooses to use this information as a basis for their trading assumes all the liability and risk for themselves.

YPF SOCIEDAD ANONIMA in dayYPF SOCIEDAD ANONIMA I do not recommend buying stocks now. The market reaches the Fibonacci extension level and the highest level in pitfork

MACY'S Weekly Technical AnalysisM weekly - No RECOMMENDATION or ADVICE Status / EDUCATIONAL only - Support, Resistance, Trend Lines, Confluence, Cluster, Modified Schiff Pitchfork, Fibonacci Extension - Hope it Helps, Good Luck
DISCLAIMER - This communication is not trading or investment advice, recommendation or solicitation to buy, sell or hold any investment product is provided for informational, educational and research purposes only. All illustrations, forecasts or hypothetical data are for illustrative purposes only. The author or persons involved in the conception, production and distribution of this material cannot be held responsible for transactions or any financial loss or damages resulting directly or indirectly from the use or application of any concepts or information contained in or derived from this material. Past performance is not indicative of future results. Any person who chooses to use this information as a basis for their trading assumes all the liability and risk for themselves.

SILVER FUTURES Daily Technical AnalysisSI1! Daily - No RECOMMENDATION or ADVICE Status / EDUCATIONAL only - Support, Resistance, Trend Lines, Cluster, Confluence, Rectangles, Pitchfork, Modified Schiff Pitchfork, Fibonacci Extension - Hope it Helps, Good Luck
DISCLAIMER - This communication is not trading or investment advice, recommendation or solicitation to buy, sell or hold any investment product is provided for informational, educational and research purposes only. All illustrations, forecasts or hypothetical data are for illustrative purposes only. The author or persons involved in the conception, production and distribution of this material cannot be held responsible for transactions or any financial loss or damages resulting directly or indirectly from the use or application of any concepts or information contained in or derived from this material. Past performance is not indicative of future results. Any person who chooses to use this information as a basis for their trading assumes all the liability and risk for themselves.

INTEL Daily Technical AnalysisINTC Daily - No RECOMMENDATION or ADVICE Status / EDUCATIONAL only - Support, Resistance, Trend Lines, Cluster, Confluence, Pitchfork, Fibonacci Retracement, Gap - Hope it Helps, Good Luck
DISCLAIMER - This communication is not trading or investment advice, recommendation or solicitation to buy, sell or hold any investment product is provided for informational, educational and research purposes only. All illustrations, forecasts or hypothetical data are for illustrative purposes only. The author or persons involved in the conception, production and distribution of this material cannot be held responsible for transactions or any financial loss or damages resulting directly or indirectly from the use or application of any concepts or information contained in or derived from this material. Past performance is not indicative of future results. Any person who chooses to use this information as a basis for their trading assumes all the liability and risk for themselves.

S&P 500 Daily Technical AnalysisSP 500 Daily - No RECOMMENDATION or ADVICE Status / EDUCATIONAL only - Support, Resistance, Trend Lines , Parallel Channel, Cluster, Confluence, Pitchfork, Fibonacci Extension - Hope it Helps, Good Luck
DISCLAIMER - This communication is not trading or investment advice, recommendation or solicitation to buy, sell or hold any investment product is provided for informational, educational and research purposes only. All illustrations, forecasts or hypothetical data are for illustrative purposes only. The author or persons involved in the conception, production and distribution of this material cannot be held responsible for transactions or any financial loss or damages resulting directly or indirectly from the use or application of any concepts or information contained in or derived from this material. Past performance is not indicative of future results. Any person who chooses to use this information as a basis for their trading assumes all the liability and risk for themselves.

S&P 500 Daily Technical AnalysisES (SP 500) Daily - No RECOMMENDATION or ADVICE Status / EDUCATIONAL only - Support, Resistance, Trend Lines , Parallel Channel, Cluster, Confluence, Pitchfork, Fibonacci Retracement / Extension - Hope it Helps, Good Luck
Chart unchanged, just a refresh from July 2023, no update required.
DISCLAIMER - This communication is not trading or investment advice, recommendation or solicitation to buy, sell or hold any investment product is provided for informational, educational and research purposes only. All illustrations, forecasts or hypothetical data are for illustrative purposes only. The author or persons involved in the conception, production and distribution of this material cannot be held responsible for transactions or any financial loss or damages resulting directly or indirectly from the use or application of any concepts or information contained in or derived from this material. Past performance is not indicative of future results. Any person who chooses to use this information as a basis for their trading assumes all the liability and risk for themselves.

SPY Republishing my targets for my knowledge and learningBeen experimenting with various indicators and I try to keep it simple. The hardest part for me is to find a target using Ichimoku. I try to use and relearn Fib and pitchfork
My Target is 475.33 and my support is the Kijun support and you can see it clearly here which is 466.68!
LFG
Now to the hardest part. I think I have learnt enough but I realize that it is a continuous learning and it is never enough. If I were to have knocked the patterns outta window and if I were a guru it should show in my bank balance, no? Ironically no. This means I have to make this a habit and post regularly
Please let me know what you think so that we can all grow together

📈BTC.D analysis, ready to pullback📉CRYPTOCAP:BTC.D
Hello Traders, please check out my previous ideas.
As indicated in the chart, Bitcoin Dominance can return to the yellow range, near the pitchfork midline.
BTC.D can reach Bollinger-midline then starts its downward trend.
✌💥If you are satisfied with my analytical content, please share my ideas💥✌
✍🐱👤Otherwise, make sure you leave comments and let me know what you think.🐱👤✍
🤑🍾Thank you for your support. I hope you will gain profit by following my analyses.🍾🤑
CrazyS✌

CTK, another impulse on the way?If you find this information inspiring/helpful, please consider a boost and follow! Any questions or comments, please leave a comment! Also, check out the links in my signature to get to know me better!
SEED_ALEXDRAYM_SHORTINTEREST1:CTK
Found this on a scan and have been tracking well.
Stalking it since mid-Dec.
Time to take notice, MO.
Reacted from level identified, moved to an AOI identified, with a reaction out of said AOI.
IF:THEN.
NEVER a certainty, obvi, but interesting.

Decentraland 100 Bagger (Boom or Bust Lotto Ticket)BINANCE:MANAUSDT
This isn't an investment idea, it's a lotto ticket.
No real analysis here....
I'm just hoping that a combination of a crypto bull market and Apple's VR headset launch in 2024 throw this silly Metaverse coin into the stratosphere.
Technically, it just needs to match the previous cycle's run on a percentage/time basis.
(Market Cap would be somewhere around $100 Billion or more if this works out, which is insane and demonstrates how unlikely this is)
Obviously, this is a boom-bust play and odds are that it goes to zero.
However, if you are a gambling man/woman and accept the boom-bust odds, maybe it's worth a flyer?
Fat_Fat

SP500 probably deep pullback on early 2024. 29/Dec/23SPX probably complete wave B ( Red Circled) of triangle on early January 2024 where it could dive 20% +/-.

SP500. Is market "re-act" from FED or vice versa? 29/Dec/23SPX's chart/market is driven by Fundamentals ( FED) as most traders perceived. But I do agree with Robert Prechter and Alessio Rastani that market/ chart is driven by the "rotating cycle" of "supply/demand" rather than news/fundamentals even though I don't agree Robert Prechter with (Founder of Elliott Wave International) have been calling for major crash (which is severe than 1929) for many years

📈Gold analysis, Before FOMC Meeting📉OANDA:XAUUSD
FOREXCOM:XAUUSD
Hello dear traders.
Gold is expected to rise to around $1,993 by the time the FOMC meeting begins.
After that, the xauusd process will go through two scenarios.
If the price does not stabilize above 1988 ---> the bearish scenario is more likely
If the fork structure breaks and gold consolidates above 1988, gold could rise to around $2,000 and then $2,016.
Market expectations for interest rates have stabilized at current numbers.(5.5%)
But in my opinion, the tone of the FOMC meeting could be contrary to the market's expectations, and it may not even start the interest rate reduction process next year.
In this case, the bearish scenario is active and the price can even fall to the $1931 range.
P.S: FOMC meeting is going to be like Negan in the picture. It hits or it doesn't!!!
✌💥If you are satisfied with my analytical content, please share my ideas💥✌
✍🐱👤Otherwise, make sure you leave comments and let me know what you think.🐱👤✍
🤑🍾Thank you for your support. I hope you will gain profit by following my analyses.🍾🤑
CrazyS✌

Northam Hinting at Bearish 2024 First HalfNortham price has gone lower than 10 November low seeming to confirm a cycle failure, this puts the share in intermediate decline. We also see price action carving a rising wedge that is yet to break but has a higher confidence in breaking to the downside. We therefore look at the bearish Pitchfork and the retracement lines in how they interact with price & time for guidance on when likely the weekly cycle reaches a bottom. The weekly cycle ranges from 20 weeks, short and 30 weeks on average.


🚨The End of the Bitcoin Rally(💡Signs💡)🚨👋Hi, everyone. I hope you had a great weekend.
🧐Today, I decided to answer the question of whether Bitcoin has reached the end of the Bullish Rally or not ❗️❓
⏰To answer the above question, it is better to look at the Bitcoin chart in the higher time frames, such as daily, 2-day, or weekly.
🌐Bitcoin started to increase after the confirmation of ETFs , but it seems that the result of the news should NOT help Bitcoin anymore, because the reality is that no money has entered the market through companies and we have to wait for the approval of ETFs and then their implementation phase. So it seems that the cryptocurrency market has increased well so far with this news, although when the entry of ETFs is done , we can see more growth of Bitcoin ( According to the news, the first ETF will be approved on January 8-10 ).
💡If we look at the 2-day chart of Bitcoin, we will realize that Bitcoin has been moving in an Ascending channel for more than a year .
💡Another interesting point is that the Pitchfork lines played the role of Support and Resistance very well on the Bitcoin chart so that every time a line breaks upwards, Bitcoin moves up to the upper bar.
🏃♂️Bitcoin is moving near the upper line of the Ascending Channel , one of the Pitchfork lines(0.618) , and the 🔴Resistance zone($51,500_$45,340)🔴 .
🌊In terms of Elliott wave theory , Bitcoin seems to have completed the second impulse wave 5 [ although I expected Bitcoin to touch the 🔴Resistance zone($51,500_$45,340)🔴] .
💡Also, we can see Regular Divergence(RD-) between two Consecutive Peaks.
💡If Bitcoin touches the price range of $34,000-$34,300 , a large amount of LONG positions are exposed to the risk of liquidation , which is unfortunately attractive for exchanges .
💡One thing that can be said about Volume Trading is that, in general, the Volume Trading in the second five impulse waves is much less than the first five impulses == Not a good sign for the continuation of the upward trend of Bitcoin.
💡Another sign that can confirm the decline of Bitcoin is the presence of 🔵 6 CME Gaps 🔵; according to my research, Bitcoin has never created more than 5-6 CME Gaps in one direction, and in the past, Bitcoin has either been in an upward trend or moved down and filled these CME Gaps.
💡In addition, Bitcoin's Dominance(BTC.D%) has approached the 🟡 Price Reversal Zone(PRZ) 🟡, which will indicate the decrease of Bitcoin's dominance in the Cryptocurrency market in the future.👇
🔔I expect that Bitcoin will NOT be able to go above $44,700 in the next days and will fall to the 🟢 Support zone($39,000-$37,000) 🟢 and fill the 🔵 first CME Gap($40,325-$39,290) 🔵 and then spend some time above the support zone. The news of the approval of the fund, if it happens in January, can give temporary growth to Bitcoin, but it seems that the correction will continue at least until the lower line of the ascending channel and the 🔵 Second CME Gap($34,295-$34,160) 🔵.
❗️⚠️Note⚠️❗️: I will try to update you in the lower time frame every day.
❗️⚠️Note⚠️❗️: An important point you should always remember is capital management and lack of greed.
Bitcoin Analyze ( BTCUSDT ), 2-Days time frame ⏰.
Do not forget to put Stop loss for your positions (For every position you want to open).
Please follow your strategy; this is just my Idea, and I will gladly see your ideas in this post.
Please do not forget the ✅' like '✅ button 🙏😊 & Share it with your friends; thanks, and Trade safe.


Absa Begins Descent into Weekly LowAbsa is now in a failed daily cycle, price therefore is seeking a weekly low price in lower highs and lower lows formation. Currently price is due a weak bounce before continuing further downside. Curious is whether price will go lower than 8 May low, I place this at higher probability as price also pursues a yearly low price. We can look at the median line of the Pitchfork and/or the trendline support.
