Market Frequency - Kite Analysis - AudJpy H1 - LongAnalysis
- Black: D1 trend long fork (median line)
- Red: H4 long fork (upper parallel) and previous week's levels
- Orange: H1 short fork (near the median line) and previous day's levels
Next move
- Purple: H1 trendlines,
- Blue: H1 levels to be retested
- Short correction and long trend. The rising move, after a false breakout, can widen. If it breaks, the trend is short.
Pitchforks

BOIL - bullish based on pitchfork analysisBOIL price fell 98% but the technicals (particularly analysis of pitchfork lines) indicate that BOIL is a good buy opportunity.

Scenarios for EGLDWe just broke Resistance 1, but there is another Resistance 2. Even for Resistance 1, it could be a Fakeout. As per the Wedge that has formed, I would be inclined to see three touches on the lower side (only two for the moment), so I would not be surprise to go under previous low, also as a spring of the accumulation. This is still a bearish evaluation, less damage that in my previous related idea (see it linked).

Jet Blue is going big! Jet Blue is a buy and will be for the next two years.
Price moving to $9.50 for possible resistance.
It's making $11 by September.

Unity Pitchfork - BullishThis is what I am seeing for NYSE:U as it looks like it wants to climb up into earnings.

AMD - Bullish PitchforkLooks like NASDAQ:AMD may have found its bottom on this young pitchfork that I see forming actionable setups. After filling the gap it looks healthy and ready for higher prices. Expecting 140s before earnings.

RIVN - Bullish PitchforkThis is what I am seeing on RIVN, looks very bullish. this pull back was a buying opportunity imho.

Netflix - Bouncy Bouncy (bullish)Looks like NASDAQ:NFLX wants to hold its median band (red) on this pitchfork. I expect higher prices to run up into earnings. Could see as high as 450, but a safer bet would be a bounce back to 430+ prior to earnings on July 19th.

Jet Blue Pitchfork Chart - Very actionable (bullish)This NASDAQ:JBLU pitchfork chart looks to be playing out well. After breaking our of a large base in the 6s Jet Blue has its eyes on higher prices.

BTC Pitchfork - Looks actionableSo far so good BTC seems to be following this Pitchfork formation. I have a price target of 33,600 this week or next. Look at how well support help on the bottom green channel today. COINBASE:BTCUSD

Mara Daily Pitchfork - Looks GoodThis is the Daily chart for NASDAQ:MARA and this pitchfork nicely lines up with its recent runup and top wicks. Looking for another test of the mid-band this week.

MSFT bearish pitchfork and RSI analysisMSFT reached a high pitchfork line and the RSI and the price are diverging which is a bearish setup.

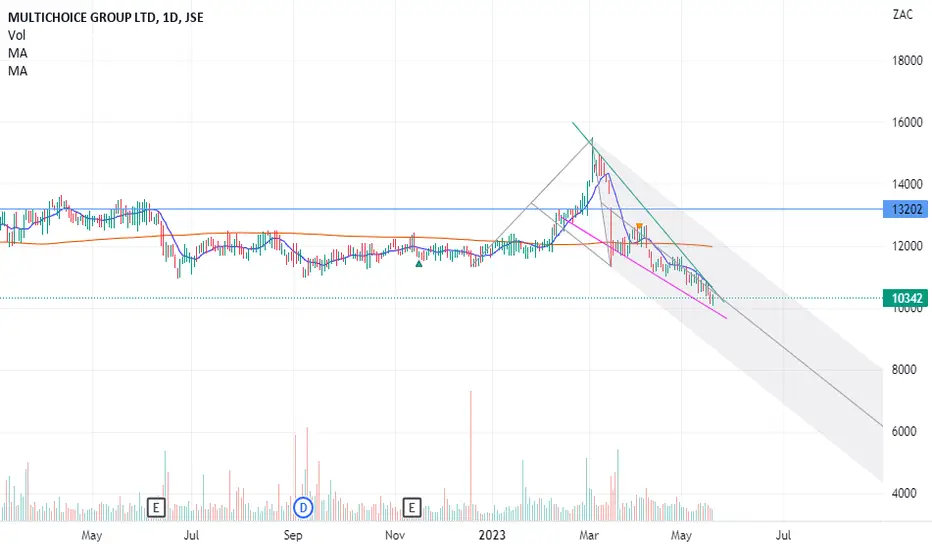
Multichoice (MCG): The Case for a LongMCG is now seeking a weekly & yearly low price, so far price has retracted to below 2 previous low weekly points (week 20 June 2022 & 6 September 2021), the next weekly low point R85.18.
Current weekly cycle is on week 47, previous week duration were 54, 26, 51, 41, on balance of probability we can say we are within 6 weeks to finding a bottom. The current daily cycle is close to a low so either we bottom now, if not we got about another 40-50 days meaning another daily cycle which brings COVID lows into focus & a test of the bottom support of the Pitchfork.
The parameters for entering long:
1. Close above the green line.
2. Close above the 10 week moving average (blue line)
3. Stop loss will be the low point of the weekly swing low price makes or your entry price so there's no loss of capital except trading fees.
This idea will be updated with further guidance as price action gives more pointers.
Market Frequency - Kite Analysis - US100 H1 - LongAnalysis
- Black: D1 long forks (upper parallel)
- Red: H4 long fork (lower parallel) and previous week's levels
- Orange: H1 short fork (median line) and previous day's levels
Next move
- Purple: H1 trendlines
- Blue: H1 levels to be retested

Market Frequency - Kite Analysis - US30 H1 - LongAnalysis
- Black: D1 long fork (between the median and the upper parallel)
- Red: H4 short fork (median line) and previous week's levels
- Orange: H1 fork (between the median and the lower parallel)
Next move
- Purple: H1 trendlines
- Blue: H1 levels to be retested

Market Frequency - Kite Analysis - UsdJpy H1 - LongAnalysis
- Black: D1 long fork (median line)
- Red: H4 long forks (median and upper parallel) and previous week's levels
- Orange: H1 long fork (lower parallel) and previous day's levels
Next move
- Purple: H1 trendlines
- Blue: H1 levels to be retested

Market Frequency - Kite Analysis - EurJpy H1 - LongAnalysis
- Black: D1 long fork (upper parallel)
- Red: There is no H4 fork (near the upper parallel) and previous week's levels
- Orange: H1 long forks and slope (over upper parallel) and previous day's levels
Next move
- Purple: H1 trendlines
- Blue: H1 levels to be retested

Market Frequency - Kite Analysis - CadJpy H1 - LongAnalysis
- Black: D1 long fork (between the median and the upper parallel)
- Red: H4 long forks (over the upper parallel) and previous week's levels
- Orange: H1 long fork and slope (upper parallel) and previous day's levels
Next move
- Purple: H1 trendlines
- Blue: H1 levels to be retested and Fibonacci target levels

Market Frequency - Kite Analysis - AudJpy H1 - LongAnalysis
- Black: D1 trend long fork (median line)
- Red: H4 long fork (upper parallel) and previous week's levels
- Orange: H1 short fork (upper parallel) and previous day's levels
Next move
- Purple: H1 trendlines
- Blue: H1 levels to be retested
- Target: H4 long fork median line. If fork H1 falls, then the target is the top of fork D1.

Watch the S&P500 dip to 4170 - 4195S&P500 - After breaking out from the medium term resistance near the 4170 - 4195 level has managed to highs of 4446. If the current retreat is confirmed by a break down below 4362, the retest of the 4170 - 4195 level is likely. This should make for a good retracement ahead of what could be a rally that can very well break past the recent highs of 4446.

NVDA pitchfork ideaI drew a pitchfork for NVDA! As you can see, the lower area of the pitchfork is support for price. Documnets-.


TSLA bullish outlookMy previous TSLA idea (see related ideas) was bearish and TSLA went down ~16% (over 20% based on yesterday's close, I expected market to be up today, see related SPY idea). My TSLA idea before that (again, see related ideas) was bullish and TSLA went up 54%. Now TSLA looks bullish again based on pitchfork analysis, particularly on weekly chart.
