US500 evening updateBearish count for US500.
Pitchfork drawn from March 2020 low, January 2022 high, October 2022 low.
October 2022 low saw price bounce off .5 fib drawn from January 2022 high to March 2020 low.
Price has been targeting the median line (red line) of the pitchfork since October 2022, but it has never tagged it.
Price teased above the 0.5 line twice (in teal), once in July 2024 and once in October 2024 (green ellipses).
Price attempted to get above .5 line again today and was promptly rejected.
Price has formed an impulse off 5 August low, with 1>3>5.
I would say this is a short opportunity; if price is to stay below resistance of 5884.7 and below .5 line of pitchfork. If median line cannot be tagged, then price will find its way (quickly) back to October 2022 low.
Key support is 5088.9.
Pitchforks

ETHUSDComplete count for ETHUSD.
If ETHUSD has bottomed on 5 August, I think this is how you have to count it.
The truncation would be unusual, but I think that is the only way to get a complete impulse from June 2022 bottom.
Price bounced off of .618 fib on 5 August and has held within pitchfork ever since.
Lots of room to run if bulls can take price towards median line of pitchfork.

First Neiro(NEIRO) Ready to Fall==>> -15%_-20%!!! Today I want to analyze the First Neiro ( BINANCE:NEIROUSDT ) has recently gained significant attention in the cryptocurrency market, with a remarkable +87% increase in price over the past week .
The First Neiro(NEIRO) is Memcoin and operates on the Ethereum Blockchain .
The First Neiro( BITGET:NEIROCTOUSDT ) has reacted well to Andrews' Pitchfork lines , so we use these lines as Support and Resistance lines .
The First Neiro(NEIRO) attacked the Potential Reversal Zone(PRZ ) three times(In each attack, the volume is reduced ), but failed to break this area .
According to the theory of Elliott waves , it seems that NEIRO has succeeded in completing 5 impulsive waves and we should wait for a correction .
I expect First Neiro(NEIRO) to drop at least -15%, and if the Support zone($0.00156-$0.00148) breaks, we should expect a further drop (-20%) .
First Neiro Analyze (NEIROUSDT), 4-hour time frame⏰.
🔔Be sure to follow the updated ideas.🔔
Do not forget to put Stop loss for your positions (For every position you want to open).
Please follow your strategy and updates; this is just my Idea, and I will gladly see your ideas in this post.
Please do not forget the ✅' like '✅ button 🙏😊 & Share it with your friends; thanks, and Trade safe.

SOLUSDT Long Setup Setting / It's Risky but we are traders ...BINANCE:SOLUSDT
COINBASE:SOLUSD
📈Which side you pick?
Bull or Bear
SL1 ---> Low-risk status: 3x-4x Leverage
SL2 ---> Mid-risk status: 5x-8x Leverage
(If there is just one SL on the chart, I suggest, low risk status)
👾Note: The setup is active but expect the uncertain phase as well.
➡️Entry Area:
Yellow zone
⚡️TP:
142.20
148.44
157.38
🔴SL:
126.23
b]🧐The Alternate scenario:
If the price stabilize against the direction of the position, below or above the trigger zone, the setup will be canceled.


XAGUSD evening updateBullish count for XAGUSD.
This count has price in wave 5 of (3), which would have it tag the median line above 47.
Valid as long as price stays above 26.449.

BTCUSD afternoon updateBullish count for BTCUSD.
This count has price in wave 3 of (3) of ((3)) of iii.
Price has been "reacquired" by major pitchfork structures, and bulls are looking for price to continue to target median lines.
Bullish hoping to see continued bullish price action over the weekend, with ATHs in sight.
This count needs to stay above 66659.55 to remain valid.

US500 afternoon updateUpdated bull count for US500.
Target for bulls is red median line of pitchfork (drawn from March 2020 low/January 2022 high/October 2022 low.
Current count has price in wave (3) of iii of (iii) of (v). Wave (2) tagged .618 fib drawn from 17 October high of 5884.7 to 15 October low of 5806.6.
Key support for this count to remain valid is 5806.6. Also key for price to remain above .5 median line support (teal line).

US500/NAS100 evening updateUS500 and NAS100 drawn with completed impulse waves down from 14 October highs.
US500 tagged .618 retracement this afternoon, and NAS100 has formed what looks like a zigzag with contracting ending diagonal c wave.
Highs of yesterday (16 October) reasonable stops for any shorts, with anticipated additional impulse waves down from those highs.

NAS100 afternoon updatePrice action falling out of the pitchfork without tagging the median line is certainly not bullish...
From 5 August low, I can see a contracting diagonal forming, with waves (1), (2), and (3) having fairly clear three-wave corrective structures/patterns.
Wave (4) in this interpretation would be an expanded flat, with wave c to go below 19614.1 and having Fibonacci and trend-line support to stay above 18676.2.
Wave (5) would then likely finish above 20758.4 to complete the pattern.

BTCUSD morning analysis (bullish)Summary of action for BTCUSD since 5 August 2024 low.
Area in yellow ellipse does not look impulsive. There is a way to get an expanding leading diagonal out of it, but it certainly does not have the "right look". Will need to come back to this price action later, depending on how future price action plays out.
Area in first red ellipse labeled 1. is similarly vague. It might be a zigzag, but again doesn't have the right look. Will come back to this price action later as well.
Area in first green ellipse labeled 2. is not the prettiest impulse in the world, but it can certainly be counted as such.
Area in second red ellipse labeled 3. looks very much like a zigzag corrective structure, bottoming at 58897.55 (which is now the must hold support for bulls).
From what I can tell, price action after the bottom at 58897.55 has two impulse waves up (small green ellipses) and two corrective structures (small red ellipses). The two corrective structures both look like expanded flats, and if true would likely mean price action after 58897.55 is a 1-2/1-2 looking for wave 3 rather than 1-2-3-4 looking for wave 5. Price getting above 69632.35 on an impulse wave off today's low of 65226.43 would confirm that assessment.
Overall, this does look quite promising for bulls, who have been waiting patiently through 7 months of consolidation.
Key level of support today is 65226.43. Key resistance to break is 69632.35. Good luck.

ARBUSDT Long Setup Setting / Layer2BINANCE:ARBUSDT
COINBASE:ARBUSD
📈Which side you pick?
Bull or Bear
SL1 ---> Low-risk status: 3x-4x Leverage
SL2 ---> Mid-risk status: 5x-8x Leverage
(If there is just one SL on the chart, I suggest, low risk status)
👾Note: The setup is active but expect the uncertain phase as well.
➡️Entry Area:
Yellow zone
⚡️TP:
0.5415
0.5519
0.5612
0.5732
🔴SL:
0.5022
🧐The Alternate scenario:
If the price stabilize against the direction of the position, below or above the trigger zone, the setup will be canceled.


YM1! evening updateAnalysis of YM1!.
This count sees price in wave ((5)) of (v), with wave (v) starting at October 2022 low.
From 5 August 2024 low, count in red is less bullish, count in green is more bullish.
If count in red is correct, then 5 must be shorter than 3 (as 3 was shorter than 1), and price will not go above resistance at 45062.
If count in green is correct, price would be in wave 3 of (3) of ((5)) and extend above 45062.
Regardless of whether green or red is correct, each ends primary wave (v), and if median line of pitchfork cannot be tagged, it suggests that price will revisit October 2022 lows.
As price gets closer to 45062, reward/risk for YM1! short off that resistance improves.

RENUSDT 1:1 Long Setup SettingBINANCE:RENUSDT
CRYPTO:RENUSD
SL1 ---> Low-risk status: 3x-4x Leverage
SL2 ---> Mid-risk status: 5x-8x Leverage
👾The setup is active but expect the uncertain phase as well.
➡️Entry Area:
Yellow zone
⚡️TP:
0.03480
0.03530
0.03603
0.03693
🔴SL:
0.03163
🧐The Alternate scenario:
If the price stabilizes below the trigger zone, the setup will be cancelled.

USOUSD Short - 1h - October 8th 2024Based on the weekly chart, price is expected to push lower after jumping higher at the opening. Looking at the short term PF, price should pull back up to the 0.5 parallel to retest which is now a resistance after the harsh daily rejection. After that, we expect it to continue lower and fully form the bottom wick of the weekly candle. We can see we have some confluence between the 50 EMA cloud and the ceiling mentioned above which makes a good entry for sells.

XAUUSD morning updateXAUUSD looks to be consolidating at the top border (2nd target) of both pitchforks drawn.
The origin of the bigger pitchfork is the December 2015 low of 1046.00.
Based on this count, I'd like to see a pullback towards the white rectangle, in the low 2300s, for a wave 4 before a wave 5 targeting above 3000.

ADA long setup / 1:1 SettingBINANCE:ADAUSDT
COINBASE:ADAUSD
SL1 ---> Low-risk status: 3x-4x Leverage
SL2 ---> Mid-risk status: 5x-8x Leverage
👾The setup is active but expect the uncertain phase as well.
➡️Entry Area:
Yellow zone
⚡️TP:
0.3454
0.3500
0.3560
0.3617
0.3674
🔴SL:
0.3196
🧐The Alternate scenario:
If the price stabilizes below the trigger zone, the setup will be cancelled.

possibility of a correctionIt seems that according to the inflation and labor market news, there is a possibility of a correction

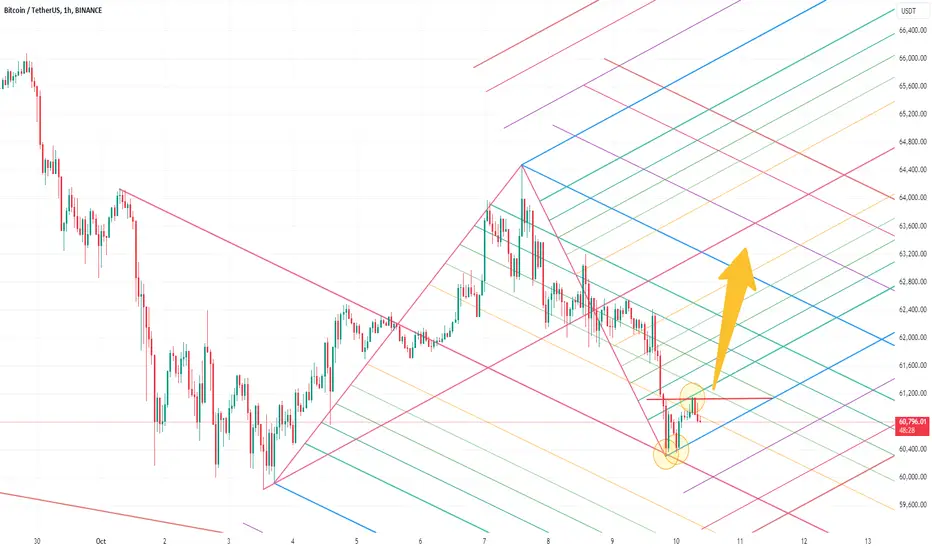
BITCOIN long setup / Bulls or Bears, Tell me in CommentsBINANCE:BTCUSDT
COINBASE:BTCUSD
Hello Traders
💥Long position on BTC
SL1 ---> Low-risk status: 3x-4x Leverage
SL2 ---> Mid-risk status: 5x-8x Leverage
👾The setup is active but expect the uncertain phase as well.
➡️Entry Area:
Yellow zone
⚡️TP:
63,900
64,500
65,300
66,150
67,000
🔴SL:
60,100
🧐The Alternate scenario:
If the price stabilizes below the trigger zone, the setup will be cancelled.

Quick SPX Scenario for Retesting Lower Support zoneBINANCE:SXPUSDT
BINANCE:SXPUSDT
SL1 ---> Low-risk status: 3x-4x Leverage
SL2 ---> Mid-risk status: 5x-8x Leverage
👾The setup is active but expect the uncertain phase as well.
➡️Entry Area:
Yellow zone
⚡️TP:
0.2629
0.2596
0.2560
0.2510
🔴SL:
0.2783
🧐The Alternate scenario:
If the price stabilizes above the trigger zone, the setup will be cancelled.

VETUSDT 1:1 Long Setup SettingBINANCE:VETUSDT
COINBASE:VETUSD
SL1 ---> Low-risk status: 3x-4x Leverage
SL2 ---> Mid-risk status: 5x-8x Leverage
👾The setup is active but expect the uncertain phase as well.
➡️Entry Area:
Yellow zone
⚡️TP:
0.02525
0.02551
0.02581
0.02621
🔴SL:
0.02354
🧐The Alternate scenario:
If the price stabilizes below the trigger zone, the setup will be cancelled.
