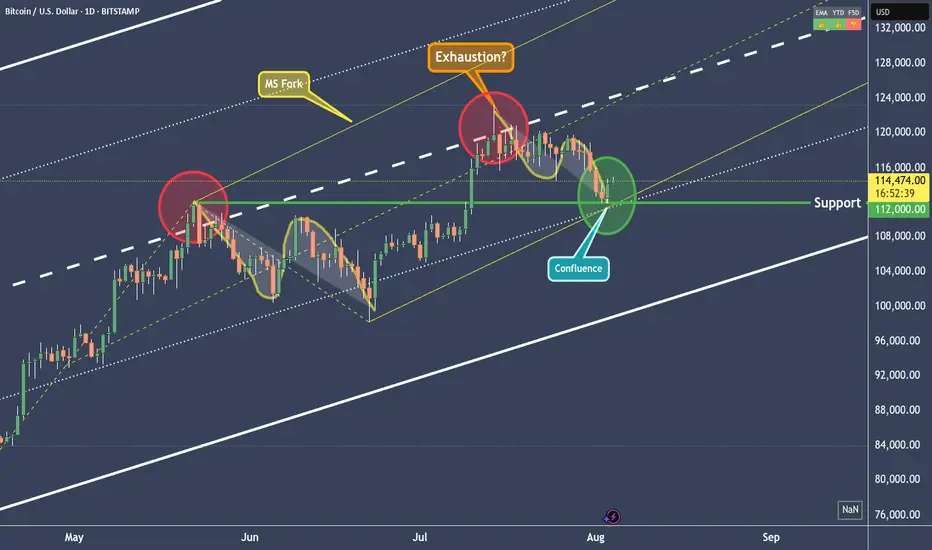
BTCUSD - Right to the point!In the last post (see the Linked Chart), I showed why BTCUSD would fall, and I also pointed out where the first price level for a possible pause might be.
On Friday, that level was reached, and the market seems to be turning *on the dot*. Will we now see higher prices again, or even a new all-time high? Let’s take a closer look:
The “confluence” point is marked by the white fork and the yellow modified Schiff fork. This point lies exactly on the 1/4 line. And this line often indicates temporary levels where at least a pause in the movement can be expected.
When we look at what Bitcoin did at this price level in mid-June, it seems likely that it will rise again. The overall pattern, from the centerline to the 1/4 line, looks extremely similar (see the A-B-C Wave Pattern)!
And yet, I’m not entirely convinced by the picture. Because this was the second time we reached the centerline.
For the brave, this wouldn’t be a bad entry point—or an opportunity to increase the position after this pullback. A possible stop for traders could be placed just below the current low, with targets at the centerline of course.
But why not just lean back, enjoy the profits, and switch into observation mode for now…
I will also make a video that explains the details and connections more clearly.
Happy Monday and stay patient to fight the FOMO! §8-)
Pitchforktrading
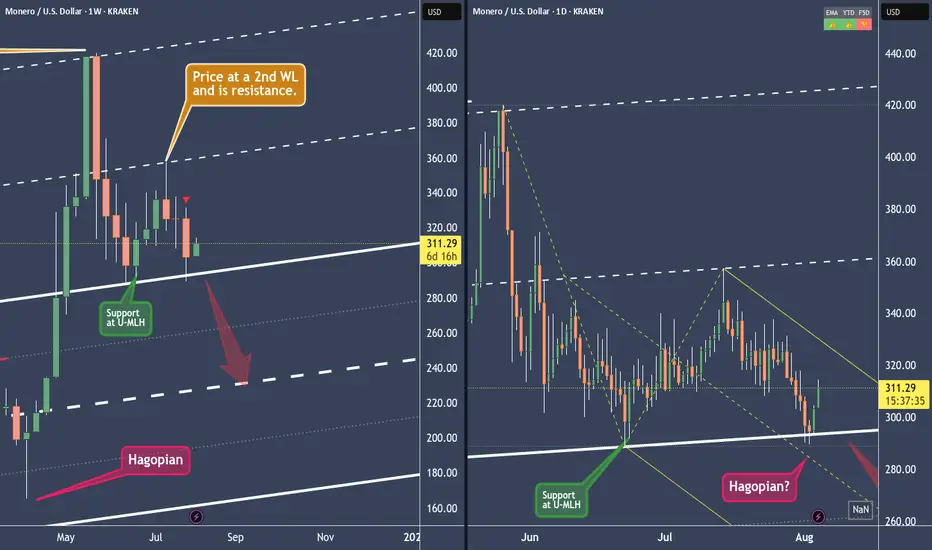
XMRUSD - Monero is strong. But strong enough?Can Monero break the U-MLH of the yellow Fork to stop the down-drift?
In the last post we see that Monero has the potential to reach the white Centerline at around $240. At least this is the view on the weekly Chart.
On the other hand we see support at the U-MLH in the daily Chart.
Until the U-MLH of the yellow Fork isn't breached by a open and close outside, the weekly short projection is in play.
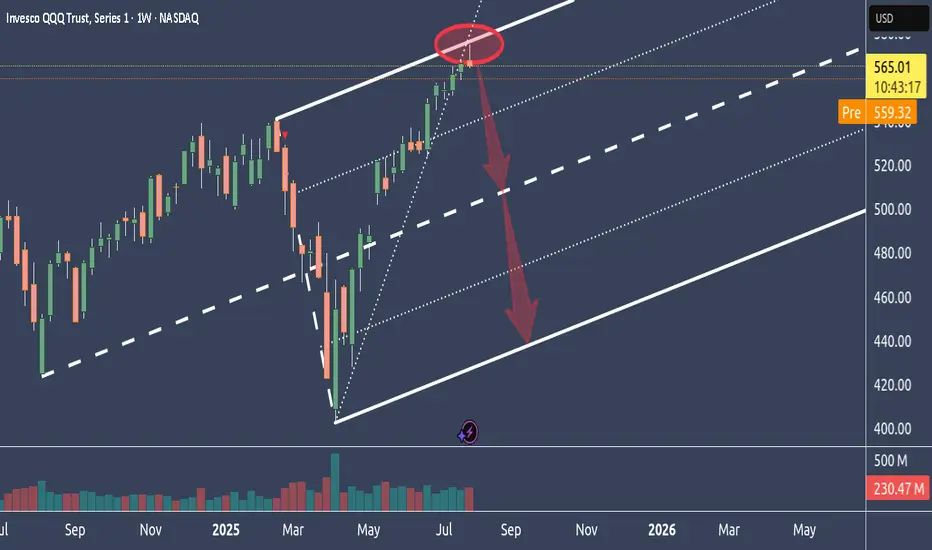
Why NQ is probably tanking big timeIn this weekly chart, we see QQQ, which represents the Nasdaq.
As we can see, it had a hell of a run up.
Too far too fast IMO, and it reached the stretch level at the Upper Medianline Parallel.
The natural move is now to let go, take a breath and trade down to center again, which is the Centerline.
After all the most major and most important earnings results are over, and Funds have pumped up their gains through manipulative Options plays, it's time to reap what they have planted and book the gains.
It's all in line with, all moves are at the point, and everything is showing in a simple chart.
Unless price is opening and closing outside of the U-MLH, it's time to load the Boat and sail to the South.
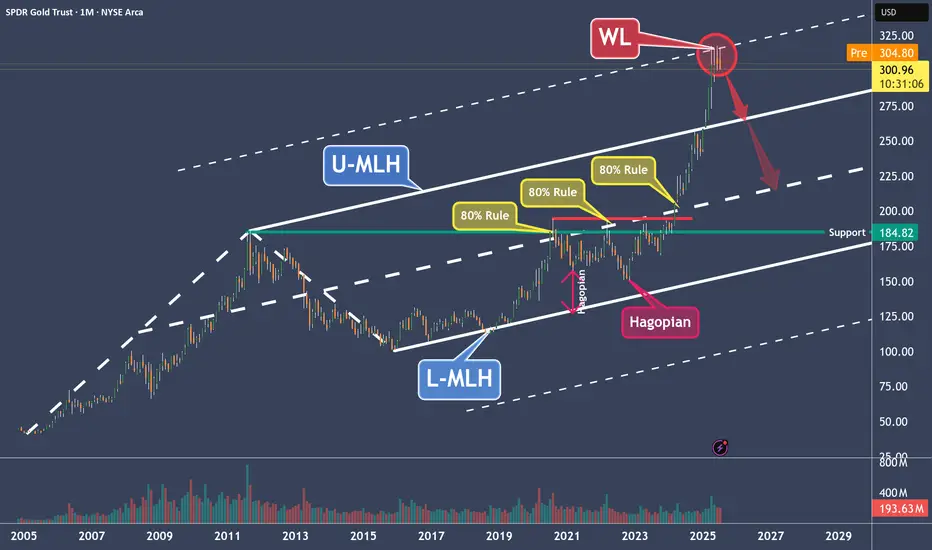
GLD – Why Gold Is a Clear Short to MePrice moved from the Lower Median Line (L-MLH) up to the Centerline, fulfilling the 80% rule.
Then we had two Hagopians, which sent price right back to the Centerline.
After the breakout above the Centerline, the next target was the Upper Median Line Parallel (U-MLH), which was reached rather quickly.
Finally, price broke above the U-MLH and was pulled up toward the Warning Line (WL).
Is this the end of the happy story?
I think so—because Gold has now reached its 2nd standard deviation, and there’s probably no more gas left in the tank.
The Trade:
- A logical target is the U-MLH.
- A secondary target is the Centerline.
At the very least, if you're long, this might be a good time to take some profits—because no tree grows to the moon.
For further details, I will follow-up with a Video explanation - See my Signature.
XRPUSD - Target reached. Reversal on the plateSo, that was a nice long trade.
Now price is stretched at the Upper Medianline Parallel (U-MLH).
As of the time of writing, I already see price pulling back into the Fork. A open and close within the Fork would indicate a potential push to the south.
Target would be the Centerline, as it is the level where natural Meanreversion is.
Observation Hat ON! §8-)

DOGEUSD Has reached it's (first?) targetAfter reaching the Centerline, price eitheradvances to the Upper Extreme (U-MLH), or it reverses and it's target is the L-MLH, the lower Extreme of the Fork.
An Open & Close below the Centerline would indicate further progress to the downside.
A stop above the last high with a target around 2 would be the trade I would take.

Fall Down to $70 ApproachingWith the RSI above average since mid-April 2025, the trend has been steadily rising up to $82 per share even breaking the highs from late February and March.
Price projected onto both (A and B) Inside pitchforks is well above the median line. In the pitchfork A the price is even directly touching the upper parallel line.
Reversal near the highest achieved price this year on 21st February is probable
Based on these indications, we can expect a fall to around $70 somewhere in the middle of May.
Key details:
RSI over "overbought" level
Price in both Inside pitchforks near the upper parallel line
Longer uptrend = breakdown necessary

Bitcoin / Euro Pitchfork experimental ideaDoes Bitcoin / Euro give a new perspective compared to the usual Bitcoin / USD chart?
I drew a Modified Schiff Pitchfork with anchor-points December 2018, November 2021 and November 2022.
It seems to respect the Fib levels and 0.25, 0.5, 0.75, 1.0 levels well. Let´s see how it plays out.

NQ - Nasdaq's potential to reboundThe Median or Centerline:
The Median (Centerline) Line is the central element of the Pitchfork and acts as the equilibrium point. Price tends to oscillate around this line, and it often serves as a strong reference for potential reversals or price targets. A price move back toward the Median Line is common after significant moves away from it.
Pitchfork (Red):
The red Pitchfork, drawn through significant price points, provides the overall trend direction and shows the potential path to the downside. The red line indicates a bearish bias in the current setup, as it has been guiding the price lower.
Green Circles and Arrows:
These represent key areas of support.
The lower green circle and green arrows indicate price has found solid support in this region. The price has been bouncing from this support level, showing that it is reacting to the [ower boundary of the Pitchfork. This behavior aligns with the rule that the price tends to respect these boundaries, creating a foundation for a potential move back toward the Median Line.
Price Action Analysis:
The price recently tested the lower green circle and green arrows, bouncing off this support level, which is a typical reaction in a Pitchfork setup.
According to the Median Line theory , when the price moves too far away from the Median Line, it often returns toward it. Therefore, the bounce off the lower boundary suggests that price may now be setting up for a bullish reversal toward the RED Median Line .
Bottom Line:
The price action is following the general Pitchfork playbook . The bounce from the lower green circle suggests that the price is setting up for a potential bullish reversal toward the RED Median Line .
The next major test will be the upper resistance in the red Pitchfork , after the break of the Centerline. If the price can break through this resistance, a strong move higher is likely.
Keep an eye on this critical point!

GOLD Reached it's Apex and is ready for a dumpIn my earlier posts I said that Gold has the potential to reach the U-MLH, which has become true.
Up there, the price of Gold is stretched. Yes it can go up even more beyond the Upper-Medianline-Parallel. But the overall numbers of occurrences are small.
So, at this natural stretch, price has a high probability to revert to the mean. And this is supported by the fact, that the overall indexes are heavenly oversold and already showing the signs of a pullback to the North (see my last NQ post).
Why not just watch how it plays out, and make a decision for a trade after the FOMC, or even tomorrow. Don't rush into these unknowing situations. Be patient and wait for clear signs to take action.

Carvana - More Fish To Come? You Bet!After the first post about CVNA, I bailed out on a small loss (see linked Chart). But then Immediately loaded Puts and had a good "Steak & Lobster" time §8-)
Price behaves like textbook when we consult the Medianlines trading framework and rule set.
First price reached the red Centerline, followed by the expected pullback to the white Lower-Medianline-Parallel.
If the "Fish" can't manage to jump back into the white Fork, then I expect much more downside to come. If this is the case, we have two good looking PTG's at PTG1 & PTG2.
To me, this Scam Company (see my first post) is done. It's just a matter of time.
For the longer time frame, I will check out ITM LEAP-Puts and let them profit from the ride to the south.
And for short term trades, I just wait for pullbacks as it did now, and take it short to finance some of my LEAPs, Dinner and Weekend Holidays.
Isn't it nice, how we can find good even in bad? §8-)
May the Fish be with us!

ZINC - Seems it breaks monthly supportThe lanted green support line has a crack.
It's a first indication of a turn in mid-term trend.
Long term Medianline view on ZINC shows that price is battling at the L-MHL. If we get a weekly close and new open below it, it's ripe for a short.
At least I will stalk it on the daily.
PTG1 is the Center-Line.

GC - Golden Rocketship To The U-MLHWe got on the Rocket-Ship earlier and took profit.
If you're still in with a position, or if you can manage to get in with a decent Risk/Reward, you may want to aim for the U-MLH.
The Stars look good and profits are twinkling §8-)
If the 1/4 line is cracked, we will see a follow-through.

SPOT - My Mom Says I Have A short Bias...hmmm...Most of my Charts I analyze are currently showing a short setup. Mom says I'm shorting the whole world.
hmmm...
However, here's another one, just to keep the streak going. §8-)
Spotify is at the U-MLH = At the upper extreme.
The next natural move should be down to the Centerline.
Since I have no magic wand to show me the Future, I lean on my stats and my experience.
Shorting Spotify down to the Centerline or getting stopped out abve the U-MLH.
Simple (...but not easy ;-) )
...have to run, Mom calls for Dinner.

NFLX - NetFlix is overhyped an TA says tooBesides what I think about NFLX (bad for you, poor quality & service, lairs etc.), there is something that can be used to rate and judge a Stocks pricing - The Technical Analysis.
The white Fork projects the most probable path of price. The U-MLH is the upper stretch, the L-MLH the lower and the CL is the Center, where price is in equilibrium.
Where is price now?
It mooned to the upper Warning-Line!
Such moves are insane, crazy, not healthy and produce by manipulation and/or greed that eats Brains.
However - As I follow the rules of the Medianlines (Forks), I know that price is hyper extended up there. So, it can't go further? Of course it could. But Chances are poor that it will.
Instead, Chances are high that price falls down to the U-MLH. At least.
Why?
Besides price is stretched, it failed to move up to the next Warning Line (WL2).
So, there you have it.
I'm shorting NFLX and my target is at least the U-MLH, with further downside potential with PTG2 at the Centerline.

MSTR - 3 Potential Support LevelsPotential Support levels are where the green small arrows are:
white L-MLH
red CL
red L-MLH
All tough, I think MSTR Ponzi will dye over the mid term.

NQ Short Term Long - Second ChanceThis is a intraday short term trade.
Yesterday price stopped at the L-MLH as expected.
Today we have the second bounce at it.
A nice second chance for a long entry.
Target is the Centerline and above.

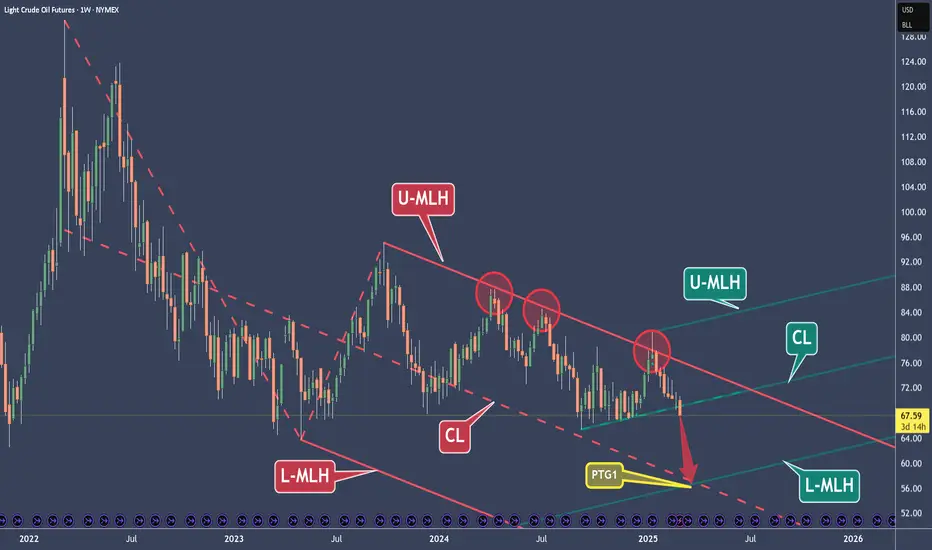
Crude Oil – A $10 Short with a Valuable LessonThe price hit the Upper Median Line Handle (U-MLH) three times and was rejected each time (red circles). These were all high-potential short trade opportunities.
However, none of these short trades managed to reach the Profit Target Goal (PTG) at the Center Line (CL). When the price repeatedly fails to hit the CL, it often builds up momentum for a larger move.
The last short opportunity from the U-MLH was at Circle #3. If you missed it, you have another chance now. Breaking the "shelf" (the petrol support line) is just like breaking a Median Line or a Center Line. It’s not magic—though it may sometimes seem like it.
The three slanted petrol lines extending to the right function the same way as a fork. So, we just broke the (petrol) Center Line, right?
Now, where is the price likely to go after breaking this (petrol) Center Line?
That’s right! There is about an 80% probability that it will move towards the (petrol) Lower Median Line Parallel.
What a coincidence—it aligns exactly with the red Center Line!
Of course, this is all based on probabilities, not guarantees. We can't predict the future, but we can rely on rules, statistics, and knowledge.
I hope you learned something today.
If you enjoy my work, I’d appreciate it if you like and share it with others.
Have a great day! 😊
NVIDIA At The 1/4 Line - Secure Profits Now?
Currently at the 1/4 line, we can expect a potential pullback. So, if you want to secure some of your fat profits, just do it.
Why not 50% ?
If it goes up again, you have secured 50%.
If it goes down, you still have 50% for a runner.
However, I'm still follow the rule-set and the trading-framework of the Medianlines. Doing this, I know that prices PTG is the Center-Line.

NQ - Nasdaq Bounce Port IntradayNasdaq is stretched, I prepare for a bounce at the Lower-Medianline-Parallel.
Targets are at the Centerline and U-MLH.
My S/L is planned for roughly 50 Points because of this crazy Volatility.

MSTR Bounce expectedIt looks like price found a support at the L-MLH.
From here, I expect a bounce, at least up to the Center-Line, if not all the way up to the Upper-Medianline-Parallel.
Long term, my expectations have not changed.

QQQ - The Warning-Line Scenario For A ShortIt's simple a s that:
If price can't make it back into the Fork, then it's doomed to reach at least the Warning-Line.
This scenario likely happens if the current weeks bar close below the Warning line, and the open of the new Bar is also outside of the Fork.
Happy Short §8-)

Navarro Harmonic & Pitchfork StrategyNavarro pattern formation is present. According to our pitchfork strategy, after the price exits the pitchfork channel, our target levels are 100%, 150% and 200% respectively. Good luck.
