PI bullish Breakout!! BUY BUYHello traders i hope you are doing as we can see Market done breakout from falling wedge as well as we are having liquidity and FVG which is not metigated yet so i am expecting market back to FVG
buy buy!!
Piusdtanalysis

Bearish Pressure Builds on PIUSDT – Here’s the Trade Plan📌 Idea
PIUSDT is showing weakness after testing the recent resistance at 0.85944. Price is now trading below the VWMA, indicating fading bullish momentum and potential for further downside.
The setup favors a short entry as price fails to reclaim above the resistance zone, forming lower highs and showing signs of rejection.
🔽 Trade Setup
• Entry: 0.80799
• Stop Loss: 0.90983 (above resistance zone and wick high)
• Take Profit 1 (TP1): 0.66507 (first support zone)
• Take Profit 2 (TP2): 0.58008 (previous demand area)
⚙️ R:R Breakdown
• TP1 R:R ≈ 1.92
• TP2 R:R ≈ 3.31
This gives a good reward potential relative to the defined risk.
🔍 Technical Highlights
• Recent Resistance Level at 0.85944 rejected multiple times
• VWMA is trending above price – bearish bias confirmed
• Support Zone near 0.66507 acting as TP1
• TP2 marks a significant previous low near 0.58008
🧠 Idea Summary
I'm watching for further rejection under 0.85944 and signs of weakness to ride this short toward the support zones. This trade remains valid as long as 0.90983 holds as resistance. A break above this level invalidates the setup.

If you're stuck, watch (full analysis)Hello friends
Given the high growth of this token, now that it has made a good correction, it makes sense to buy in stages and with capital management and move with it to the specified goals.
*Trade safely with us*

PI UPDATEHello friends
According to the triangle pattern that the price has formed, you can see that we had a decline and after that the price has managed to create a small ascending channel that indicates the inflow of money and we can expect the price to grow to the ceiling of the channel within the channel itself and in case of failure in the lower ranges, other buying steps have been identified.
*Trade safely with us*

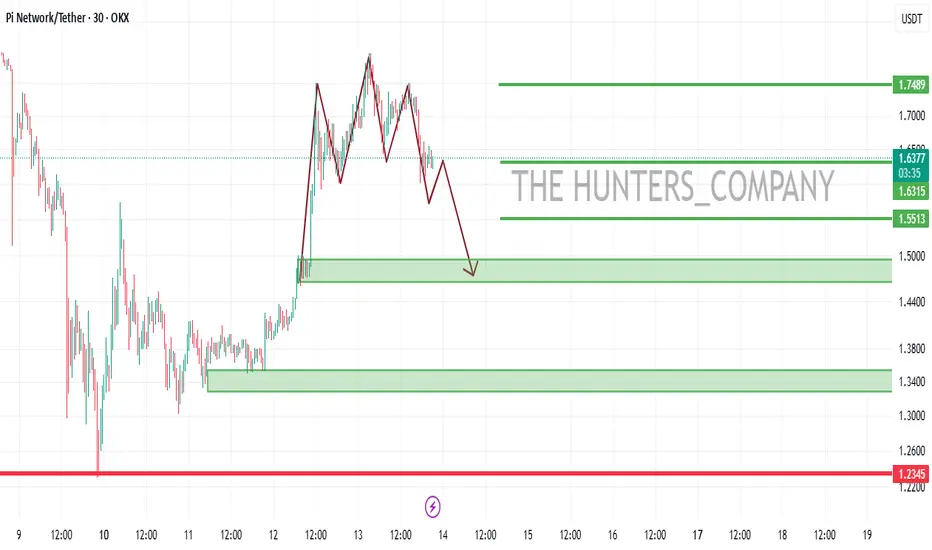
PI/USDT:SIGNALHello friends
Given the price growth, you can see that we had a stop and a triangle pattern was formed, which is a continuation pattern of the trend.
Now, given the complex market conditions, our suggestion to you is to buy in stages and be sure to observe risk and capital management.
I have also specified goals for you.
*Trade safely with us*

Just In: $PI Dips 6% Losing The $1 Pivot- Is There Still Hope?The price of the crypto currency NASDAQ:PI saw s noteworthy dip today, down by 6% approaching All time Low (ATL). With massive selling pressure, NASDAQ:PI has lose the $1 pivot to the bears.
However, with the appearance of a falling wedge, it clearly hints at an impending bullish reversal on the horizon with a speculated 350% surge albeit the crypto is having its own fair share of the marker's volatility.
With the RSI at 31 further hinting at a trend reversal, a breakout might be lurking around the corners.
Pi Price Live Data
The live Pi price today is $0.678989 USD with a 24-hour trading volume of $213,832,968 USD. Pi is down 5.03% in the last 24 hours. The current CoinMarketCap ranking is #26, with a live market cap of $4,612,460,558 USD. It has a circulating supply of 6,793,134,138 PI coins and a max. supply of 100,000,000,000 PI coins.

From Rejection to Explosion: PI Breaks FreeThe price of PI/USDT has been moving within a well-defined falling channel, consistently facing rejection from the upper trendline and finding support at the lower boundary. Notably, the price has bounced multiple times from the falling support line, indicating it as a significant dynamic zone.
Recently, the price broke out of this descending channel with strong momentum, suggesting a potential trend reversal. The breakout candle is accompanied by high volatility, signaling bullish strength.
Additionally, the previous support zone, which turned into resistance, has now been reclaimed. This flip adds further bullish confirmation.

PIUSDT : Head & Shoulders Signals a Major Drop Incoming!Yello, Paradisers! PIUSDT is flashing strong bearish signals! The price has formed a Head & Shoulders pattern right on the resistance trendline of a descending channel—this combination significantly increases the probability of a sharp move to the downside.
💎PIUSDT breaks below the neckline and closed a candle which validates the bearish setup, increasing the likelihood of further downside.
💎However, We have to wait for the proper retest of the neckline, patience is key for the right entry.
💎On the flip side, if PIUSDT breaks above the resistance zone and closes candle above it, the bearish setup will be invalidated.
Stay disciplined and wait for confirmation, Paradisers. A fakeout could trap impatient traders—don’t be one of them! 🎖
MyCryptoParadise
iFeel the success 🌴

PI...Hello friends
Given the good growth we had, we now have the opportunity to buy in the pullback...
You can buy in steps within the limits we have specified for you with capital management...
*Trade safely with us*
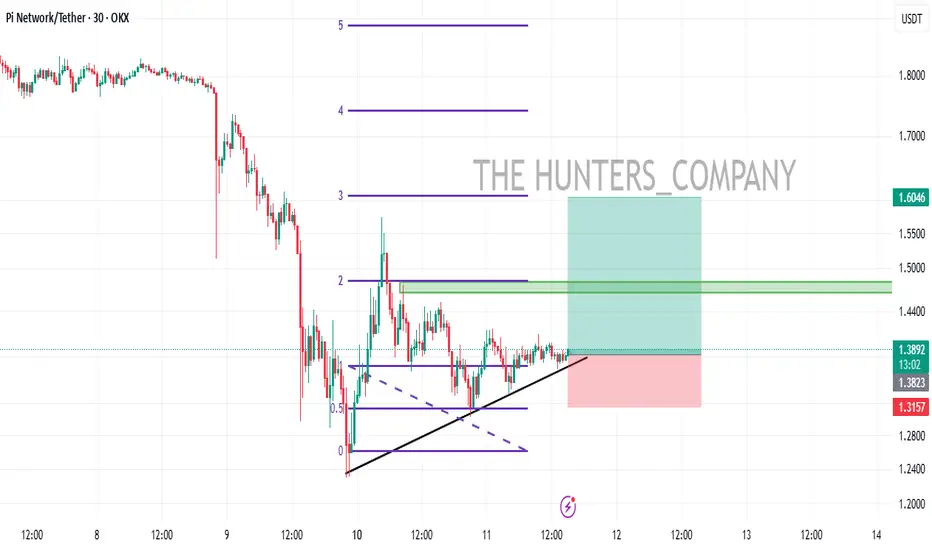
PI/USDT (UPDATE)Hello friends
Given the price drop, now with the formation of a triangle and the price compression, we will probably have a good pump, so we have determined the entry point and price targets for you to enter with risk and capital management.
*Trade safely with us*
$Pi Price Showing Rising Wedge Pattern NASDAQ:PI Previous Post Hit the Stoploss and Now Time to Big Pump

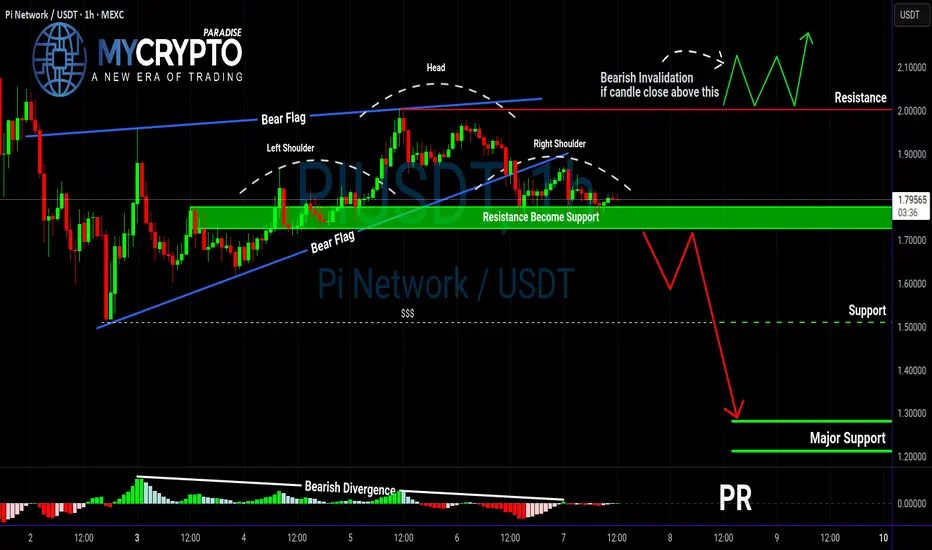
PIUSDT Breakdown Incoming? Bearish Patterns Are Stacking Up! Yello, Paradisers! Is PIUSDT about to break down hard? The charts aren’t looking great, and the confluence of bearish signals is something we can’t ignore.
💎PIUSDT has formed a bear flag on the higher timeframe, a classic continuation pattern that suggests further downside. This alone is already a bearish signal, but there’s more.
💎On the lower timeframe, we can see a head & shoulders pattern forming, along with bearish divergence. These factors together significantly increase the probability of a move to the downside.
💎In the case of PIUSDT breakdown and closes candle below the support zone, this will confirm the bearish setup and likely trigger selling pressure. A breakdown at this level would validate both the bear flag and the head & shoulders pattern.
💎If the price bounces from here, the bearish bias still remains, but there’s also a chance that the market is setting a trap within this range. This makes it a high-risk zone, so it’s better to avoid trading here until a clearer move develops.
💎However, If the price breaks and closes candle above the resistance zone, the bearish outlook will be completely invalidated. In that case, it’s smarter to wait for a more defined price action before making any moves.
🎖Patience is key, Paradisers. The market loves to shake out inexperienced traders before the real move happens. Stay disciplined, focus on high-probability setups, and trade like a pro. Only those who truly understand market cycles will capitalize in the end!
MyCryptoParadise
iFeel the success 🌴