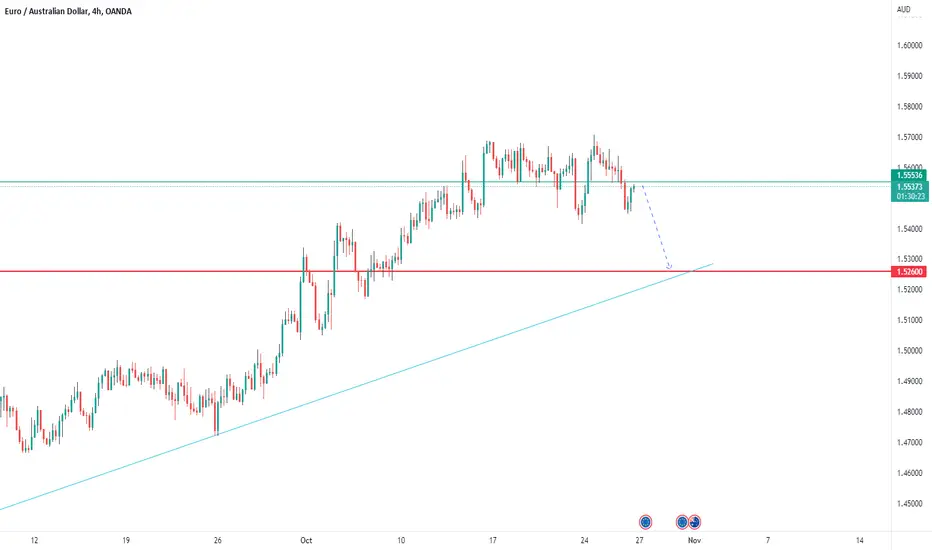
EURAUD Takes A BreatherEurAud has been on a steady bull run and now takes a breather thus experiencing sideways trading.
We can expect a drop towards the trendline .
Pivot
Special Entry Patterns - IPO'sJS-TechTrading Masterclass : Special Entry Patterns - IPO's
In a previous tutorial, I have explained the general characteristics of a perfect buy point. In this tutorial, we will look at IPO's (Initial Public Offerings) and discuss how to identify primary bases.
IPO's coming out of primary bases can make huge price moves - let's discuss how to find the next monster mover, similar to what stocks like Amazon could achieve after their Initial Public Offering phase.
Perfect Entry Points – IPO’s – The Primary Base
When it comes to investing in IPO stocks, new issues don't play by the usual rules.
Companies making initial public offerings draw a lot of investor attention. That often results in unusual and brand-new chart patterns. Volatility can rise as investors size up demand for the new stock. Yet there are opportunities in these cases, if you can spot the correct characteristics amid the price-and-volume action.
The framework of a good IPO base is simple. The decline from peak to low usually doesn't top 20%, but the most volatile markets have produced declines of up to 50%. The length is often less than five weeks and can be as short as seven days. These two factors alone make IPO bases wayward cousins compared with proper bases, such as the cup with handle and flat base, which need at least five to seven weeks of work.
In an IPO base, the pattern typically starts within 25 days of the stock's first day of trading. Know the important similarities with regular bases. For example, the buy point is drawn by taking the prior high and adding 10 cents. The price gain on the breakout should be strong.
There are ways to evaluate these blind spots, however. Important factors include seeing a shallow correction within the base during normal market conditions, a large increase in price and a close near session highs on the breakout day, and heavy volume on the breakout day and week.
Also, the stock should generally form the base above its IPO price.
Example - ServiceNow (NOW)
The business software company, went public in June 2012, at 18 a share and has built its primary base during the period from the initial offering to April 2013 when the stock developed its first perfect buy point.

PYPL weekly bearish hammerOrder SELL PYPL NASDAQ.NMS Stop 85.11 LMT 85.11 will be automatically canceled at 20230401 01:00:00 EST
PYPL weekly bearish hammer stop loss above local high pivots.

EURUSD Bullish Continuation EURUSD gathered momentum and rallied bullishly hitting my initial targets before pulling back.
Price is now in a corrective phase before resuming the bull trend.
Watch out for reversal confirmation on the highlighted support level.
JS-Masterclass #6: The Perfect Buy PointThe Perfect Buy Point
A Perfect Buy Point represents the completion of a stock’s consolidation and the potential start of its next advance. After a base pattern has been established, the Perfect Buy Point is where the stock establishes a price level that will act as the trigger to enter a trade.
When a stock’s price level moves through the Perfect Buy Point, there is a high probability that this represents the start of the next advancing phase.
You can also call the Perfect Buy Point a “call to action” price level – it is the optimal buy point.
In the context of a stock’s Volatility Contraction Pattern, a temporary pause (also called a base building process) allows you to set a buy stop to enter a trade. You want to buy as close to thePerfect Buy Point as possible without chasing the stock up more than 1.0%. In this context, the use of buy stop limit orders is recommended.
As a solid consolidation process and the formation of a Volatility Contraction Pattern are needed before a Perfect Buy Point can occur, The Perfect Buy Point can also be considered as the line of least resistance. A stock can move very fast once it crosses this threshold. When a stock breaks through the line of least resistance, the probability is high that the price level will move much higher in a short period of time.
This is the case because this represents an area where supply is low. Therefore, even a small amount of demand can move the stock higher.
The importance of the Volume at the perfect Buy Point
A Volatility Contraction Pattern is needed before a Perfect Buy Point can develop. As explained earlier, supply will stop coming to market at the ed of a valid Volatility Contraction Pattern. This is why we want to see the Volume significantly come down in the day or the couple of days before the Perfect Buy Point develops.
Now, with only very little supply of stock in the market from sellers, even a small amount of buying can move the price up very rapidly as the price level moves through the Perfect Buy Point.
In the ideal case, this move through the perfect Buy Point occurs under heavily increasing volume. This might be an indication that big institutions are putting their big money into the stock.
When all of this comes together, you want to place the order as close to the Perfect Buy Point as possible.
Always wait for the price level to move through the Perfect buy Point!
Some traders will try to get in before the breach of the pivot point to save a few pennies on the trade. Assuming that a stock will break out is dangerous and the breakout may fail. Be patient!
Remember
Even if you respect all these technical requirements of a Perfect Buy Point, you will still get stopped out and incur losses.
BUT: Trading is all about probabilities…respecting these rules will increase your probability to enter profitable trades and significantly outperform other traders and increase your chances to be consistently profitable in the market.

UPL*Price has formed and retested the ascending triangle pattern.
Can take the long entry when 708.00 gets break till 721.00 or higher.
Profit of 1% for intraday/swing, in swing hold your trade if it is winning as most probably it will break the 721.
STOP LOSS - near 696.00
NOTE - LOOK VOLUME WHILE BREAKOUTS.

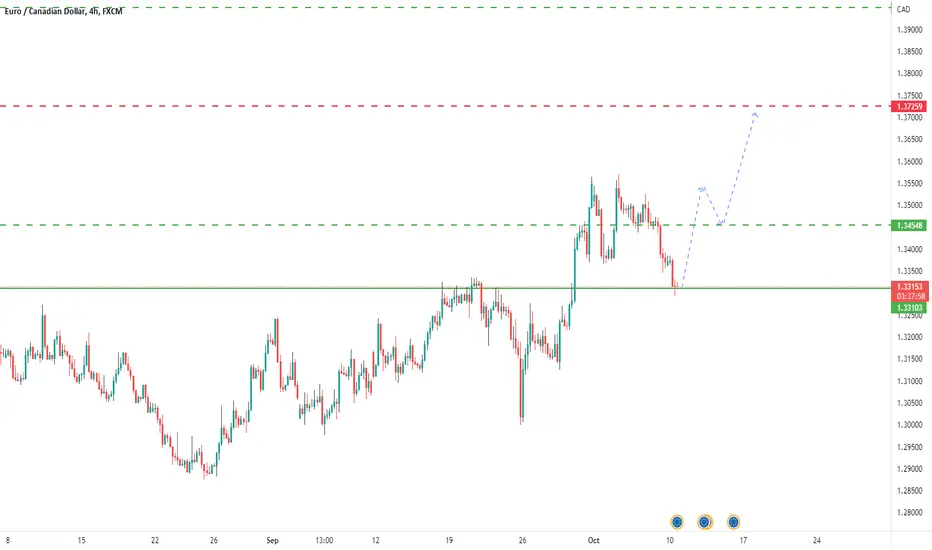
EURCAD LONGThe pair broke above the resistance and has retraced back to it.
This being the monthly pivot we can expect bullish price movement towards the resistance 1.37263.
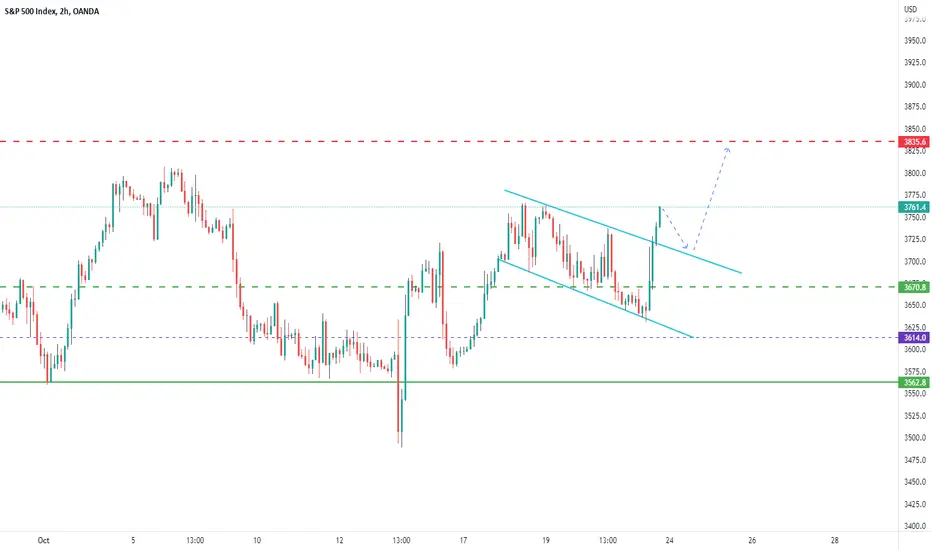
SP500 Gathers Bullish MomentumThe price gathered bullish momentum and finally broke out of the descending channel.
We can expect bullish price movement towards the resistance 3835.
WMT weekly bearish hammerOrder SELL WMT NYSE Stop 127.41 LMT 127.41 will be automatically canceled at 20230401 01:00:00 EST
WMT weekly bearish hammer. B wave or 3 wave it's going down. Stop loss above pivots.

Is the pullback on EURUSD over? It looks like the pullback that started at the end of September has already come to an end.
This will provide us with selling opportunities.
If we see that the price comes back to around 0,9867, we can wait for rejection and then sell.
Another sell setup could be a breakout and test of 0,9750.
We are not selling at current price levels!
We are also not looking for long positions!

Rise in EURUSD EURUSD bounced off 0,9808 yesterday but it still hasn't moved towards the parity.
We can potentially see another retest of the same level today and that could give us buying opportunities.
The target remains at 1,0090 but we have to watch out around the other important levels- 0,9915 and 0,9999.
This scenario is only valid if price doesn't break below 0,9725!

$QQQ New Uptrend to watch$QQQ new uptrend formed
Stochastic divergence from recent low of
9.29.22, suggesting low may be a Swing pivot pt.
in Fibonacci .50-.618 objective zone.

3735 Level Broken3735 has shown to be a line in the sand , support or resistance for trend within the megaphone pattern
We could build a base for support here or reject today


FSLR daily bearish hammer at local highOrder SELL FSLR NASDAQ.NMS Stop 139.35 LMT 139.35 will be automatically canceled at 20230401 01:00:00 EST
FSLR daily bearish hammer at local high. This time stop loss goes above monthly resistance area and will run into MA 100.

Important levels for EURUSD We expected more upside movement on EURUSD after the low from last week.
However, it looks like the market doesn't have enough strength and we don't have a reason to buy.
The continuation up will be confirmed upon break above 0,9808.
Before that we could see another drop but right now, we don't have a sell signal either.
That's why we should wait for a better setup before taking a trade.

WTI Crude Oil headed for 96?Following a 3-day pullback from 93.64, WTI produced a bullish engulfing candle on the daily chart which closed back above the 20-day EMA. Given the strength of the rally from the 76.30 low, we suspect a corrective low has been found.
The 4-hour chart shows that there was a lot of trading activity around 87.60 since the September low (which marks the volume POC / point of control). But also note that yesterday's low held above a previous bullish engulfing candle on the 4-hour chart, rebounded above the 200-bar EMA and a bullish engulfing candle closed firmly above trend resistance. Prices are pulling back in Asia so we're now looking for opportunities to enter long above the 88.0 area / monthly R1 pivot point, and anticipate prices to retest the 94 highs and head for 96 - or even the high around 97.66.

EURHUF - Good Example of using Pivot PointsI've been trading for over 7 years and I've come to love pivot points! I see pivot points being used constantly and i just wanted to show you EURHUF on a 15 minute chart as an example. When the US market opened they made big moves around yesterday's price level until it hit the first support level. I use pivots to scalp the market so i can compound my longs and shorts to make up for any losses that may have happened!
Pivots are usually only used in day or swing trading on the 1 minute, 5 min and 15 min charts. Zoom out to multiple time frames to check the trend and then take orders only in the direction of the trend to have some confluence going on. Don't just take trades blindly without fully being aware of what's going on. Make sure you read all and any economic news that is out there!!
NOTE: Pivots don't always work but for the most part you can see them being used here in real time.
(This is just a guide to show you how pivots are used, this is not a trading signal)
I don't mind sharing because i want all of us 5% to make some so the big can loose some :)

Simple box to look up down trendA simple box in 20 candle to monitor price
Top is the highest and bottom is the lowest of close in 20 candles.
As close is moving outside this box then the signal is up or down trend.
Code sample:
low_val = ta.lowest(close, 20)
high_val = ta.highest(close, 20)
//Create Box
box bx = na
bx := box.new(time , high_val, time, low_val, xloc=xloc.bar_time, bgcolor=color.new(color.aqua, 90), border_width=1)
box.delete(bx )

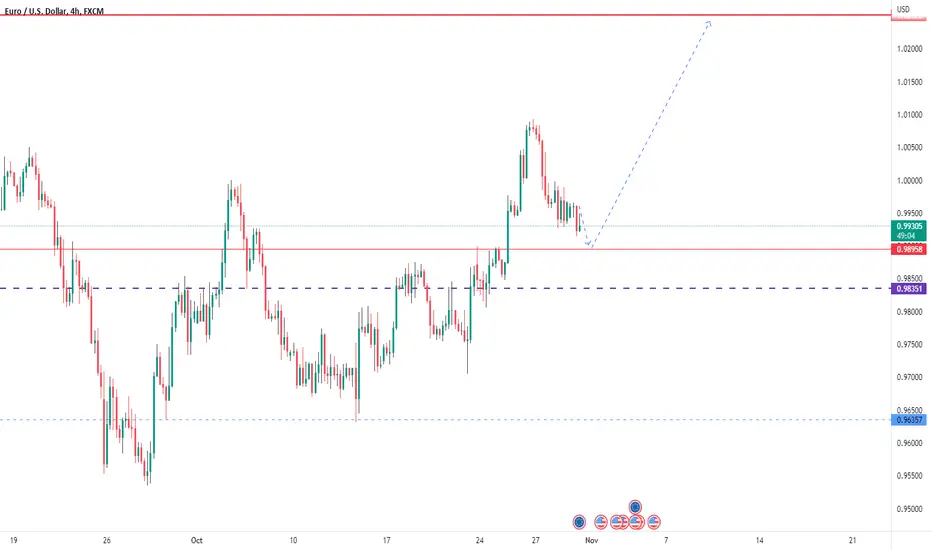
EURUSD Completes The RetracementEURUSD has completed the retracement right at our entry suggesting a strong bullish move towards the monthly resistance of 1.01202.
Long orders with take profit levels as highlighted on the chart.

GEO daily beginning of wave 5 uptrendGEO daily beginning of wave 5 uptrend. Stop loss under local low pivot.

Dollar sweeps the floor with the world. 🧹🌎The DXY is cooling off but is the run over? Unlikely in my opinion but I am by no means an absolute master. So take the following with a grain of salt.
Ive noticed people on Twitter have stopped calling for the Dollar top to be in. Including myself when I thought the Double top would lead to a pull back. Little did I know what was actually going on.
Each local top the Dollar has put in, the correction held support right at the top of the Blue Zone on the FIBZIA (.764)
Worth noting that it corrected below all previous local tops but printed HL's the entire way. I dont think this time will be different.
I also do not think the FED will choose to prolong the inflation war and pain to cater to the U.N. who is pleading for a pivot.
High rates are making it hard for smaller countries and economies pegged to the dollar to service their debt and the USD will continue to destroy them while sucking up the liquidity.
If the FED pivots early it hurts America and at the end of the day I think the US will want to retain its status as the top dog no matter what happens to other countries.
Cue the #milkshaketheory
If you have never heard of this term or theory its def worth the 5 minute search.

HD: Double bottom?Home Depot Inc
Intraday - We look to Buy at 285.03 (stop at 271.38)
Buying pressure from 265.00 resulted in prices rejecting the dip. Posted a Double Bottom formation. The reaction higher is positive and highlights a clear reversal. A weaker opening is expected to challenge bullish resolve. Dip buying offers good risk/reward.
Our profit targets will be 328.98 and 340.00
Resistance: 300.00 / 330.00 / 418.00
Support: 285.00 / 265.00 / 150.
Please be advised that the information presented on TradingView is provided to Vantage (‘Vantage Global Limited’, ‘we’) by a third-party provider (‘Signal Centre’) . Please be reminded that you are solely responsible for the trading decisions on your account. There is a very high degree of risk involved in trading. Any information and/or content is intended entirely for research, educational and informational purposes only and does not constitute investment or consultation advice or investment strategy. The information is not tailored to the investment needs of any specific person and therefore does not involve a consideration of any of the investment objectives, financial situation or needs of any viewer that may receive it. Kindly also note that past performance is not a reliable indicator of future results. Actual results may differ materially from those anticipated in forward-looking or past performance statements. We assume no liability as to the accuracy or completeness of any of the information and/or content provided herein and the Company cannot be held responsible for any omission, mistake nor for any loss or damage including without limitation to any loss of profit which may arise from reliance on any information supplied by Signal Centre.
